
College Football Top 10: 2000 vs. 2016

Last night, Clemson beat Alabama in amazing fashion, scoring the game-winning touchdown with only one second left on the clock. Clemson is quite an interesting case as they’ve only just recently become a powerhouse in college football. They’ve been in and out of the top 25 since 2000 and flirted here and there with the top 10, but didn’t land in that prestigious group until just a few years ago, in 2013, when they finished 8th. They dropped to 15th in 2014, then finished 2nd last year and, of course, 1st this year. Here’s a bump chart visualization I created showing their final rankings each year since 2000.

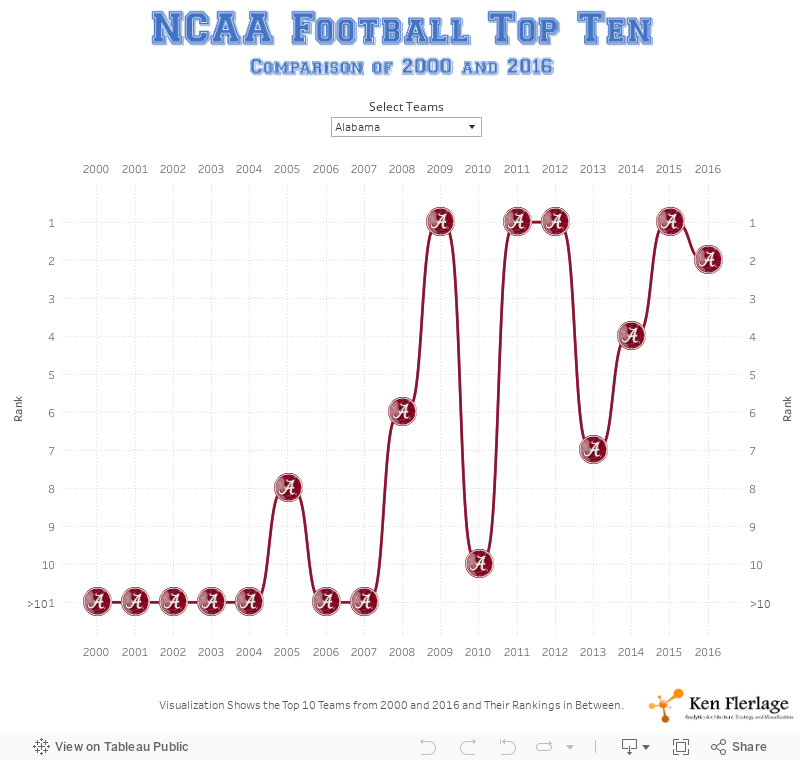
And, though Alabama lost, there is no doubt that they are an amazing team. They’ve finished 1st four times in the last eight years. But, not unlike Clemson, it was not that long ago that Alabama was not even a top 25 team. From 2000-2007, Alabama only ranked in the top 25 twice—11th in 2002 and 8th in 2005. Then, in 2007, Nick Saban took over and, besides that first season, Alabama has been ranked in the top 10 every year. Here’s a bump chart showing Alabama’s final rankings since 2000.
If you’d like to dig into the rankings data further, here’s a complete visualization which shows the top 10 teams from 2000 and 2016 and tracks their rankings in between. At the top, you can select specific teams to display, in case it’s a bit too noisy.
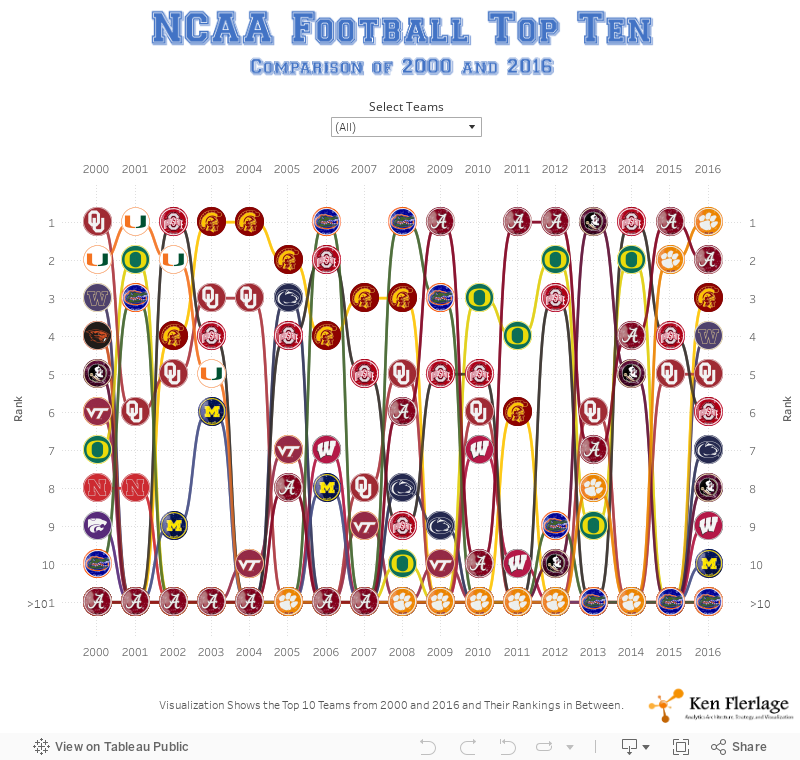
Note: Since I’m embedding this into my blog, the visualization here is sized down slightly. If your device can handle a higher resolution, I’d recommend viewing the full-size visualization here.
Ken Flerlage, January 10, 2017


nice!
ReplyDelete