
Tableau Public APIs Plus a VOTD Data Set

I
recently shared details on my new Tableau Public Stats
Service,
which allows you to sign up to receive a personalized Google Sheet containing
your Tableau Public stats, updated daily. The service leverages the Tableau
Public API and Python to collect and distribute these stats. After unveiling
the service, I had some great conversations with Will Sutton and learned that
he’s been working on documenting all of the Tableau Public APIs that are
available for us to use. I was really intrigued and asked if he’d be willing to
write about it in a guest blog. So, I’m really excited to have Will join us
today for a blog on the topic.
Will
Sutton
is a Senior Data Analyst at the BBC where he is
responsible for producing and maintaining Tableau dashboards to help the BBC
improve its understanding of UK audiences across TV, radio and online services.
Will actively participates in many Tableau
community projects such as #DiversityinData, #PreppinData, #RWFD and #IronQuest. In addition to his amazing Tableau Public profile, Will is also a skilled programmer
as you can see by his website, https://wjsutton.github.io and his Github
profile.
Tableau Public Viz of the Day Dataset
Inspired by Ken's
Tableau Public Stats Service, I wanted to share my Viz
of the Day (VOTD) data set with the community.
Since its inception, Tableau Public has selected over 2,000 “Vizzes of the
Day.” The very first VOTD was a viz on Education
Marginalization Worldwide by Ross Perez way back
in 2010 and they’ve been picking VOTDs on a regular basis ever since (though
not quite every day).
Using the Tableau
Public APIs (more about these later), I’ve compiled all of these into a single
data set (see link above). This data set is publicly-available and updates
daily so that you always have the latest viz of the day. The data includes the
vizzes, views, favorites, thumbnails, full screenshots, descriptions, tags, attributed
authors, and much more.
So, please check it out
and be sure to share what you’ve created. Perhaps your viz will be added to the
list!!
Tableau
Public APIs
Now that I’ve shared my VOTD data
set, let’s talk a bit about the APIs I used to build it. The Tableau Public
website uses many APIs to show and display data on authors and the Tableau
vizzes they create. These APIs are publically accessible data sources, meaning
you use the data for your projects be it visualizations or for learning coding
skills like R or Python. Here are a few community examples we’ll look at in
this post:
•
Extract data to use in your Tableau vizzes (as Ken shared above)
•
Build a personalised portfolio page (like Annabelle
Rincon
has done)
•
Use it to enhance other projects (like my 2020 Iron viz Submission
from Twitter Gallery)
I’ve been documenting Tableau Public
API calls as I find them on Github
and wanted to share back what I’ve learned and ways you can use these APIs for
your projects.
Jargon
Buster
Before we jump into the discussion,
let’s first introduce some of the jargon I’ll be using:
•
API - Stands for “Application
Programming Interface” and is just a fancy way of sending or receiving data.
•
JSON - Stands for “JavaScript
Object Notation” and is a type of data structure that is formatted into a
hierarchy/nodes commonly used in websites. Many APIs will return data to you in
a JSON structure.
•
Parameter - a value you can
alter in an API call to change the call output (similar to a parameter Tableau
Desktop/Public).
Where
to Find Them
Let’s take a look at an example where
we’ll find an API from the Tableau Public website, extract the JSON data and
convert it to a CSV file. I like maps so I’ll be searching for “maps” Tableau
Public’s newly
improved search page.
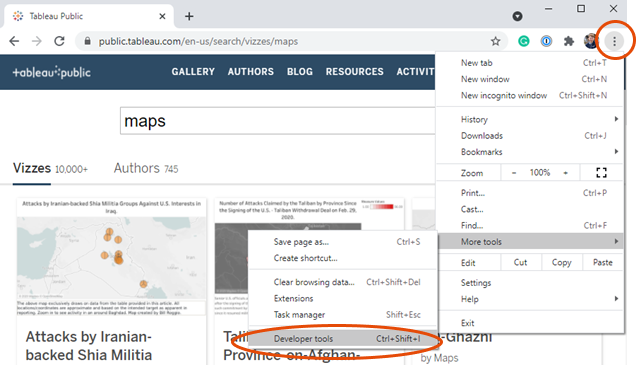
Step
1 - Open Google Developer Tools
In a Google Chrome browser, navigate
to a Tableau Public page that has some data and open Google Developer Tools: 3
dots > More tools > Developer tools (Ctrl + Shift + I)
Step
2 - Open Network > Click XHR > Reload the page
In the Google Developer Tools menu
switch over to the Network tab on the top row and then filter for “XHR” on the
third row. Refresh the page or press Ctrl + R and you should see parts of the
web page being loaded.

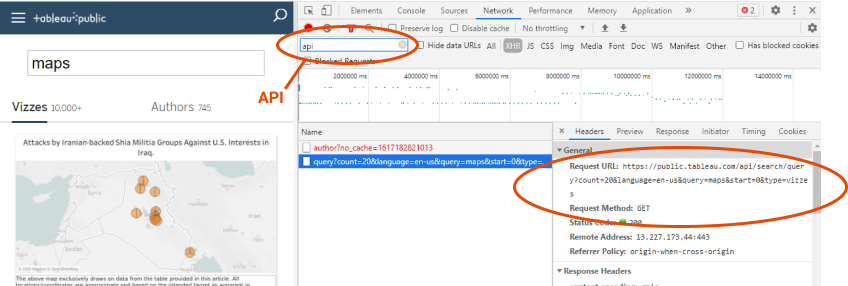
Step
3 - Type query into the search box > Click on the Name to see the API call
When you reload the page you should
see the individual sections of the webpage load. You can view each
individually, but for our case, typing “api” into the search box will narrow
the results to just the API calls. Clicking on the name will show the URL for
the API call. We’ve now found the URL of the API that is being used in the
site!!
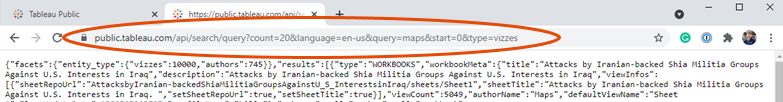
Step
4 - Verify the API call in a new browser tab
Copy the URL found in Step 3 and
paste this into a new browser tab. You should see data returned in a JSON
format.
Step
5 - Change some of the parameters to see how the API works (optional but fun!)
The full API URL from above is https://public.tableau.com/api/search/query?count=20&language=en-us&query=maps&start=0&type=vizzes,
but if we take a closer look at it, this has a bunch of different pieces. We
can split these up as follows:
•
Header - https://public.tableau.com/api/
•
Type of Call - search/query?
•
Parameters - count=20&language=en-us&query=maps&start=0&type=vizzes
The parameters can be further split
up into each individual parameter:
•
Count - Number of results
returned (limited to 100 as shown in the screenshot below).
•
Language - Language of
content.
•
Query - Your entered search
query.
•
Start - Which page to pull
results from; useful if you want more than 100 results.
•
Type - Filter for the type of
search (in this example, we’re searching for “vizzes”, but you can also look
for authors too).
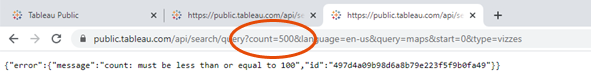
Now that you know all of the
different parameters, you can try different values and then test the call in
the API in the browser. This type of experimentation is how I discovered that
the max count is 100.
Convert
the JSON to a CSV
Now that we’ve identified the API, we
need to put it into a structured format that can be easily handled by Tableau.
One straightforward option is to convert the data to a comma-separated values
file (CSV). This is straightforward since there are services online for
performing this conversion. Just search for “convert json to csv” and you’ll find
a number of free services. For example, I’ve taken the JSON output of the API
and copied it into https://konklone.io/json/.
I’ve then chosen a comma-separated output, which can be easily downloaded into
a file.
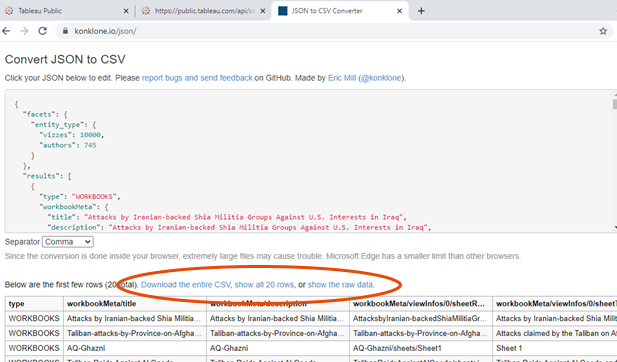
Tableau also handles JSON data
natively, so you can consider just keeping the JSON format and connect it
straight to Tableau. Mark Reid’s blog post, Tableau
Public API, walks through this method.
In addition, scripting languages like
Python or R can be used to call the API and convert the JSON to CSV. Below is
an example using Python:
The code can be found on my Github: https://github.com/wjsutton/tableau_public_api/blob/main/Python/search_example.py
And, because we’re now using code,
you can do many other things with the data. You could insert it into a
database, write it to a spreadsheet, or just about anything you wish. For more
examples, see https://github.com/wjsutton/tableau_public_api
API
Call Examples
In this section, I’ll walk you
through some of the APIs and potential use cases or examples from the
community. As mentioned above, there is more documentation on Github: https://github.com/wjsutton/tableau_public_api
Workbook
Stats
The most common use for Tableau
Public APIs is looking at a user’s workbooks, which uses this API call to
return the first 300 workbooks from a profile.
https://public.tableau.com/profile/api/wjsutton/workbooks?count=300&index=0
To use this yourself, first replace
“wjsutton” with your Tableau Public username. The API is limited to a maximum
of 300 workbooks, so if you have more, you’ll need to call the API multiple
times. You just need to set the index parameter to the numeric ID of the
workbook you’re starting with. So, after calling the above API, you’d then call
it again, changing index to 300.
The Tableau Community has some great
examples that use this API:
•
Josh Tapley’s Cerebro
Project
•
Andre de Vries’ Web
data connector
•
Ken Flerlage’s Tableau
Public Stats Service
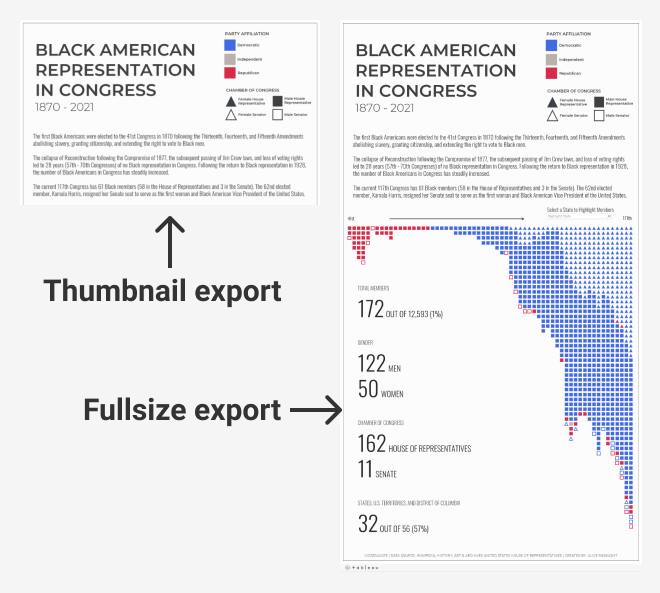
Workbook
Image
Now that you have data on all of your
workbooks, you can also pull images related to the workbooks. There are two
types of images
1) Thumbnails - The cropped images you see on profile pages.
2) Full Images - The image you receive when you download a dashboard
image.
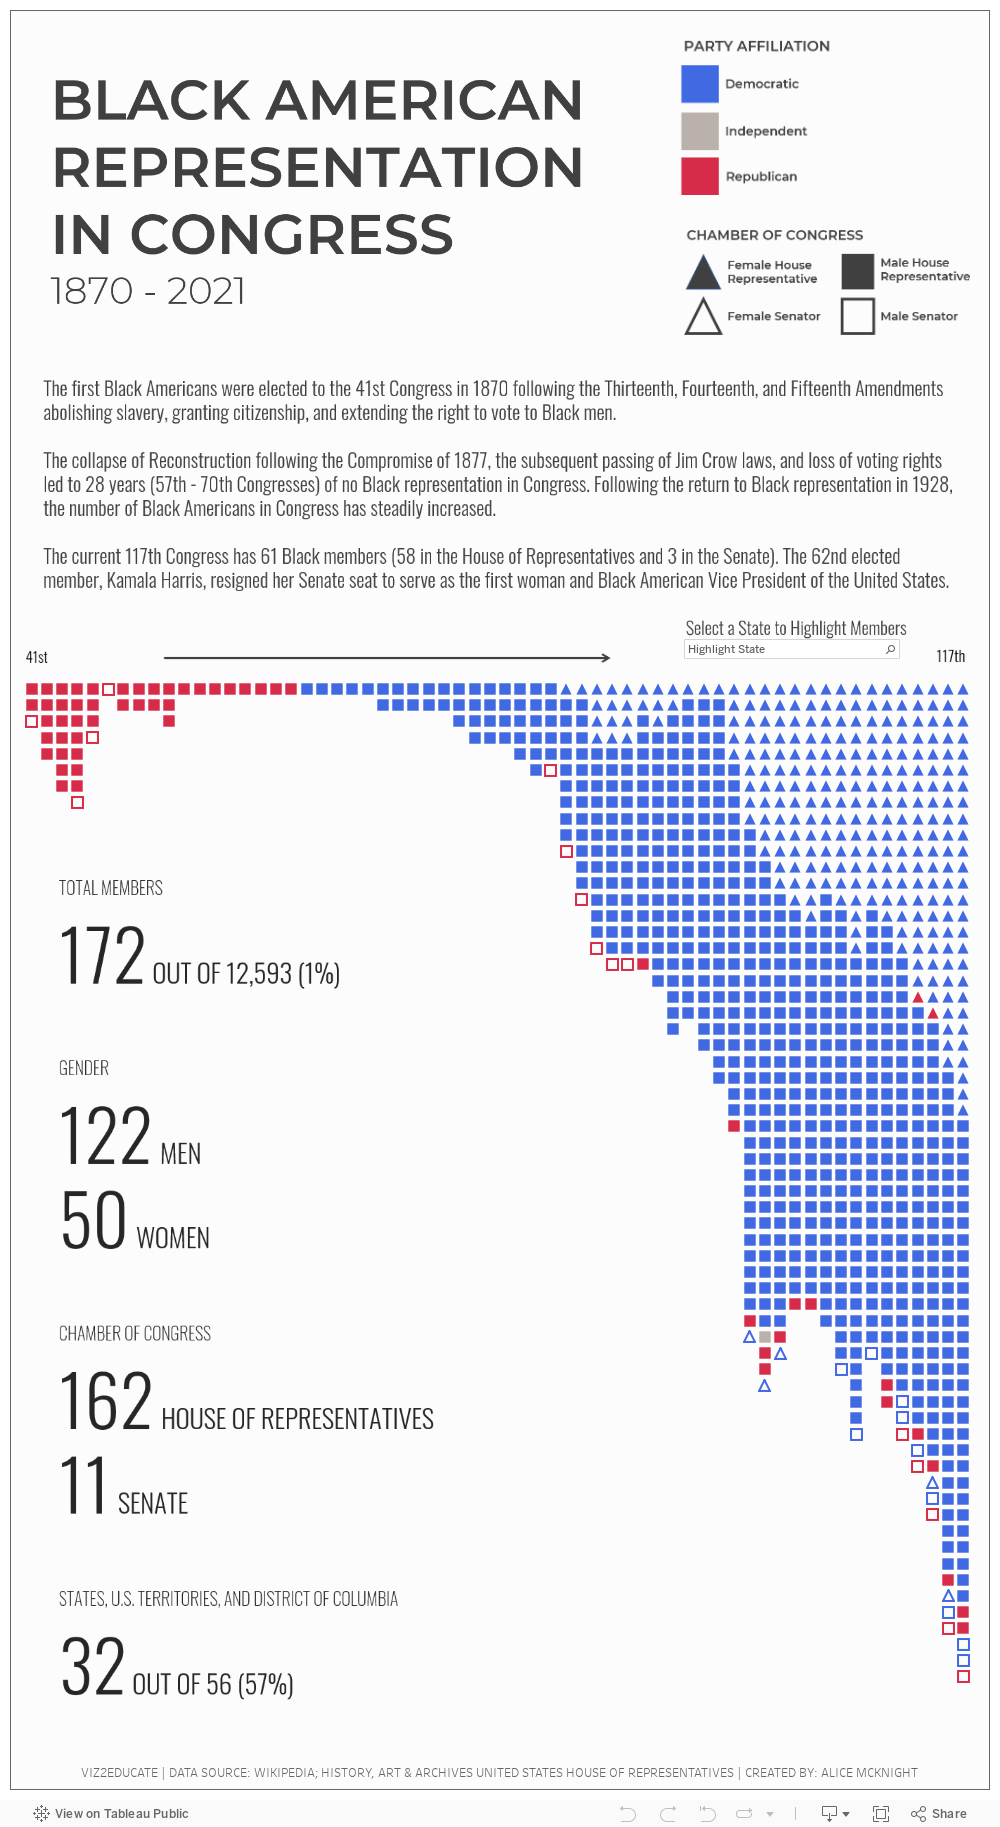
As an example, let’s use For Alice
McKnight’s Viz2Educate project submission, Black American Representation in
Congress. The URL for the viz is
We can produce the thumbnail using
the following API:
or...
And we can get the full-size static
image using:
https://public.tableau.com/static/images/Bl/BlackAmericanRepresentationinCongress/BlackAmericanRepresentation/1.png
Community Examples:
•
Annabelle Rincon built a custom
Tableau Public Landing Page using the thumbnail API.
•
I built a gallery of Iron Viz
submissions from Twitter using the full-size static image
API.
Profile
Information
You can use the profile call to get
basic information about a Tableau Public profile, including profile metadata,
number of vizzes, followers, following, and favorites, plus your latest 20
workbooks and your featured workbook.
https://public.tableau.com/profile/api/wjsutton
Again, just replace “wjsutton” with
your username.
There are also individual APIs for
vizzes, followers, following and favorites. These will give you more detailed
information on each of these features.
•
Vizzes (workbooks), which we looked at earlier: https://public.tableau.com/profile/api/wjsutton/workbooks?count=300&index=0
•
Followers: https://public.tableau.com/profile/api/followers/wjsutton?count=300&index=0
•
Following: https://public.tableau.com/profile/api/following/wjsutton?count=300&index=0
•
Favorites: https://public.tableau.com/profile/api/favorite/wjsutton/workbook
With some Python or R code, you can
chain these requests together and produce a variety of results. For example,
you could create a list of profiles that your followers follow but you don’t or
the top favorited workbooks from your followers.
Viz
of the Day
Tableau Public’s Viz of the Day
(VOTD) has been running for over 9 years and has over 2,000 vizzes that can be
pulled in one go using the following API call:
https://public.tableau.com/api/gallery?page=0&count=10000&galleryType=viz-of-the-day&language=any
Note:
Data on views & favorites from this API appear to be based on when the viz
was selected as VOTD and are not updated subsequently. Thus, to find the latest
views and favorites, you would need to call the workbook API (shared earlier)
for each viz. For more details, see https://github.com/wjsutton/tableau_public_api
I have developed a daily process that
automatically writes the VOTD data to Google Sheets, with updated views and
favorites, which is publicly available for your use here: VOTD
Data
Community Examples:
•
You can subscribe the receive a VOTD email but Curtis Harris built a slack
bot for Viz of the Day
•
Luisa Bez’s VOTD
Color Analysis Dashboard
•
Jeremy Johnson’s 2020
VOTD Analysis Dashboard
Featured
Authors
Tableau Public regularly updates
their list of featured authors, and, not surprisingly, there is an API to get
information about these authors:
https://public.tableau.com/s/authors/list/feed?
This call takes no parameters but
returns a list of Tableau Public profile names and the descriptive content on
the featured authors page. If desired, you can call the author API to get more
information about each featured author.
Community Examples:
•
Nir Smilga’s Tableau
Public Explorer highlights featured authors.
Search
Results
Finally, you can also use an API to retrieve
search results. For example, the following will return the top 100 search
results for Mark Bradbourne’s Real World Fake Data project (RWFD):
https://public.tableau.com/api/search/query?count=100&language=en-us&query=rwfd&start=0&type=vizzes
So, in theory, you could make a
custom search page that is sortable by views or favorites, filters for users
you follow or don’t follow, etc. Or you could use the search results to analyse
all the vizzes on a topic or project of your choice.
Wrap-Up
Tableau Public’s API opens up endless
opportunities to build new projects and learn new skills along the way. We’ve
seen many great examples from the community but more projects could be built
from these APIs. As noted previously, I’ve been collating examples on my Github
page
to guide and inspire new projects. If you’ve discovered anything regarding the
Tableau Public APIs or have used the APIs in your own projects, then I’d
welcome contributions to the Github repository!
Thanks for reading!
Will Sutton, April 26, 2021
Twitter | LinkedIn | GitHub | Tableau Public


great
ReplyDelete