
Four Ways to Perform a Top N in Tableau

As a regular contributor on the Tableau Forums, one of the most common questions I see is how to perform a Top N filter. In addition to the basic how-to questions, I also see many people struggling to get their Top N method to meet their particular needs. So, in this blog, I want to share four different methods for performing a Top N filter in Tableau. Along the way, we’ll address some of the pros and cons of each of the methods so that you can make sure you choose the best one for your particular use case.
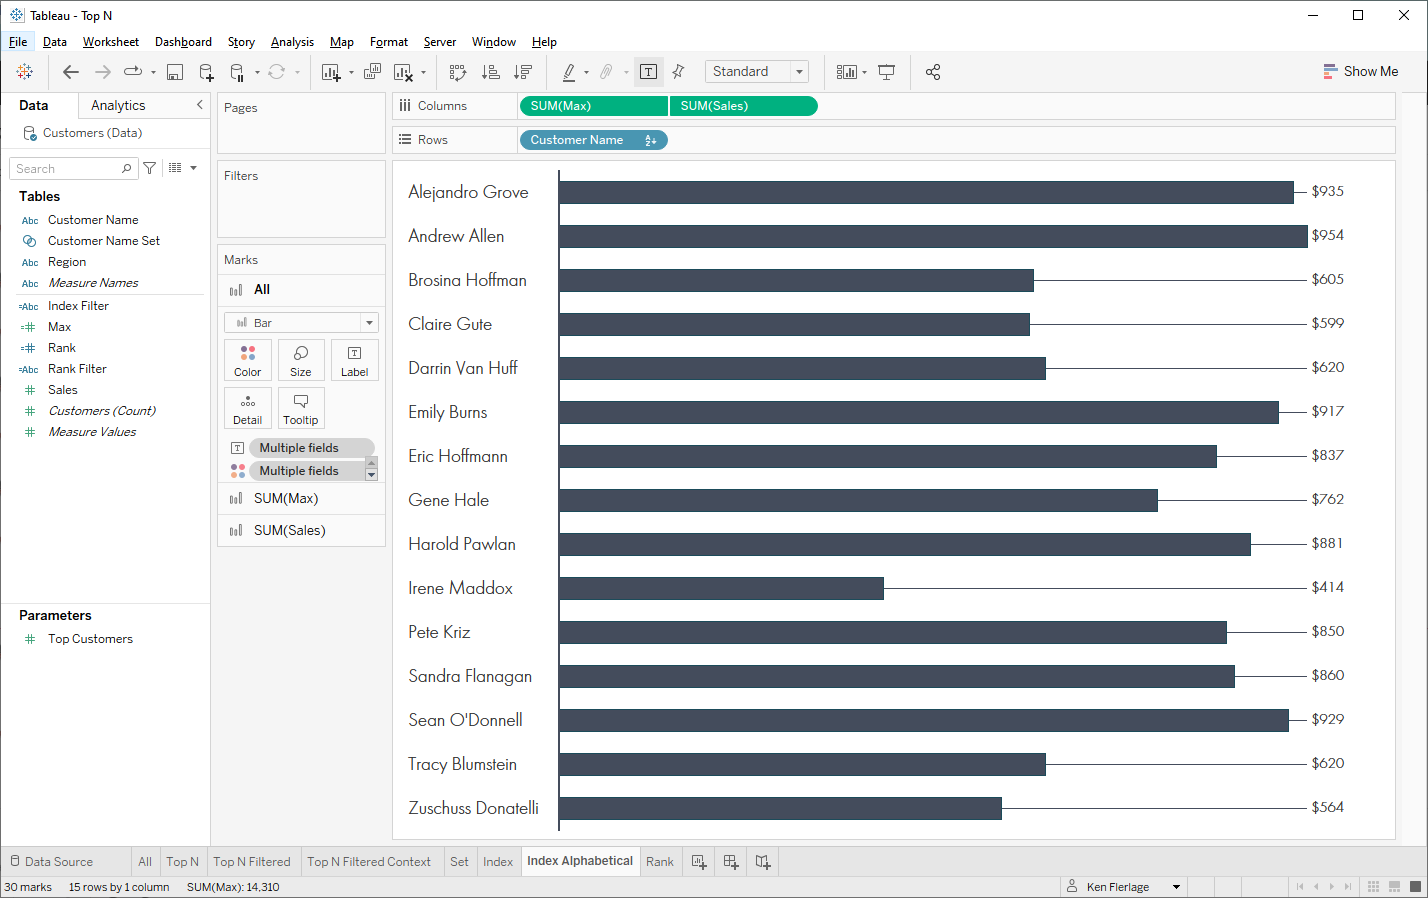
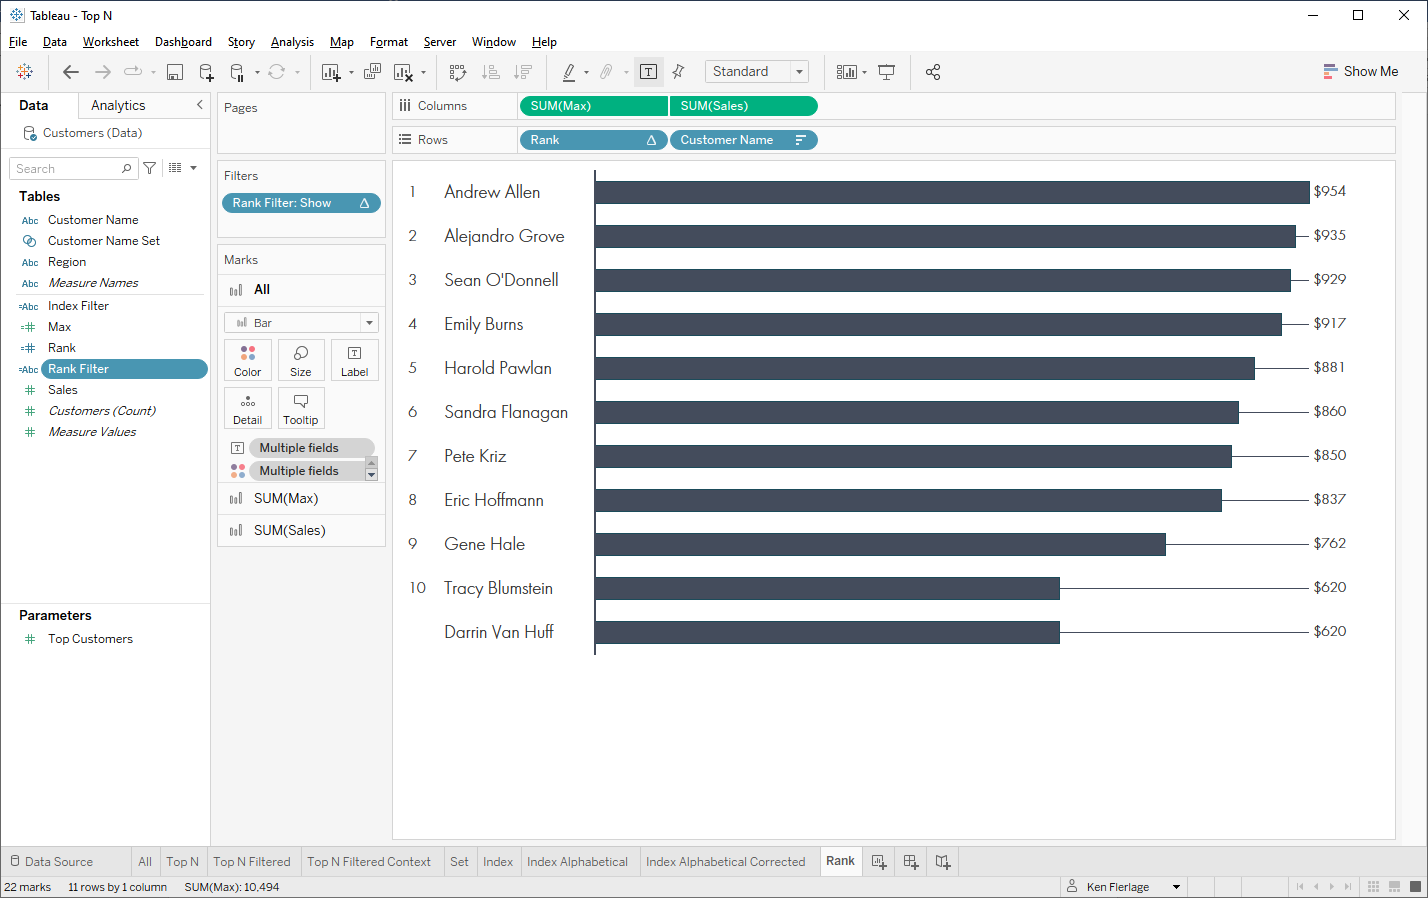
For this blog, I’ll be using a data
source that includes 15 customers and their sales. To orient you with the
data, here’s a simple bar chart showing the customers ranked by sales.
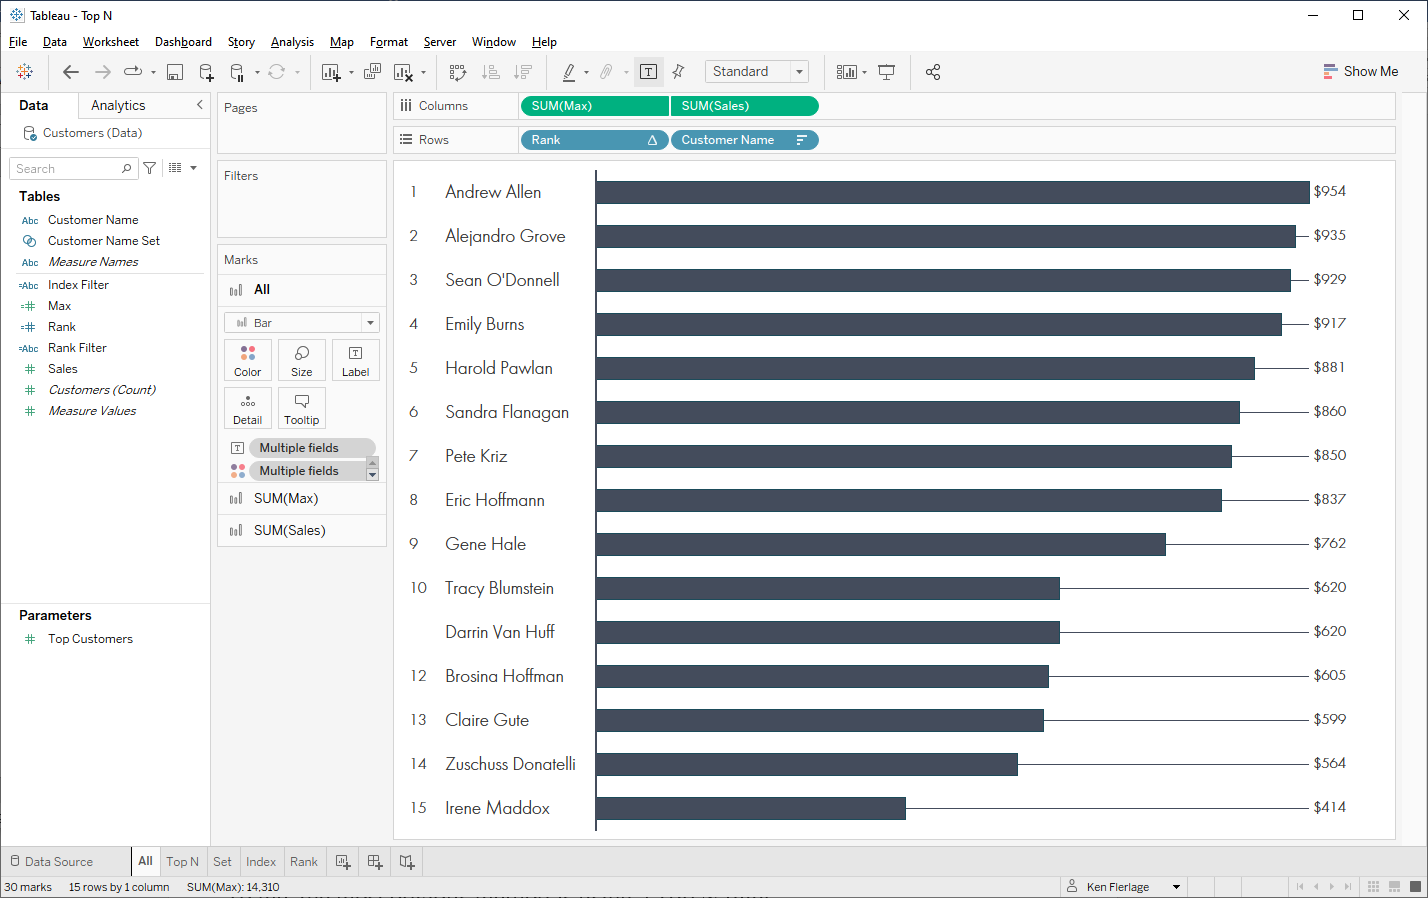
Note that Tracy Blumstein and Darrin Van Huff both have the same sales, causing them to be tied at the 10th rank. This is critical as it will come into play later on.
The workbook is available on Tableau Public here: Top N Filter Methods
Method 1: Top N Filter
To me, the most straightforward method for
performing a Top N filter is to use an actual Top N filter. Using our data set,
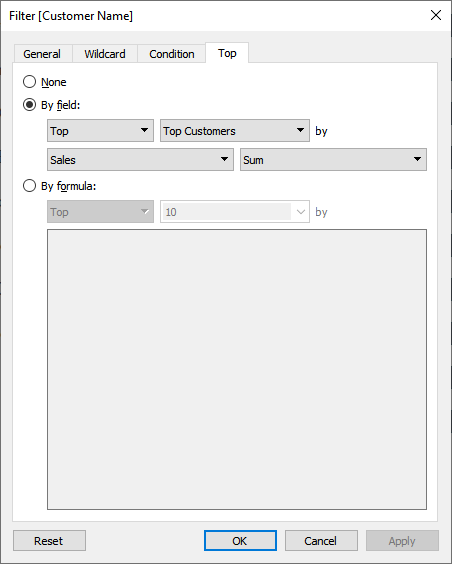
we’ll drag Customer Name to the filter pane, then choose the Top N
option. We’ll set it up to show the top customers by Sales. Note: You can
specify a number here, but I tend to recommend using a parameter (in my case,
the parameter, Top Customers) as that gives more flexibility.
This is a super easy approach, but it
does have some disadvantages. First of all, it doesn’t deal with ties properly.
As I noted previously, Tracy Blumstein and Darrin Van Huff both have the same sales,
but the top N filter only includes Darrin Van Huff. So, if your data allows for
the possibility of ties, then you need to be very careful about using this
option.
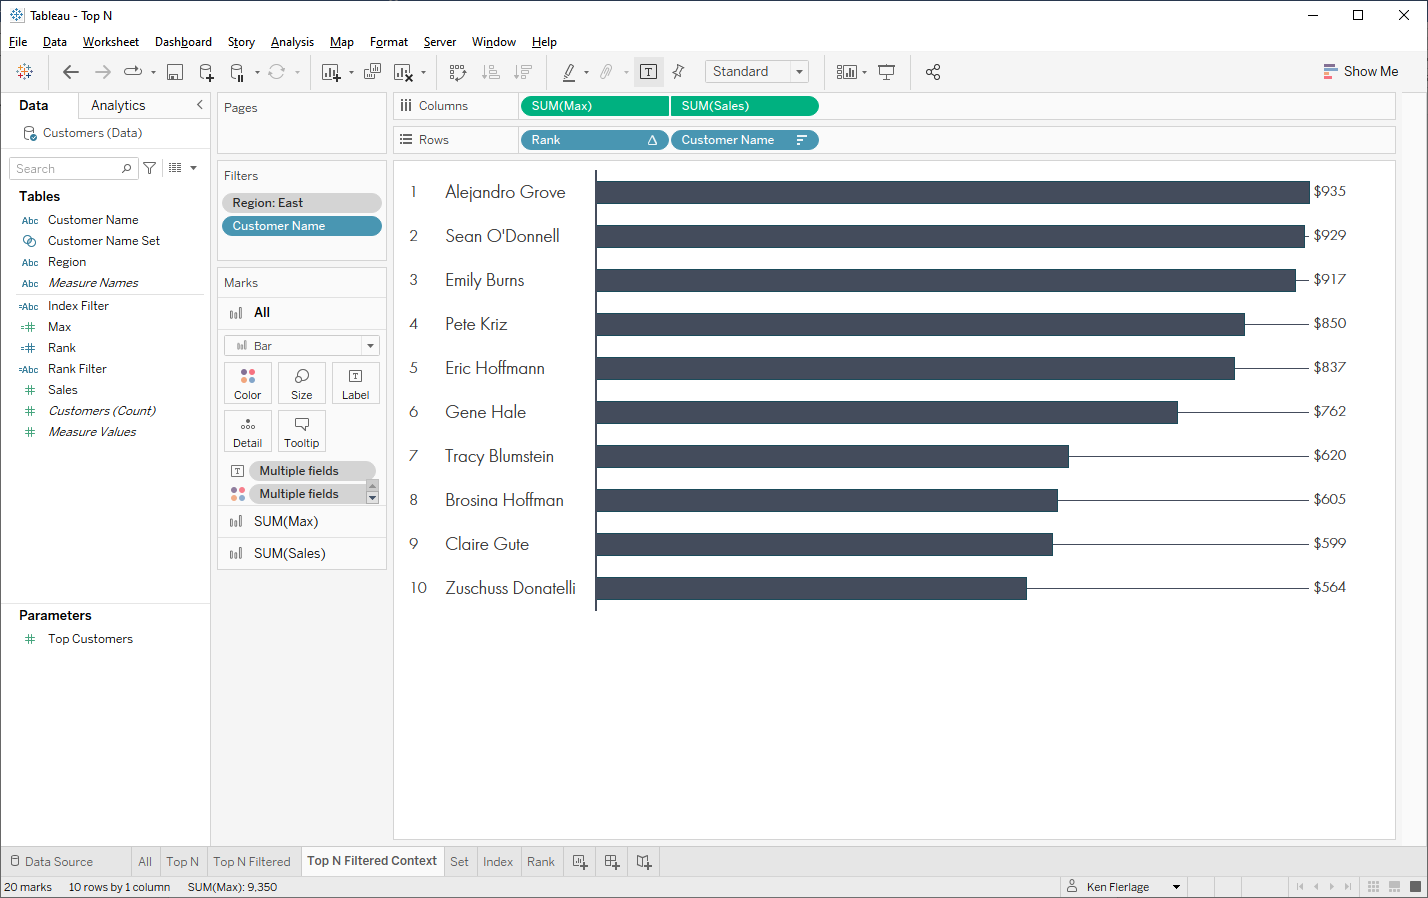
Another potential disadvantage comes
into play when you have filters on your view. For example, let’s say we filter
our view to only the East region.
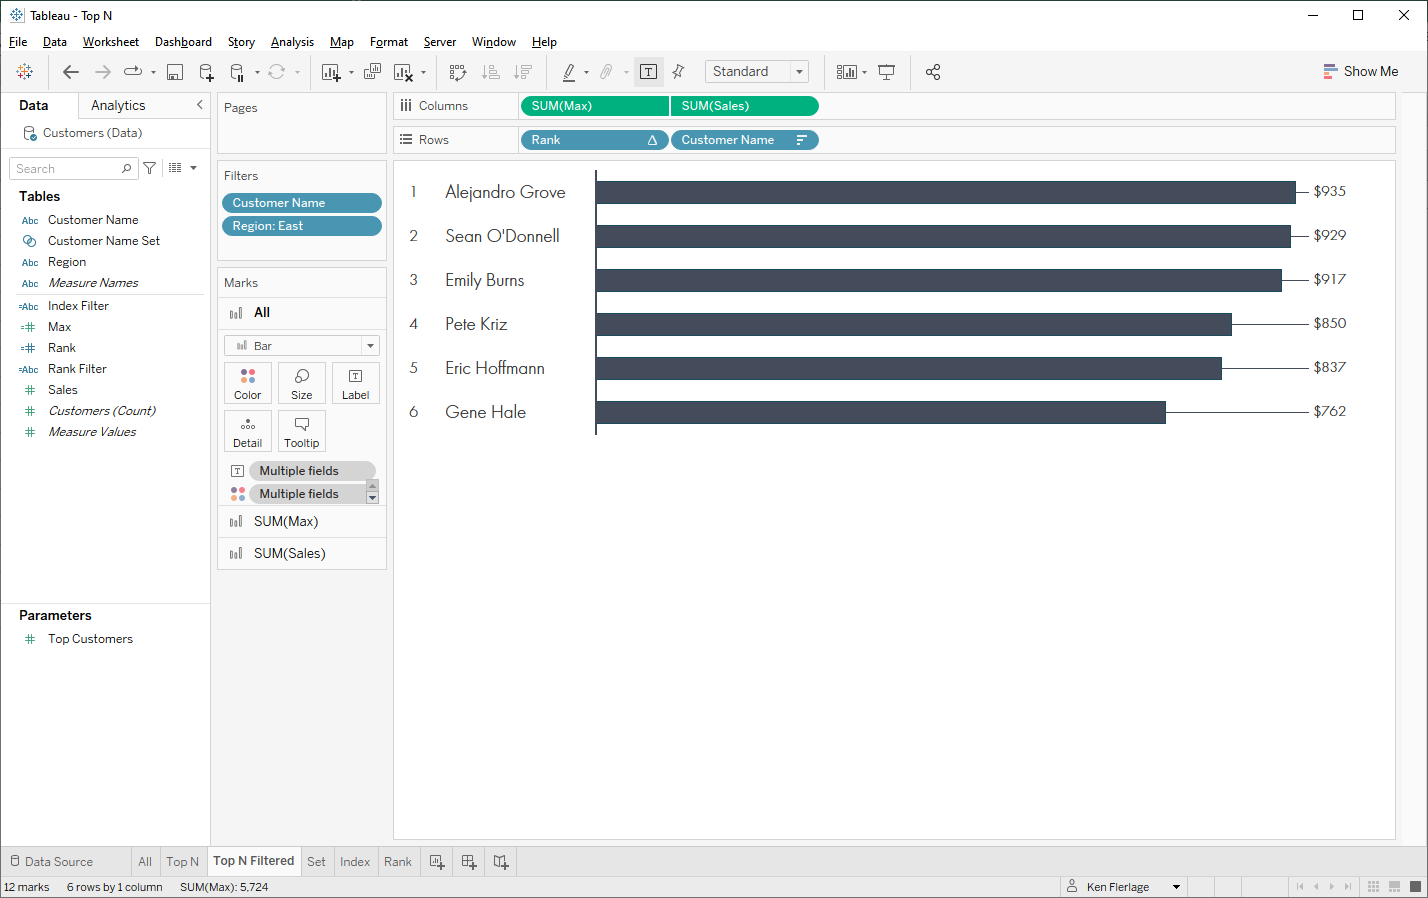
Eleven of the customers in our data set
are in the East region so why does this view only show six? The problem lies in
the Tableau Order of Operations. As I detailed in my blog on the Order of Operations, this is a pretty common problem. Our Region filter
is a dimension filter and, as shown below, Top N filters compute before
dimension filters.
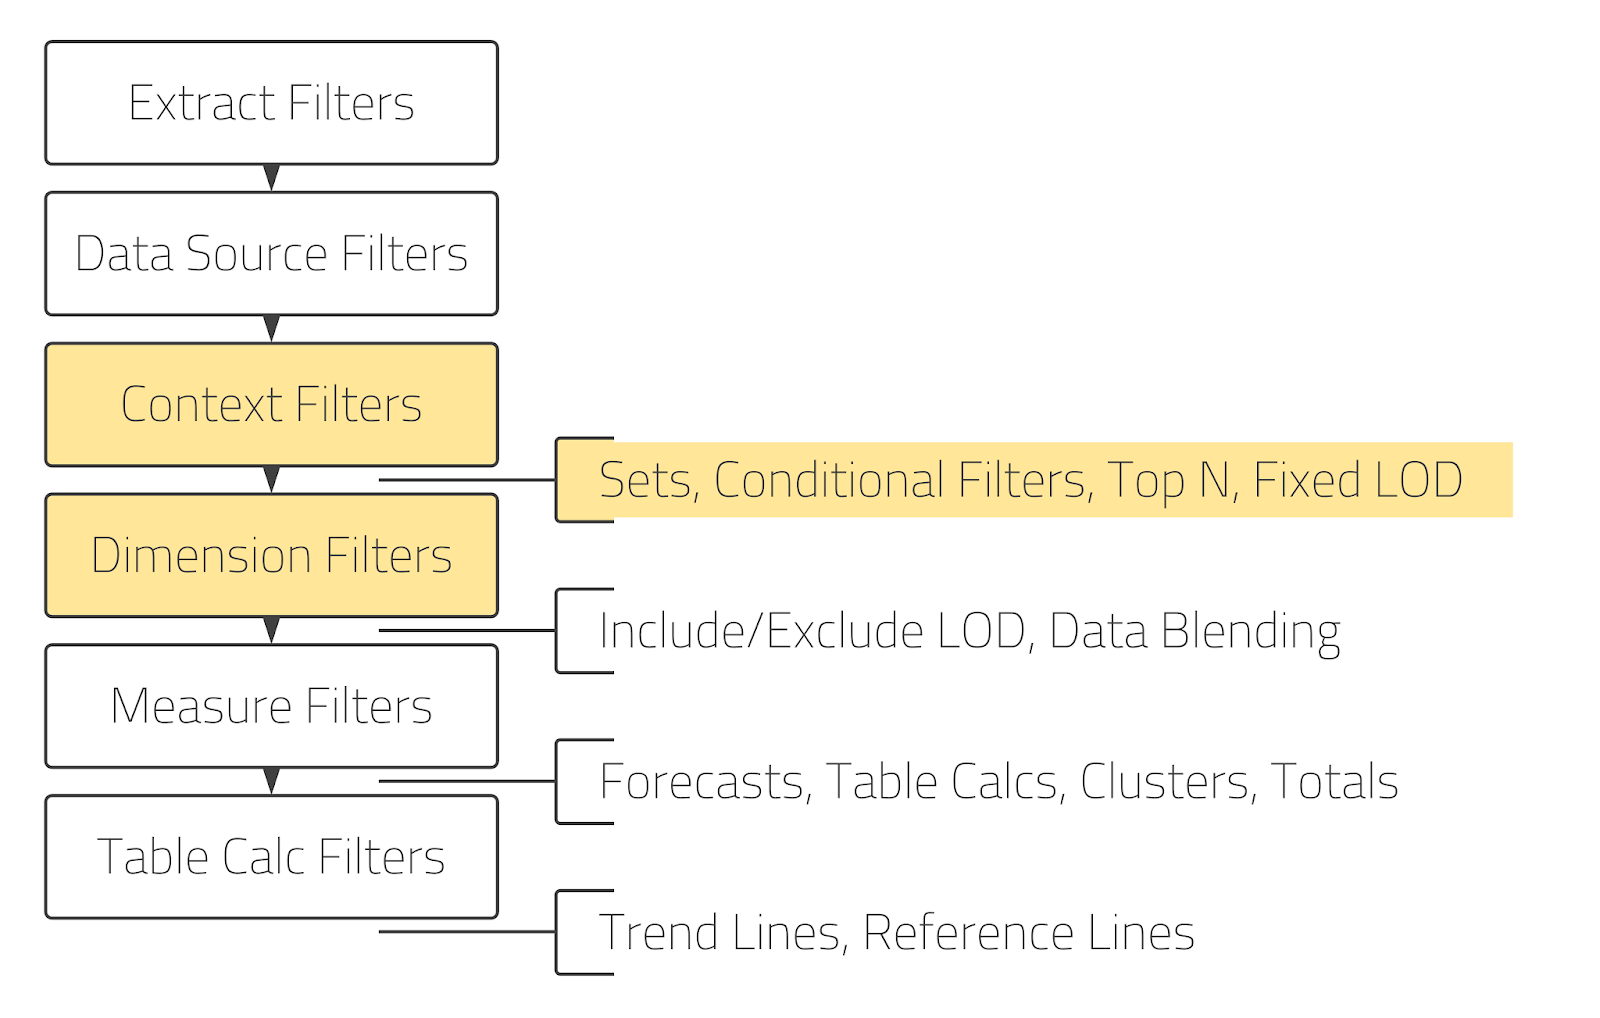
Tableau is first looking at the entire
data set and pulling the top 10. It’s then filtering that list of 10 customers
down to only the East region. In many (if not most) cases, this is not what you
want. Instead, you want to show the top 10 customers within the east region.
To address this, we need to change that dimension filter to a context filter so
that it computes before the Top N filter.
While this example has a simple
solution, things can start to get a bit hairy here. Imagine if your measure
leveraged a fixed LOD calculation. There might be some situations where you
want that LOD calculation to compute before the filter, but want the Top N filter
to compute afterward. Unfortunately, you can’t do this because Top N filters
compute at the same time as Fixed LODs—you can’t have it both ways. If you run
into this situation, then a Top N filter is simply not going to work for you
and you’ll need to consider another method.
Method 2: Top N Set
Method 2 us a Top N Set. To use this
method, create a set on Customer Name then specify a Top N as shown below:
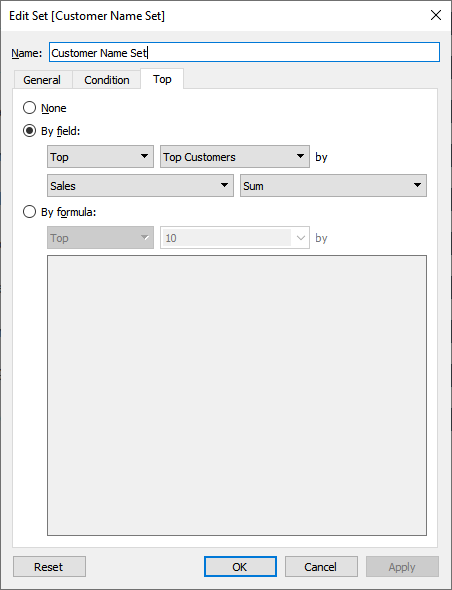
Now drag the set to the filter pane and
set it to only show “In” values.
This works almost exactly like the Top N
filter. As you can see, it fails to handle ties properly. And, because the set
filter computes at the same time as Top N filters, you’ll have the same potential
problems with dimension and context filters. One potential advantage of a set
is that you can reuse it—either in other views or within calculated fields. In
practice, I don’t use this very often, but there could be scenarios where this
reuse makes sense.
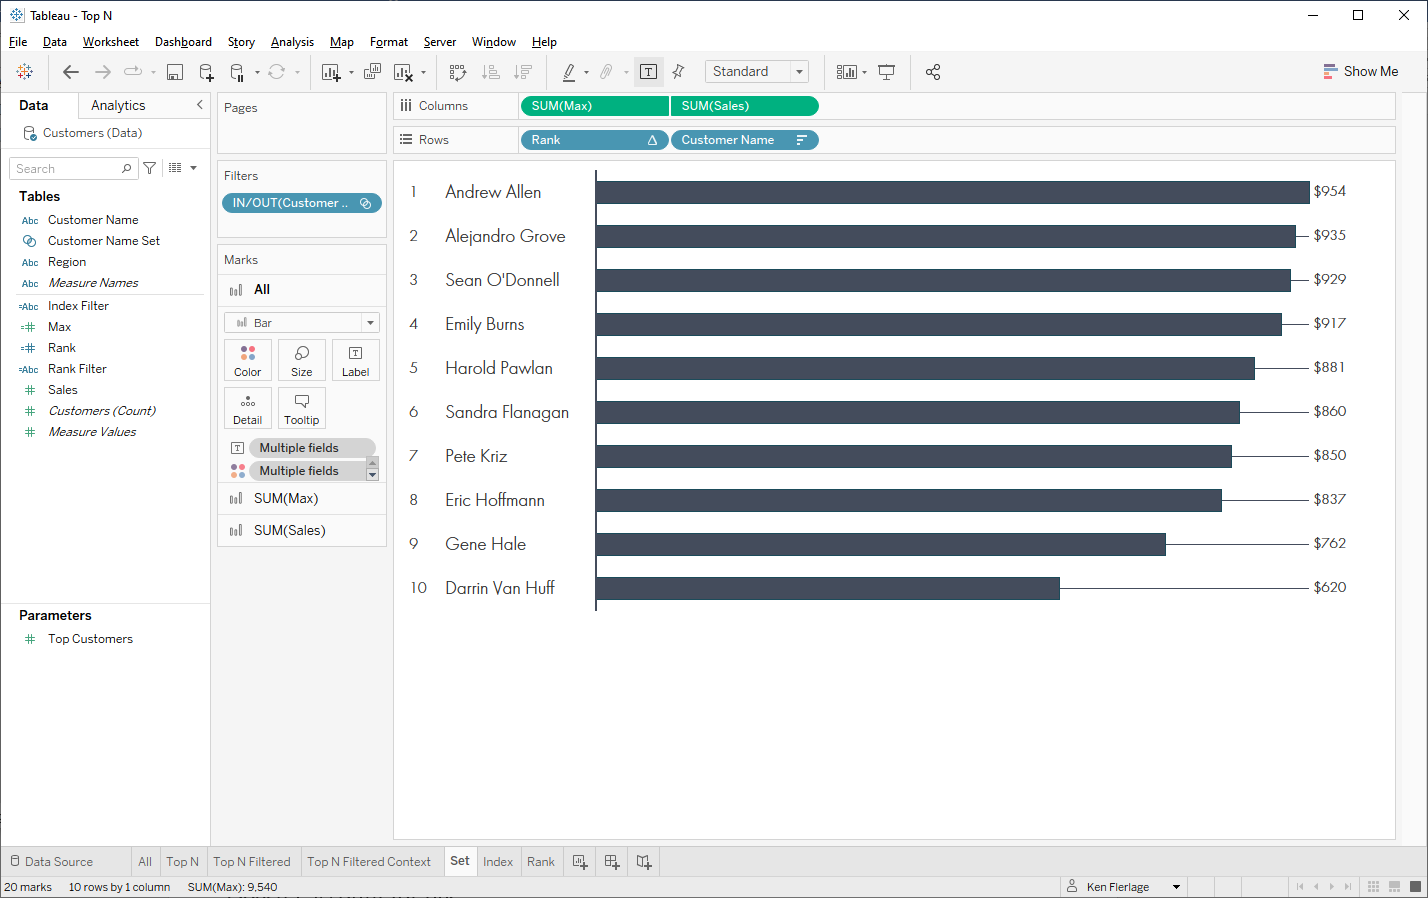
Method 3: Index Calculation
The next method entails using an INDEX
table calculation. INDEX essentially returns an ID for each row in a partition.
We’ll create a calc like this:
Index
Filter
// Filter Top N
using INDEX
IF INDEX() <= [Top
Customers] THEN
"Show"
ELSE
"Hide"
END
We’ll now drag this to the filter pane
and include only “Show” values.
Like our previous three previous
methods, this doesn’t account for ties. But one advantage of this method is that
table calc filters compute near the end of the order of operations so the
issues we saw with previous methods will not be a problem here. Of course, there
could be situations where you might want something like an LOD to compute after
the filter and, in that case, this method won’t really work.
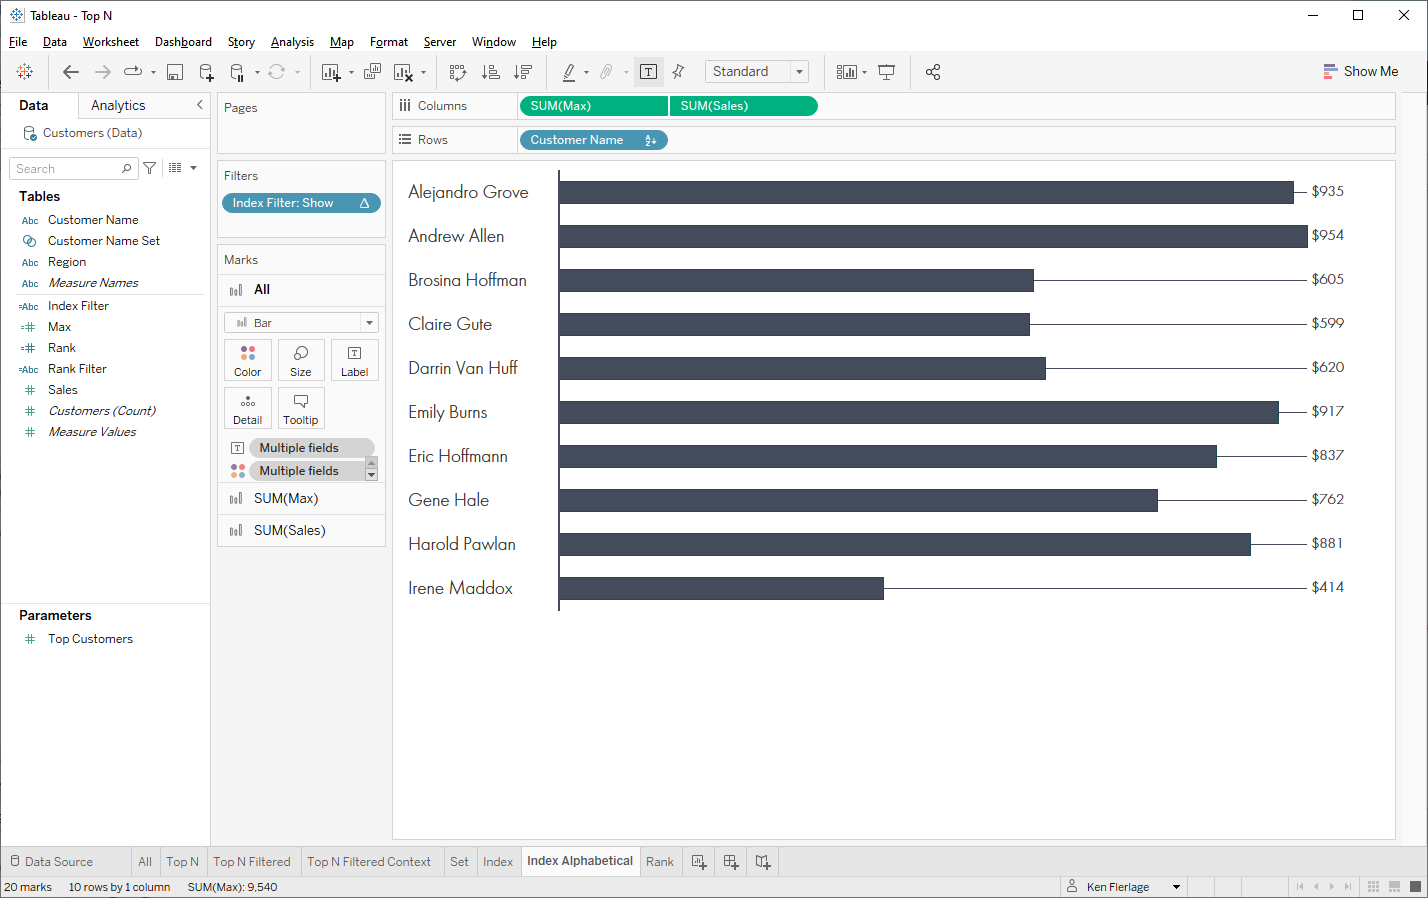
The nature of INDEX is that it counts
sequentially based on some order. In our example, we computed the table
calculation along Customer Name. Because the chart was sorted by sales, the
index provided accurate results. But what if it’s sorted alphabetically?
In this case, INDEX will number the rows
alphabetically and produce an incorrect top 10.
However, because table calculations are
flexible, we can change the way it computes to ensure it gets the correct
values.
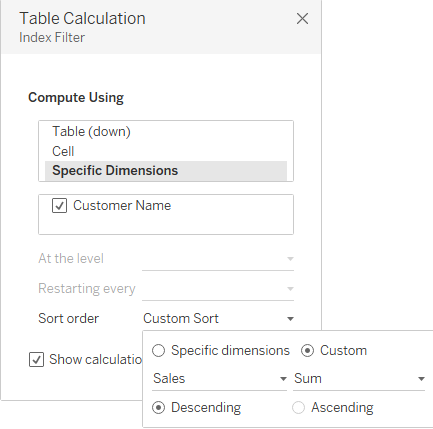
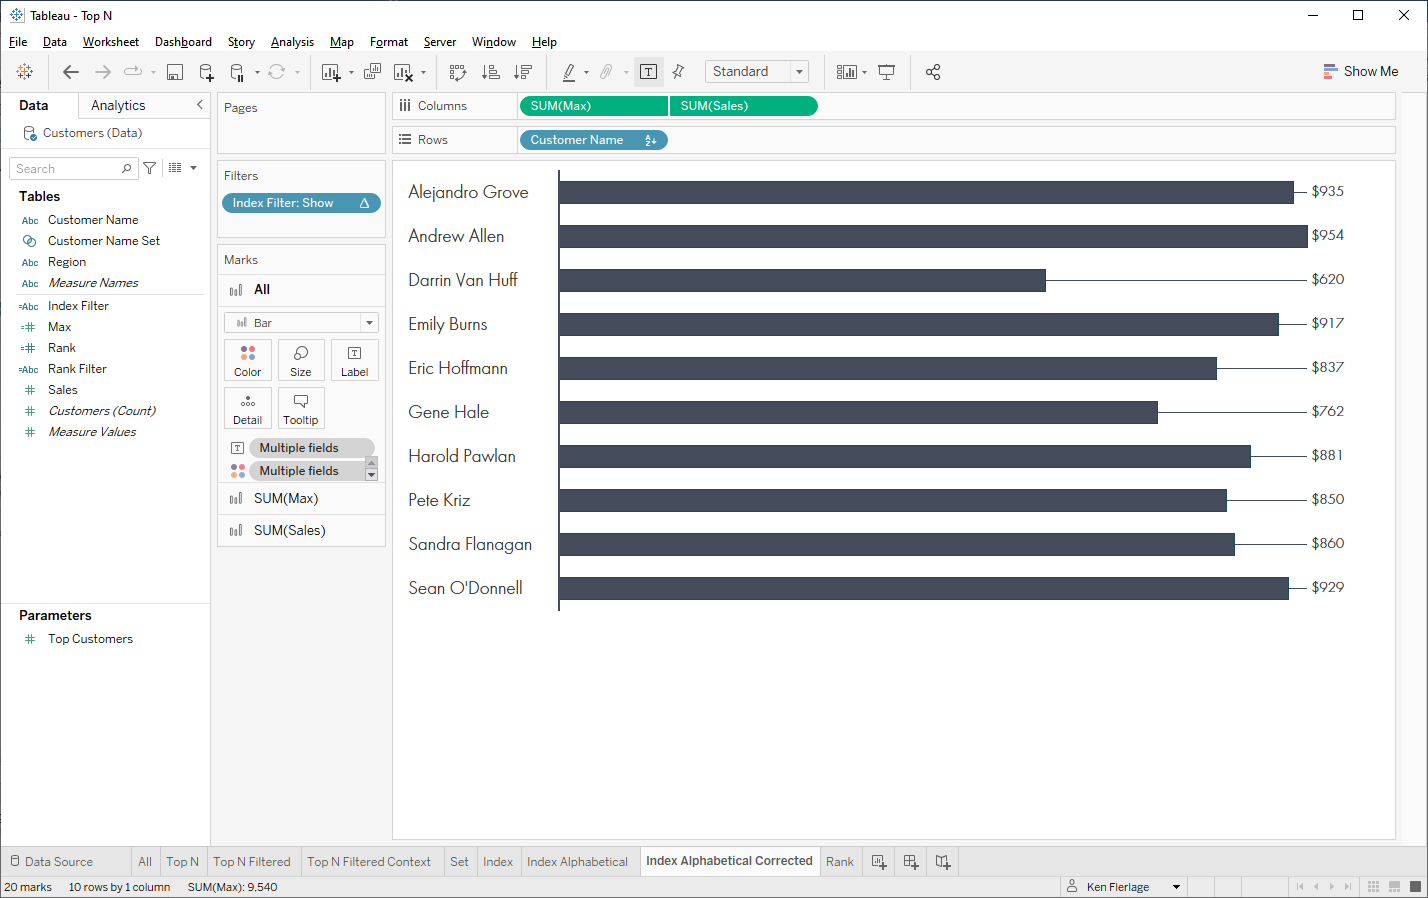
So, while it’s possible to make this work, it just speaks to the inherent complexity of working with table calculations. They are incredibly flexible which is a good thing, but this flexibility comes with complexity. And, if you don’t fully understand what you’re doing, it’s easy to make a mistake.
Method 4: Rank Calculation
Our final method entails using a RANK
table calculation. We’ll create a calculated field like this:
Index
Filter
// Filter Top N
using RANK
IF RANK(SUM([Sales])) <= [Top
Customers] THEN
"Show"
ELSE
"Hide"
END
We’ll drag this to the filter pane and include only “Show” values.
Because the RANK function deals with
ties, you’ll notice that we see both Tracy Blumstein and Darrin Van Huff. This
is a huge advantage of this method! It is, however, important to note that
there are a variety of different RANK functions which work in slightly different
ways. RANK_UNIQUE, for instance, assigns each row a unique rank so it will not show
ties.
Other than how it handles ties, this
method is similar to the INDEX option, having many of the same pros and cons.
It’s a table calculation so ensuring you compute things properly is essential.
However, RANK is a little harder to mess up since it’s ranking the sales
measure, not simply counting rows like INDEX. Nonetheless, you still have to be
careful to ensure that everything is computed properly.
Recommendations
So, which method do you choose? Well,
like almost every question in data visualization, it really depends on your
situation. I typically start with a Top N filter because, to me, they are the
most straightforward and they work for the vast majority of use cases. I only
move on to another method if I find the Top N filter to be limiting in some way,
such as problems with the order of operations or issues with ties. If ties are
a potential concern, then the Rank method is likely the best method as it’s the
only one that will deal with ties properly.
I hope this blog has been helpful in
showing the different methods and the pros and cons of each. Thanks for reading
and let me know what you think in the comments section below!!
Ken Flerlage, July 11, 2022


Thanks Ken, this is extremely helpful and ties in with a problem I currently have. I've got data for accounts receivable balances by client that I run each week and have constructed a bar chart dashboard that gives me Top N clients and other with 'N' driven by a parameter. I then show the ranking of the clients with the last one as 'Other'. So far, so good. However, what I'd like to do is show is a stacked bar chart (again for Top N and other) bucketed by days outstanding (0-30, 31-60 days etc) The ranking works fine for Top N but introduce 'Other' and it gets goosed up. Any thoughts on why this might happen? Apologies btw in advance for hijacking your thread and also for not posting any screen shots, work are very protective of the data and they also own my licence! Best wishes and thanks again. Craig
ReplyDeleteProbably best to address this via email. Could you email me? flerlagekr@gmail.com
DeleteI have a similar issue and I am using the ranking method. I want to have the absolute values and next to it, another chart with percentages using another dimension. I can't make the ranks work when I introduce the second chart
DeleteI will try the set method to see if it changes
One potential disadvantage of the index method, as I heard in a webinar, is that since Table Calcs are calculated at the end of the order of operations, your viz can get slow if you have lots of elements to rank in your table/chart, since they will live in the canvas before the index filter is applied
Deletehello! i tried using Rank Method. However when i did a Top N e.g. 4 and there are 3 elements having the same rank 4 , it ended up becoming Top 7. i do not want to do Rank Unique as i still want to keep ties. I decided to do a Ranking on the element but instead of Rank Filter for Top N i did an Index Filter for Top N, and it worked!
ReplyDeleteBut I am wondering if I am using both Ranking and Index Table Calc , would that be any implication ahead? Moving forward I intend to have an action filter on the Top N Element to show deeper detail when selected one of Top N element.
This question is probably a little too complex to fully answer in this comments section, so the best thing to do would be to email me (flerlagekr@gmail.com).
DeleteHi, thanks for the great post. l am using top N and it looks like it is showing ties without any issue. I wonder if that has been resolved?
ReplyDeleteThanks,
J
Does it work when the last one is a tie? So, for example, you're doing a top 10 and there are two tied for that position. I think it will only show one of them.
DeleteWhat's the point of the [Top Customers]? I downloaded the workbook and can see that it's a parameter and it's definition but what is it's purpose, especially in regard to the solutions proffered in the article?
ReplyDeleteN.B. I'm a SQL Server DBA with over 30 years of experience. Two years ago I was volunteered to take over BI Analytics, including Tableau, PowerBI, and Azure Synapse. It's been challenging.
Top Customers is a parameter. If desired, you could expose it to end users and allow them to change the number of "top customers" shown. Note: I have a very similar background!
DeleteI want to create a list of "Top Ns" for people to view with a single drop-down filter. (Top 10, Top 20, Top 50)
ReplyDeleteCreate a parameter then use that in any of the methods I've shared above.
DeleteI want to display top N on trend line chart using Rank_Dense() so it can deal with ties. Ie. Sales by Region over time. Not able to retain the same rank for the regions across all months since not all regions have data for every month. What can be done? Thanks!
ReplyDeleteCan you email me? flerlagekr@gmail.com
DeleteThanks again for all your content. This one was a great reference late at night that helped avoid context (and a near heart attack ) where 4 dashboards of established filters were nearly wrecked by the need for a "Top 1" BAN on a chart
ReplyDeleteGlad to hear it!!
Delete