
Real-Life Tableau Prep: Management Hierarchies (Guest Post by Kate Brown)

I’m thrilled
to welcome Kate Brown as a guest author today. If you’re involved in any
discussions around Tableau Prep on social media, then you’ll know that she’s
become one of our community’s leaders in this space. She’s also really good with
Tableau Desktop as well! Today, Kate is going to share a blog about how she leveraged
Tableau Prep for a real-life work scenario dealing with management hierarchies.
This post originally appeared on Kate’s blog, Fairways and Viz, where she writes about
“Tableau, Tableau Prep, Golf, and Other Assorted Random Thoughts.” Be sure to
check out her website and her Tableau Public profile
for lots of other great content.
- Ken
I was
honored to present at the first virtual Tableau Prep user group session and was
both thrilled and a bit nervous when I found out 1,200 people had registered
for the session. Thrilled because I was glad to see that there were so many
people interested in Prep and nervous because I hadn't presented to that many
people before. It was a great TUG and I learned something from my co-presenters
Joshua, Jenny, and Rahim and am appreciative of Jack & Caroline's efforts
in making the TUG happen. The link to the recording and the packaged flow are
posted on the Tableau Community Forums.
My
presentation was based on a real-life example where I had to reverse the
management levels in an employee hierarchy. The people hierarchy file has an
employee's immediate leader as their first management level, their immediate
leader's leader as their second and then works up the hierarchy to the company
leader.
I needed
to reverse that so the company leader is the first management level and then
works down the hierarchy so the immediate leader is in the last hierarchy
level. This problem was pretty challenging so, while you may not ever run into
this exact scenario in your own work, I think there are a number of techniques that
you could put into practice in your own work, so I’ll take you through the
process.
Building the Prep Flow
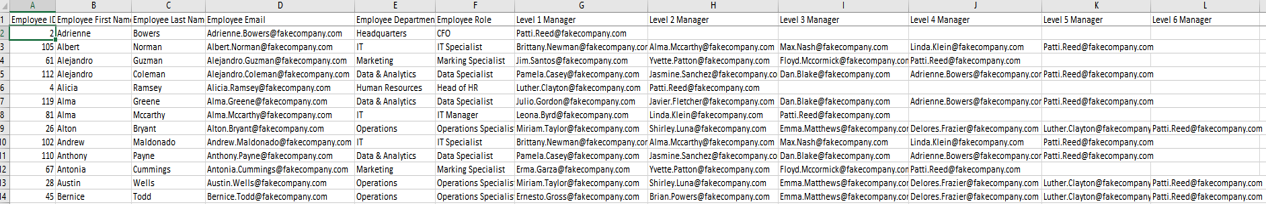
As you can see in the spreadsheet, employees have
different numbers of leaders so the top-level leader could be in any one of the
columns. When I was working through this, I noticed all of the management
levels headers have a number in them and my initial thought was that I could
use that number to reverse the levels. After connecting to the file in Prep, I
added an initial clean step and created one calculated field called Dummy
Field with “A” as the calculation. I’ll use later on so stay tuned.
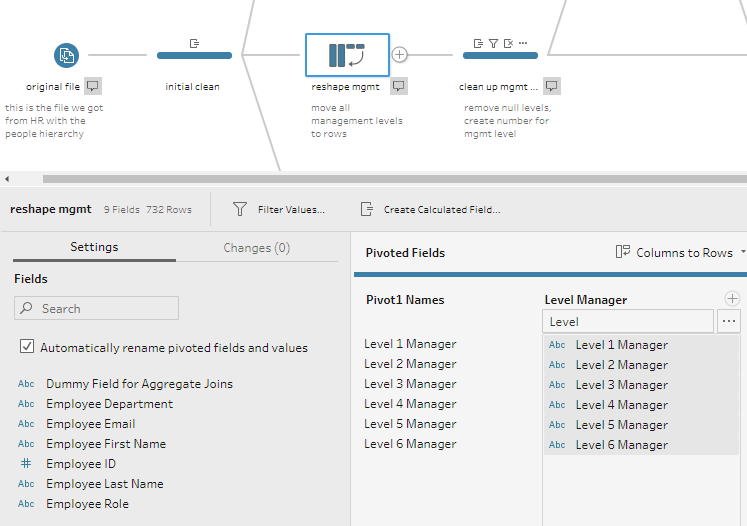
I wanted to extract the number from the management
level headers and use that to create a new reversed level. In order to extract
the number, I need to reshape my data with a pivot step. Pivoting the columns to
rows puts all of my managers into one column and creates a new field called Pivot
1 Names which contained the original column names.
After the pivot, I added a clean step and made 7
changes:
1) Excluded
any records with a null management level.
2) Duplicated
the Pivot 1 Names field.
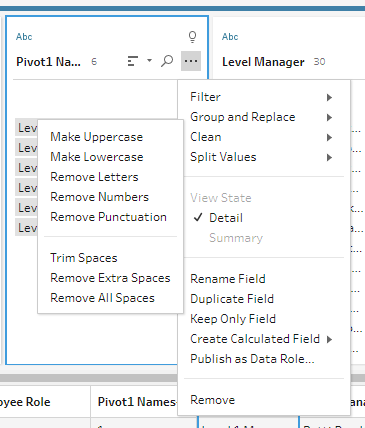
3) Use
the built-in clean function to remove all the letters from this new field.
4) Removed
all of the spaces from the new field.
5) Changed
the field type from a string to a number.
6) Renamed
the new field Management Level.
7) Removed
the Pivot 1 Names field
These steps created a new field with the number from
the management level header—pretty slick, eh?
You may be wondering why I duplicated the Pivot 1
Names field instead of just using the original. I did this because I am in
the habit of keeping the original field as a comparison point when I change the
values. Of course, you do not have to do this, but I would definitely recommend
it as it makes it easier to perform some basic validations.
Note: To access the built-in clean tool mentioned in
step 3, just select the column you want to clean and then click on the ellipsis
(3 dots). That opens a new menu where you'll see the clean option.
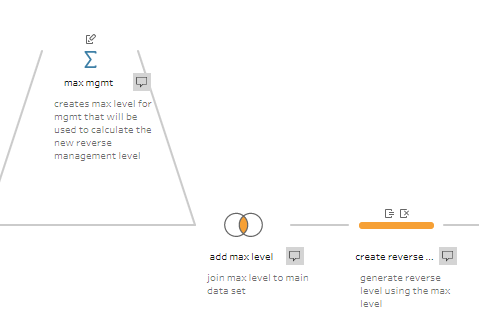
The next step was to get the maximum management level
number for each employee. Once I have this, I will be able to subtract that
from the management level we pulled out of the header to get the reversed management level. To get the max, I added an aggregate step, grouped by the employee, and added the management level number to the aggregated fields using a max aggregation type. I then joined that max level back to my data to add that
field in.
Note: Tableau Prep 2020.1.3 introduced LOD (level of detail) calculations, which could be used to replace these
steps. At the time I created this flow, this functionality did not yet exist.
Now that I have the highest management level for each
employee, I can subtract that from the management level and add 1 to that to
get the reversed level.
([Max Mgmt Level] - [Manager Level]) + 1
I also created a new header field with the reversed
level using the following calculation:
"Level " + STR([Reverse Mgmt Level]) + " Manager"
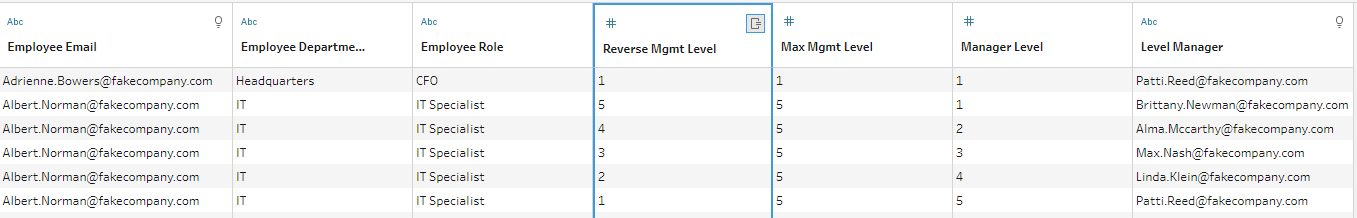
In the following snippet of data, you can see that Albert
Norman has Brittany Newman as his 1st management level and his highest
management level is 5. When that is reversed, Patti Reed—his level 5 manager—becomes
the level 1 manager and Brittany becomes the level 5 manager.
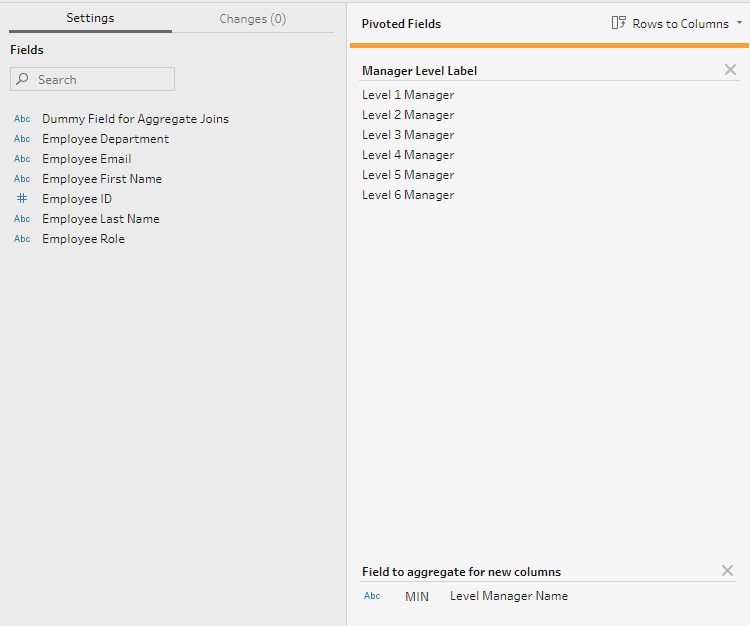
After a bit of cleanup, I added another pivot to move
the new management levels back to columns. This pivot is a “Rows to Columns”
pivot and, because I know there is only 1 value for each level, I am taking the
min of the manager name (you could also use max, avg, etc.)
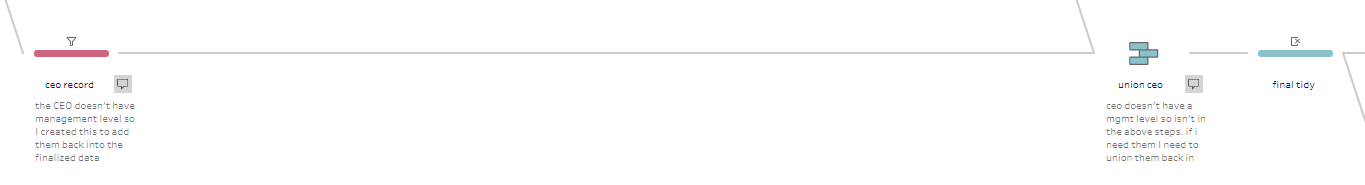
The last thing to do is to add Patti Reed back to the
cleaned data. Patti is the CEO of our fake company and does not have a
management level. So, when we excluded the null management levels after the
first pivot, she was removed from the data set. To add her back, I created a
branch for just Patti and unioned that back to the cleaned data set.
And now we have our nice clean data set with the data organized
exactly as we need. As mentioned before, you may not find yourself in
this exact same scenario in the future, but this technique—pivoting from columns
to rows, performing various cleanup, then pivoting back to columns—can be very
powerful and will likely come in handy.
What About that Dummy “A” Field?
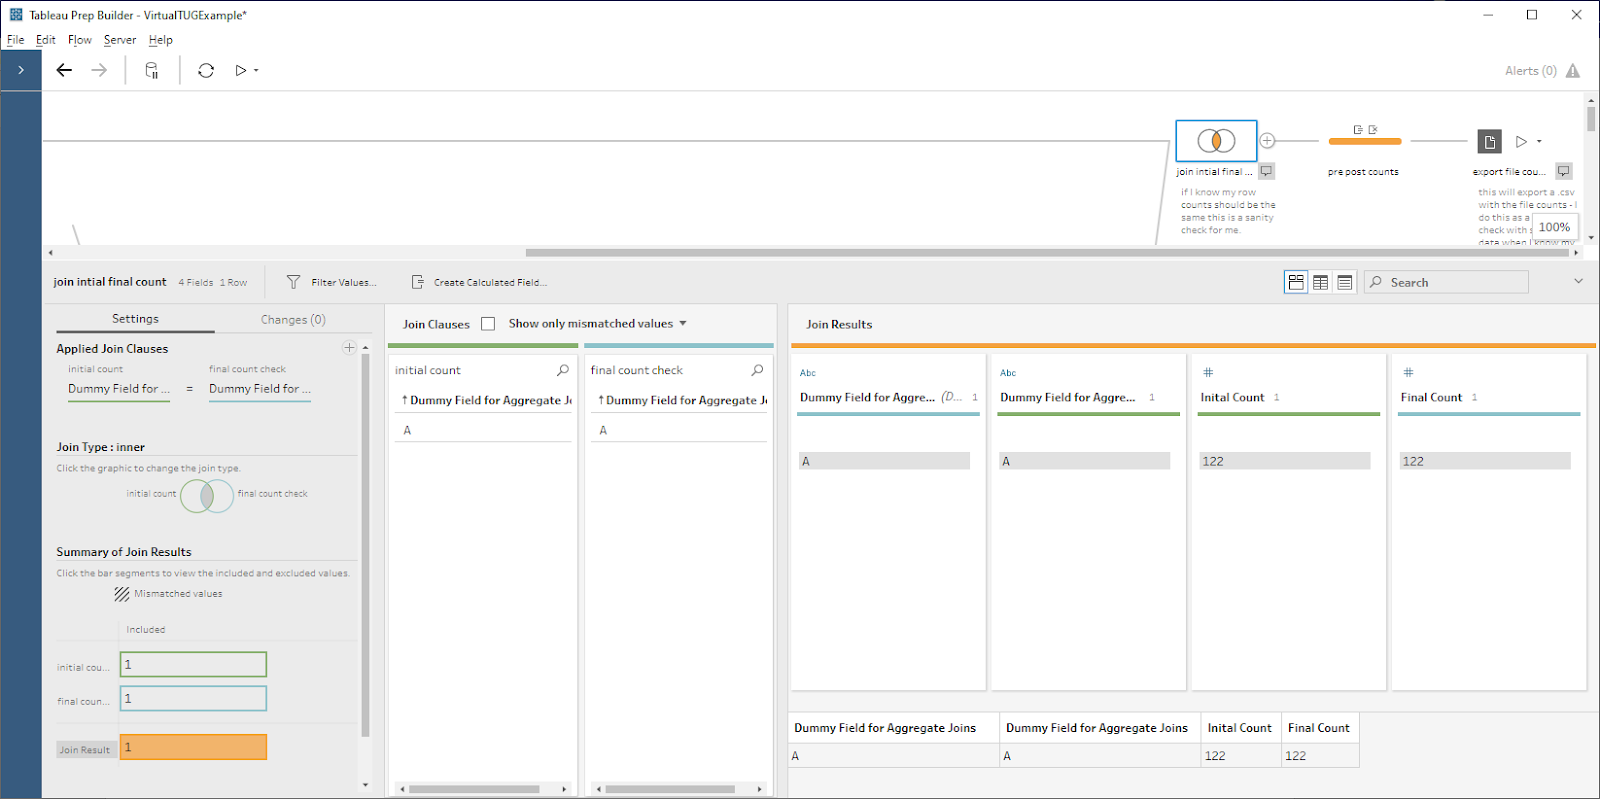
Remember earlier when I created that dummy field with
the value of “A”? Now it’s time to finally use it. As a way of validating my
data during a build, I like to check record counts at different stages using
aggregate steps. Because Tableau samples your data, I have made it a habit
to output these to a file so that I can review the complete record counts. The dummy
field gives me a way to join the aggregates together and validate as shown
below:
Thanks for reading! I hope this example was
helpful. If you have any questions please feel free to get in touch. And, if you’re interested in practicing Tableau Prep, be sure to join
the community project, Preppin Data.
Kate Brown, March 23, 2020


No comments: