
Introducing the Tableau Public Stats Service

If you’ve already read all about the service and just want to access the various links, here is the sign-up form and here is the starter workbook. If you have no idea what I’m talking about, then please read on!
In 2017, I built a viz called My Vizzes which shared my Tableau Public stats—number of vizzes, number of
views, number of favorites, etc. Others have also created wonderful vizzes
showing similar information on their own profiles. Additionally, there have
been some amazing projects which have collected and visualized the stats of a
large number of Tableau Public authors. The first of these, Josh Tapley’s Cerebro Project, contains data for 130K profiles (and growing)! It allows you to
look at your own stats, compare yourself to others, view leaderboards of the
most favorited, most viewed, and most followed authors, as well as explore to
find others you’d like to follow. It is, without a doubt, one of my favorite
Tableau Public projects ever.
When I first built My Vizzes, I had used a rudimentary
(and quite manual) method for collecting my stats. But, shortly after that, I learned
about the Tableau Public API from Rodrigo Calloni and Josh Tapley (he uses this
for the Cerebro Project), so I switched my process to use the API. At first, I
used a method shared by Jeffrey Shaffer that allows you to call an API directly from Google Sheets. This worked great, but eventually, I found that I
wanted a little more control over the structure of the data so I ended up
writing my own Python script which writes my stats to a Google Sheet. And that’s the method I
still use today.
At this point, you may be asking why Google Sheets. The
reason is that Google Sheets are the only data source that Tableau Public can
automatically refresh for you. So, you can publish your workbook, ask Tableau
Public to perform the auto-refresh, and never worry about it again. I set up My
Vizzes to work this way and, despite not touching it in years, it’s still updating
with new data every day.
There are plenty of tutorials on how to leverage the Tableau
Public API to pull your (or others’) stats and some of us have even shared our
code publicly to make it easier for others to get their data (you can find my code on Github). That said, it’s still difficult. It requires that you be
familiar with Python and have the infrastructure set up to be able to run the
script on a regular basis. This, unfortunately, can be a bit daunting. And,
because of that, I don’t see that many vizzes exploring their Tableau Public
stats.
Today I’m hoping to change that…
The Tableau Public Stats Service
To make collecting your stats easier, I’ve created what I’m
calling the Tableau Public Stats Service, which will allow users to
get their data without writing a single line of code. The service, which runs
on AWS, is just an enhanced version of the Python code I use for my own stats.
Here’s how it works:
1) You’ll complete a simple form sharing your name,
email address, and a link to your Tableau Public profile.
2) Your information will be automatically added to a secure database
of profiles the service is managing.
3) Within the next few hours, the service will process your
request, create a personalized Google Sheet—which can only be accessed by you
and me—and populate it with your Tableau Public stats. The spreadsheet will
include a mix of viz-specific and user-specific data items (for a detailed list
of fields, see the data dictionary).
4) After the initial creation of your spreadsheet, you’ll be
sent an automated email with a link to your Google Sheet and instructions on
how to use it.
5) From that point forward, your Google Sheet will be
automatically updated with fresh stats once a day.
And that’s it!! You’ll have up-to-date stats about your Tableau
Public profile, at your fingertips, without the need to write a single line of
code—the service will do everything for you.
Note: The intent of this service is to make it easier for
you to analyze your own stats. Thus, at this time, I ask that you only submit
requests for your own profile, not others. Thanks for your cooperation!!
Visualizing with Tableau
Of course, the data only gets you part of the way. You’ll
now want to create a Tableau Public visualization to share those stats. The
data is relatively simple so you can create your own from scratch if you like.
However, to give you a jumpstart, I’ve created a starter workbook.

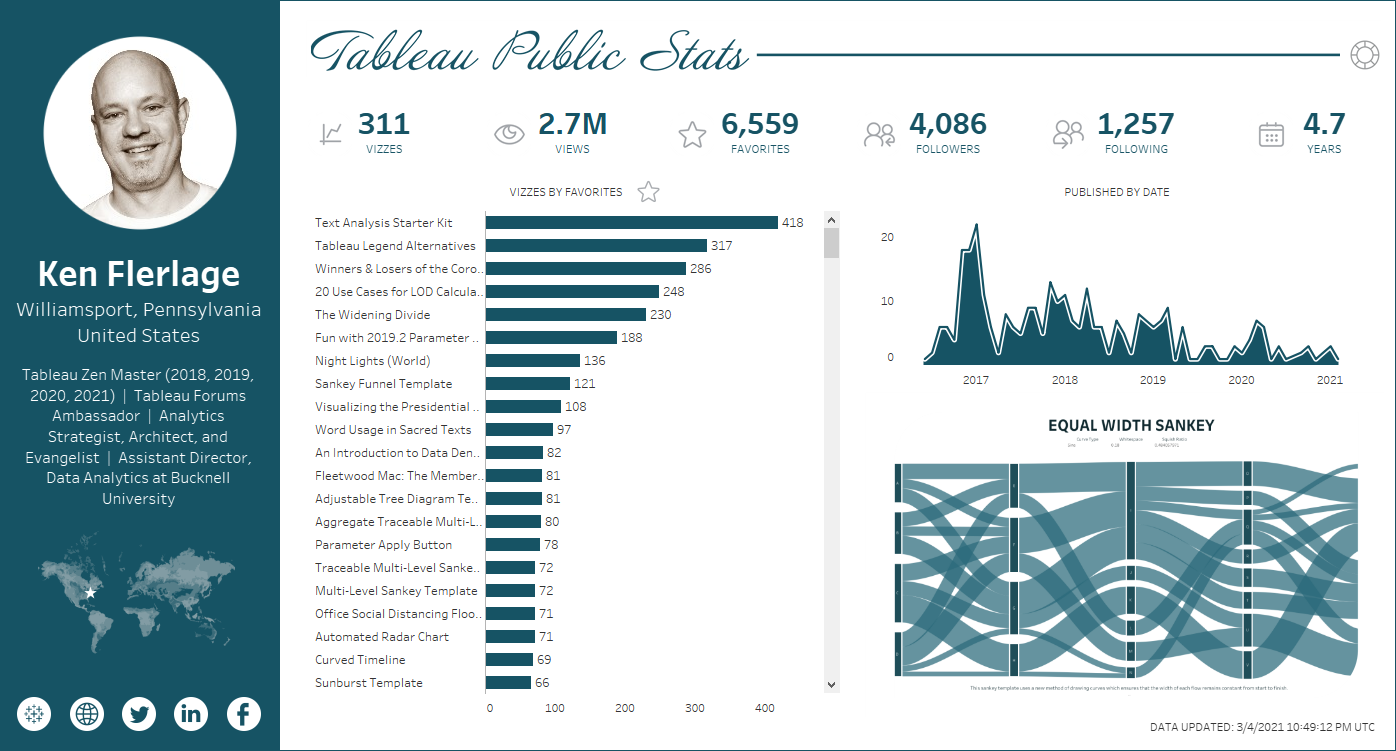
The workbook will show various information about the author
(you) including your profile photo, biographical information, geographic location,
and social media links. And it will show your stats, starting with BANs showing
the number of visible workbooks, number of views and favorites, the number of
people following and followed by you, and the number of years you’ve been on public.
A bar chart will show each of you vizzes—you can toggle it to show the number
of views or the number of favorites. On the right, you’ll see an area chart
which shows the number of visualizations you’ve published each month of your
time as a Tableau Public user. And, finally, you’ll see a workbook thumbnail.
This will default to your “featured viz,” but you can select other vizzes on
the bar chart and the thumbnail will update. You can also click on that
thumbnail to view the viz on Tableau Public.
But perhaps my favorite feature is the ability to change the
colors (this was actually Kevin’s idea so I have to give him credit). If you
click the wheel icon in the upper right-hand corner, you’ll be able to choose
from a selection of 25 different color themes.
What’s great about this is that you can find a color palette
that perfectly ties in with your featured viz. For example, I can match my Equal Width Sankey by changing the theme to dark teal.
One final feature of the template is the Data Dictionary
sheet, which provides a list of all the fields in your Google Sheet, along with
a description of each. I’ve been working with the Public API for years now, but
for the uninitiated, this will serve as a good reference so that you can be
sure you’re using the right fields. Note: You can also access the data dictionary in spreadsheet form here: Stats Data Dictionary
Using the Starter Template
To use the template, you need to connect it to your own
Google Sheet. Here are the exact steps you’ll need to take to do that:
1) Download – Download the Starter Template, open it, then click the Data Source tab.
2) Connect to Google – Most likely, you’ll now be
prompted to connect to your Google Account. Enter your Google account email and
password and click Allow. Note: It’s possible that the email field will
show my email address. If so, just clear that out and enter your own.
The workbook contains five different data sources. Three of
those—Colors, Data Dictionary, and Measure Toggle—are utility
data sources used to control different functionality in the workbook. These are
linked to publicly-accessible Google Sheets so you don’t need to edit them. The
other two—Tableau Public Stats and Profile Websites—need to
be edited to connect to your Google Sheet.
3) Edit Data Sources – Select the Tableau Public
Stats data source and edit the connection. When prompted, select your
Google Sheet. Repeat this process for the Profile Websites data source.
4) Verify – Flip back to the dashboard and verify
that both the stats and social media links look accurate. If any are still linked
to my data, repeat the previous step until everything is accurate.
4) Publish – Finally, publish to Tableau Public. When
prompted, be sure to select the option, Keep my data in sync with Google
Sheets and embed my Google credentials. By selecting this, you’ll be instructing
Tableau Public to automatically refresh your data each day. Note: When saving,
you’ll likely be prompted to connect to Google again. This will happen up to 5
times—once for each data source. Just be sure to connect to your Google
account each time.
Of course, now that you’ve connected the workbook to your
own data, it’s yours to do what you please. Feel free to make whatever
modifications you like, customizing it to meet your own needs.
There are a few minor tweaks I foresee many people wanting
to make—changing the default thumbnail, changing the views measure (thousands
vs raw numbers), and changing the colors—so let me explain how to make those
changes.
Default Thumbnail
The workbook will automatically default to your featured
viz. In the bar chart, that viz will be colored using the theme’s accent color
and that viz’s thumbnail will be displayed on the bottom right. Clicking on
other bars will change these, but the workbook is set up using a dynamic parameter
which will automatically change them back to your featured viz whenever the
workbook is opened. So, even if you publish the workbook with another viz
selected, it will revert each time someone opens it. To undo this, you’ll need
to edit the Selected Viz parameter and change value when workbook
opens to Current value.
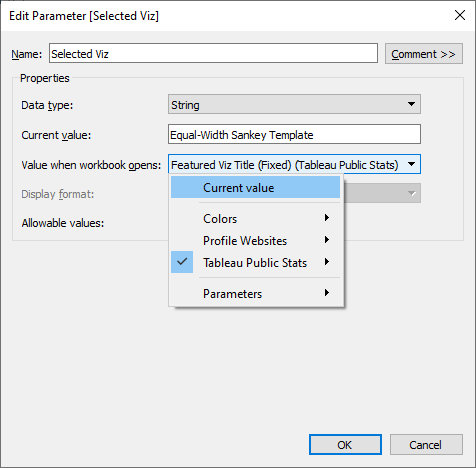
You’ll then need to do the same thing with the Thumbnail
URL parameter. This will turn off the dynamic parameters used to load the
featured viz. You can now select whichever viz you want and publish it, without
it reverting back to your featured viz.
Views Measure
The toggle button above the bar chart allows you to change
it to display either Favorites or Views. When toggled to show views, the label
shows the count in thousands, by default. If you prefer to show the raw number,
simply change the Show in Thousands parameter to False.
Colors
The final change you might like to make is to choose your
own color theme. As noted earlier, I’ve provided a selection of 25 different
themes and I’m hopeful you’ll be able to find one that works for you. But, if
not, you can modify the colors manually. You’ll need to specify your new colors
in three different places:
1) Open the Links sheet and change the color. This
will update the color on a variety of dashboard components.
2) Open the Views sheet (the bar chart) and change
the color. You’ll need to specify the primary color and the accent color.
3) Open the Published by Date sheet (the area chart),
select the second axis, and change the color of the first item (the second should
remain white).
Wrap-Up
Okay, so that’s it. I’m really hoping that you find this
service valuable and easy to use. And I’m really excited about seeing many of
your Tableau Public Stats vizzes—whether you use my template or create your own
from scratch. If you have any questions whatsoever, feel free to reach out to
me by either commenting below or using form on the website. Thanks so much for
reading!!
Ken Flerlage, March 15, 2021


This floored me! Great read and service Ken. Quick question - is there a resource that explains how to keep your Tableau dashboard automatically refreshed when connected to a Google Sheet? thanks again.
ReplyDeleteThanks Joshua! Glad you like it. The following seems to be a pretty good guide: https://michelburnett27.medium.com/using-google-sheets-with-tableau-public-509b853b116
DeleteThe key points I've found are: 1) Your data source cannot contain anything else other than Google Sheets--if you join to an Excel or text file, for instance, it won't auto-refresh and 2) Be sure to check the box labeled "keep my data in sync with Google" when you publish.
Happy to help if you run into any issues. My email if flerlagekr@gmail.com
SUPER! Thanks Ken. You're a gentleman and a scholar.
DeleteHi Ken
ReplyDeleteWondering if you could help me sort out an issue with my desktop trial version. I am just unable to add an image to my dashboard. It pops up as blank!
Sure. Can you email me? flerlagekr@gmail.com. Another great option, which might result in a more timely answer, would be to post on the Tableau Community Forums.
DeleteHi Ken,
ReplyDeleteI have two vizs, one named 'The Life of Mahatma Gandhi' and another named 'The life of Mahatma Gandhi' but in the data it is display only 'The life of Mahatma Gandhi' and adding the details of the vizs. Can you help me in fixing the error?
Sure. What's your name (so I can find the correct Google Sheet)?
DeleteShreyash Singh
DeleteThe spreadsheet does have two separate rows, but the Tableau workbook has "Viz - Title" on the rows shelf. Since both of these have the same name, it's grouping those stats together into one bar. To address this, try adding "Viz - ID" to the rows shelf then hiding the header. That will hide the field, but will break those into two separate rows.
DeleteOkay Ken. Thanks for the help.
DeleteThanks for the blog and the starter template. Shall we adjust the colors manually after replacing the data?
ReplyDeleteOnce you've make a copy and connected to your data, you can use the color picker to choose a built-in theme or you can modify the colors as desired.
DeleteThanks Ken.
ReplyDeleteThanks for the blog. How can we refresh the data?
ReplyDeleteThe spreadsheet will update automatically once a day. If you use the Google Sheet connector, you can set up the Tableau Public viz to update once a day as well.
DeleteDo you mean Google Sheet, i.e., Google Sheet connector? How can we set up the Tableau Public viz to update once a day? Thanks for the help.
DeleteSee https://public.tableau.com/en-us/s/blog/2017/10/living-dashboards-how-automate-your-data-google-sheets
DeleteThanks Ken.
DeleteHey Ken,
ReplyDeleteJust want to know how do I add Color palette to some other dashboard of my own, I've made the color palette, but how do I make the theme change of the dashboard.
Please help
You mean like I've done on this workbook? If so, it takes some time and effort. I'd suggest downloading this workbook and looking at what I've done.
DeleteYes, Actually I've downloaded this workbook and done the same with my dashboard by making color palette and actions and etc, but still it won't work by selecting the color, it won't change the theme of the dashboard.
DeletePerhaps you could email me? flerlagekr@gmail.com
DeleteShould I send you my dashboard? Right?
DeleteI've mailed you the workbook, Please have a look at it. Thankyou!
Delete