
4 Tips for Writing Complicated Tableau Calculations

Writing calculated fields can be really difficult, especially when the logic is complex or there are multiple layers. In my time using Tableau, I’ve come up with a handful of techniques that I’ve found make it easier to write complicated calculated fields, so today I’m going to share those tips with you.
Before we get started, let’s define what I mean by “complicated”.
Quite simply, I’m referring to any calculated field that you might find
difficult to write. If you’re a beginner, this might be an IF statement. Or,
for more experienced users, it might be complex nested table calculations. The
techniques I’m sharing here are applicable to whatever you consider
complicated. And, hopefully, by applying these techniques, you’ll find it
easier to move from basic calculations to advanced ones.
For this post, I’m going to use examples from my Coxcomb Chart Template. Please don’t worry if the calculated fields do not make
sense to you—the calcs themselves are not the point. Rather, the important part
are the methods I’m sharing to help reduce the complexity.
# 1: Break Logic Into Pieces
My first tip is to break down complicated logic into smaller,
more digestible chunks. Something I often see is that people will try to cram
all their logic into a single calculated field. This is problematic in a number
of ways. First, it just puts too much logic (and thereby, complexity) into a
single field, making it incredibly difficult for others (or the future you) to
understand. Second, there are times when multiple calculations are simply easier
to compute in Tableau. Take, for example, a calculated field that includes
multiple table calculations such as INDEX and WINDOW_SUM. If you put both of
these in a single calculated field, then you can only compute those table calcs
in a single way. Whereas, if you separate the table calculations, you can
compute each table calc differently, giving you much more control over the result.
This, in my opinion, is essential to understand when building complicated
table calcs.
Take the coxcomb chart, for example.
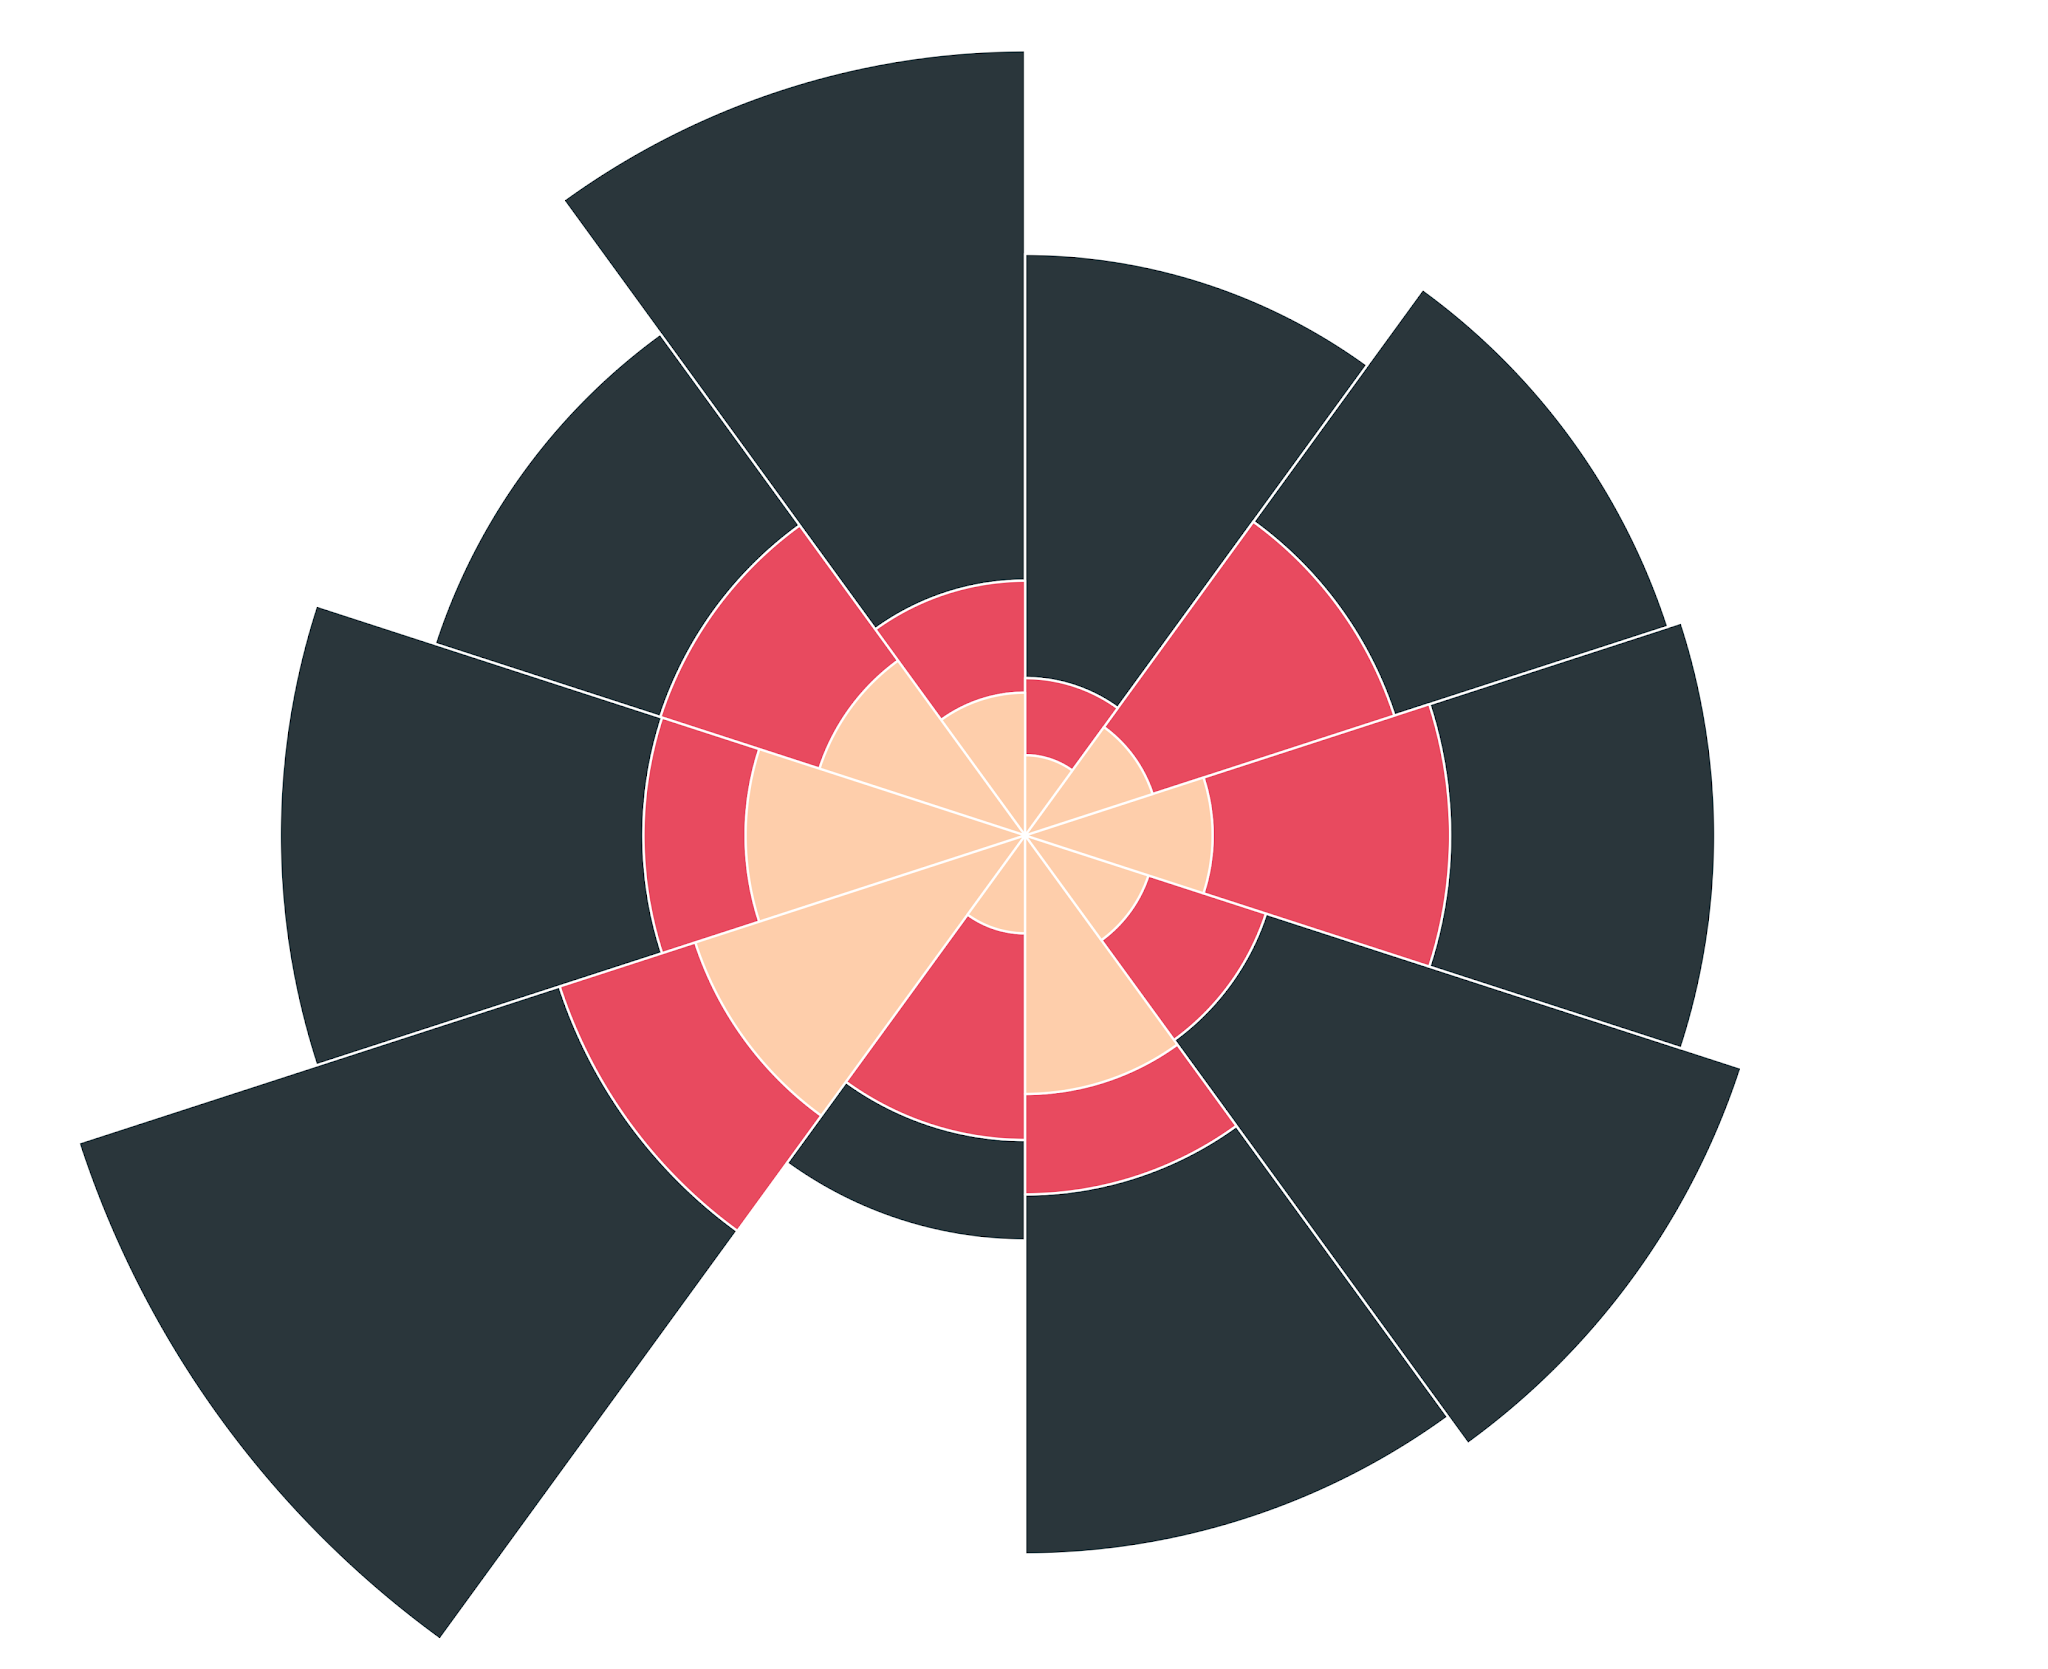
To create this chart, we must calculate the X and Y coordinates of each point around each segment, which we then connect
using polygons. As you might imagine, this is quite difficult—it requires the
use of geometry and trigonometry, as well as some other advanced techniques such as data densification and table calculations. So, to arrive at calculations for the
X and Y coordinates, I broke the logic into small digestible chunks. In fact, I
have 11 calculated fields that build upon each other before I even get to X and
Y. The calculated fields do the following:
1) Section Count –
Count the Number of Sections
2) Section Spacing
– Determine the Angle Spacing Between Sections
3) Overall Section
Size – Determine the Overall Size of Each Section
4) Max Section Size
– Get the Maximum Overall Section Size
5) Part Size – Get
the Size of Each Sub-Section
6) Section Index –
Create an Index for the Sections
7) Point Index – Create
an Index for the Drawing of Points
8) Point Step – Determine
the Angle Spacing for Each Point
9) Radius – Calculate
the Radius of Each Point
10) Angle in Degrees
– Calculate the Angle of Each Point
11) Angle in Radians
– Convert the Angle to Radians
It’s not important to understand why I’m doing each of these
items (unless you really want to understand how to build a coxcomb chart!) The
important thing is that there are lot of different things we need to do, so I’ve
broken them into small chunks. Most of these calculated fields are only a
single line and the largest is only 9 lines. Because of this, they are much
easier to understand individually. And, just as important, they are much easier
to build when you’re only concerned about one piece of logic at a time. You
build one calc, get it right, then move onto the next, building upon each in an
iterative fashion until you final reach the end goal.
# 2: Number Your Calcs
When you’re building calculated fields in an iterative
manner as detailed above, it can be somewhat difficult to know which fields are
built upon which other fields. The list of calculated fields above, when shown
in Tableau, are sorted alphabetically like this:

The “hierarchy” of these calculated fields is not immediately
obvious—you can’t tell which field comes first and which comes last. So, if you
need to go back and edit them, it can be a bit confusing to know where to
start. For this reason, I recommend numbering calculations, especially when
they build upon each other in an iterative way. The result would be something
like this:

We can now clearly see the order in which the calculations
are build. Section Count comes first and we build upon that until we
finally reach X and Y. In order to understand how Angle in
Degrees is built, we will likely need to understand all the calcs numbered 1-9.
# 3: Build a Table
So, now that you’ve broken your logic into small chunks and numbered
your calculations to make it easier to manage them, how do you know that each
calculation is working properly? I often see people try to build all the calcs,
then plot them on a graph. I recommend avoiding this approach as it can be
difficult to verify your calculations in graph form. Instead, plot your
calculated fields in a table first as shown below.
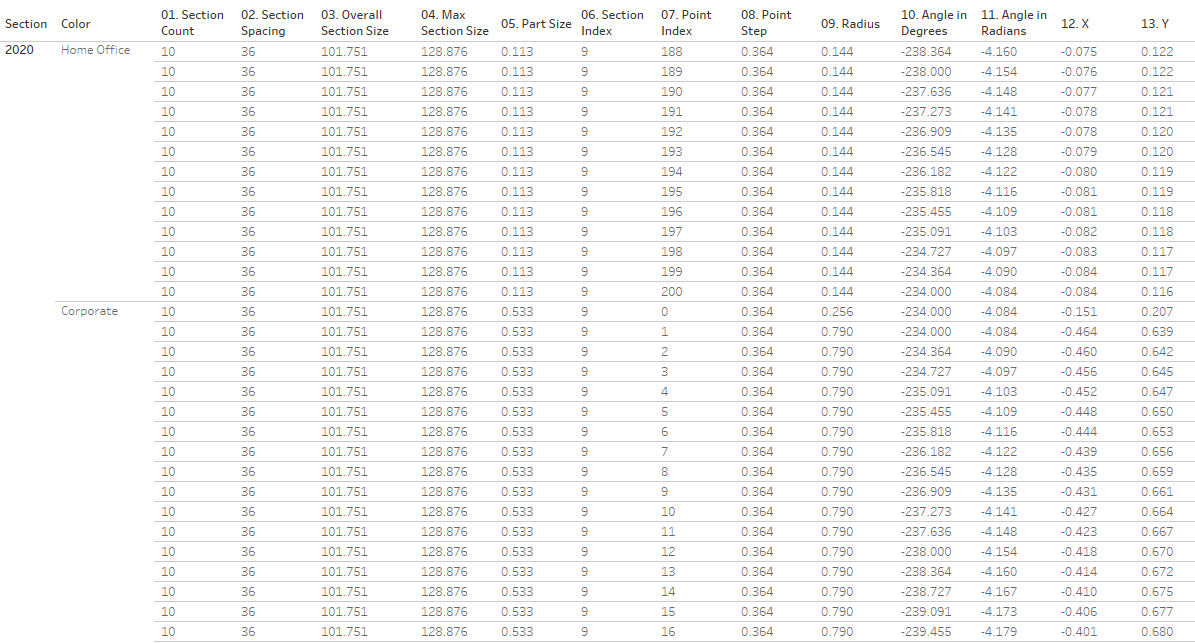
This, of course, looks a bit daunting, but you won’t be waiting
until the end to create this table. Instead, as you create each calculation,
add it to the table, then check the values to make sure they’re what you expect.
If you’re dealing with table calculations, you can use this to adjust the way
they compute until they work exactly as you need. As you build your
calculations iteratively, continue adding them to the table and verifying the
values one-by-one. Make sure each is correct before moving on to the next
calculation.
# 4: Comment Your Calcs
My final tip is to make sure you comment your calculated
fields. In my opinion, comments are one of the most underutilized feature in
Tableau. By thoroughly commenting your code, you are future-proofing it as much
as possible. As I’ve written before, there are two key reasons for commenting your calcs:
First, you do not want to own this code forever—at
some point in your career, you’re going to get promoted, move to a different
project, or get a new job and someone else is going to need to take over the
maintenance of your code. If you do a good job of commenting your code, then
those comments will make it much easier for that new person to understand what
you’ve done and why. And that translates to less of your time in knowledge
transfer.
Second, you will eventually forget what the code does.
If you’ve been away from a block of code for a while, it’s simply impossible to
remember exactly what it does and why. In this case, comments are your best
friend as they will be the guideposts which remind you of what you were
thinking when you wrote the code.
This is all that much more critical when you’re dealing with
complicated calculations, especially ones that build iteratively upon others.
Without thorough comments, you (or the future you) will inevitably fail to
understand the purpose of the calcs, making it next to impossible to make
changes.
My advice is to not be shy with comments. You clearly do not
want to write a novel, but you need to include as many comments as possible to
ensure that a calculated field can be understood. For example, here’s my Point
Step calculated field.
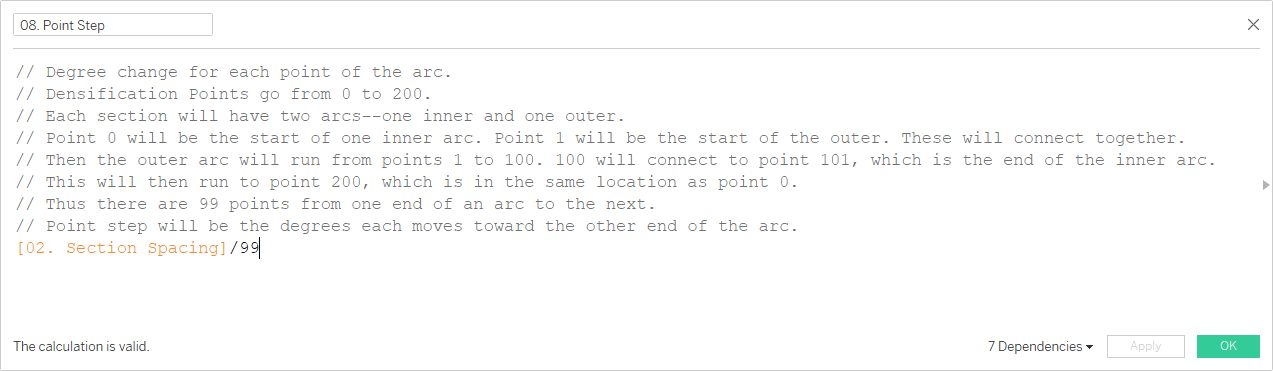
The calculated field is only one line of code (because of tip
# 1) and yet I’ve included 8 lines of comments, which explain exactly what the
calculation is, what it’s doing, and how it fits into the overall flow of
calculated fields. When someone else downloads this workbook and reads these
comments, they should understand the purpose of the calculation quite clearly.
And, just as importantly, when I look at these calcs in the future, I won’t
have to remember why I did what I did.
Wrap-Up
So those are my four tips for writing complicated calculated
fields. The examples I shared here are quite complex—they use advanced features
like table calculations and data densification—but the techniques I’ve shared are
applicable to anything that you consider complicated. By using these tips,
I’m confident that you’ll be able to tackle tricky calculated fields like a pro.
Thanks for reading!! If you have any other tips that you use
when building complicated calculated fields, please feel free to share them in
the comments.
Header image designed by Freepik
Ken Flerlage, October 4, 2021
Twitter | LinkedIn | GitHub | Tableau Public


I love this. The only other I can think of is consistent formatting for larger calculations (e.g. with nested functions). However if you follow tip #1 this is less of an issue.
ReplyDeleteYep that's a great tip!
DeleteThis comment has been removed by a blog administrator.
ReplyDelete