
QGIS for Tableau Users # 3: Getting Together and Breaking Up (Combining and Splitting Polygons)

We’re once again excited to have Sarah Battersby joining us for the third post in her series about QGIS for Tableau users. Sarah has been a member of Tableau Research since 2014. Her primary area of focus is cartography, with an emphasis on cognition. Her work is focused on helping everyone to visualize and use spatial information more effectively—without the need for an advanced degree in geospatial. Sarah holds a PhD in GIScience from the University of California at Santa Barbara. She is a member of the International Cartographic Association Commission on Map Projections, and is a Past President of the Cartography and Geographic Information Society (CaGIS). Sarah can be contacted at sbattersby@tableau.com or on Twitter @mapsOverlord.
Welcome
back to the QGIS for Tableau Users series. In this third post, we’re going to
walk through merging (and splitting) polygons in QGIS. While Tableau has
an awesome feature for merging polygons together to create custom
territories using the data built into the Tableau geocoding database,
it doesn’t solve all cases where you need to group polygons from outside the Tableau geocoding
database, or when you want to split polygons apart in special ways
(e.g., Split California in half, but not along county boundaries).
So,
today we’ll focus on manipulating polygon geography and cover merging and
splitting polygons based on:
- Attributes
- Drawing lines for the split boundary
The Real Basics (Your Series Disclaimer
Message!)
This
post goes into how-to for specific tasks. If you need to take a step back
and see where to even start (setting up QGIS, basics of adding and working with
files, etc.) please refer back to the the first two posts in this series, Getting Started and Bending Text Files toYour Will!
There
are also several great QGIS tutorials that will provide a broader (non-Tableau
focused) introduction to the power of the software, such as QGIS Tutorials and Tips.
Now,
we’ll get back to our regularly scheduled blog post message about awesome stuff
you can do with QGIS!
Why Merge or Split Polygons?
Grouping
smaller regions into bigger regions allows you to create custom groups of
geography that act as single regions instead
of as individual polygons. That’s a mouthful, so here’s an example. Perhaps you
want to have two regions in California—Southern California and Northern
California—but Tableau doesn’t have those specific locations in its geocoding
database. So, you can make them by grouping the counties into just the right
regions.
Grouping
(and splitting) regions has a few key benefits:
1) Regions
Represent Your True Area of Interest
While
many mapping needs are met by standard geographies (city, counties, states,
provinces, countries, etc.), sometimes our questions require special geographic
boundaries. When we’re lucky, they can built from combinations of counties
or provinces...but sometimes you just need special geographic
boundaries. Merging and splitting polygons can get you just what you
need. And once you have that spatial file with just the boundary you need
for your region, you can quickly use the file for visualization and spatial intersection
functionality in Tableau to perform your point-in-polygon analyses (e.g., how
many customers are in Territory 1?)
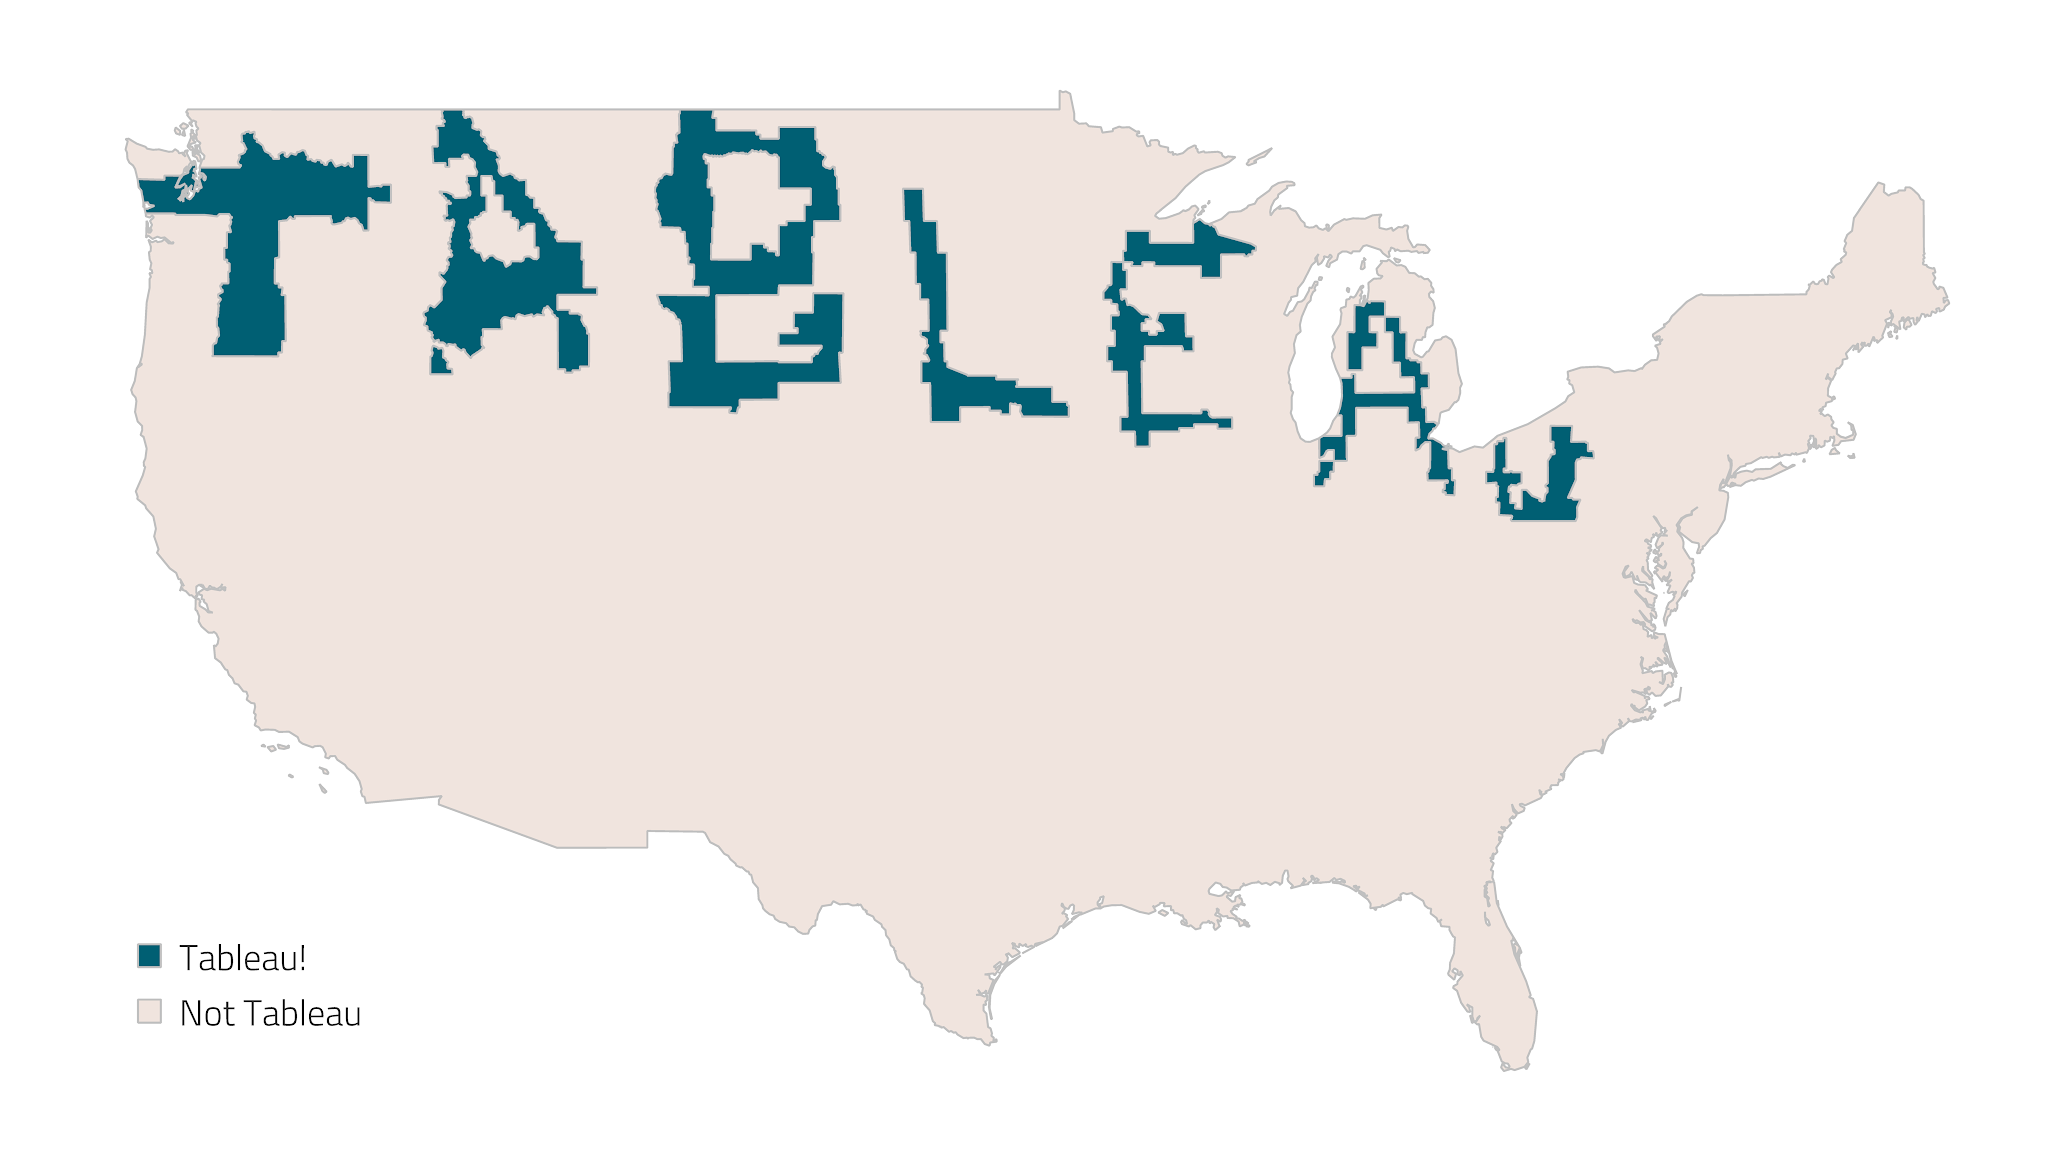
Tableau Territory map created using custom territories based on US Counties
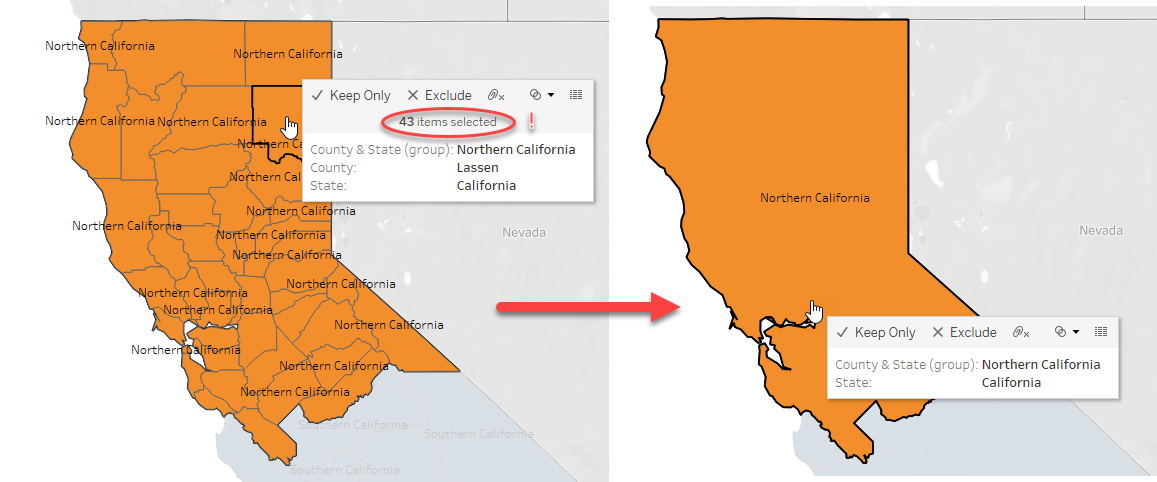
2) Make
Selections Easier
You
can select everything in a single region instead of having to select each
individual polygon that makes up the region.
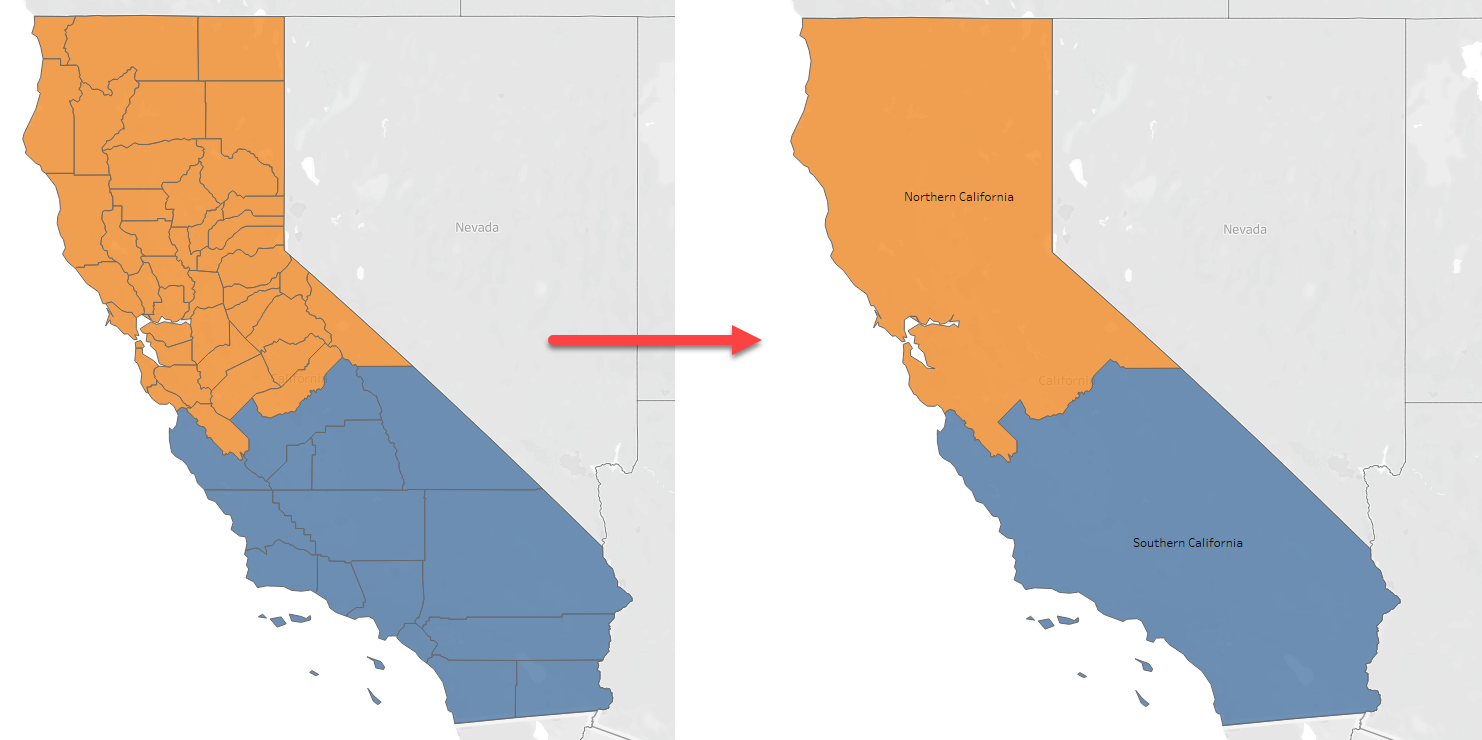
3)
Seamless Visualization
Grouping
is also very helpful for general visualization. For instance, you can symbolize
the region as a whole instead of as a bunch of individual parts as shown below.
When You Don’t Need QGIS
If
the new geographies you wish to map can be built using geographies that are
already in the Tableau geocoding database—for example, if your regions are made
up of individual counties—then there is no need to use a GIS tool. For this,
you can simply use Tableau’s custom territories. But, for more complex use cases, you’ll likely need to get
your hands dirty with GIS.
How To
Okay,
now that you know why you might need
to do this and when QGIS is needed
(as opposed to doing it directly in Tableau), let’s dig into how to do it.
I’m
going to walk you through a few ways to manipulate your data, specifically:
- Merge polygons based on attributes
- Split polygons based on manually drawn
lines
Merge Based on Attributes
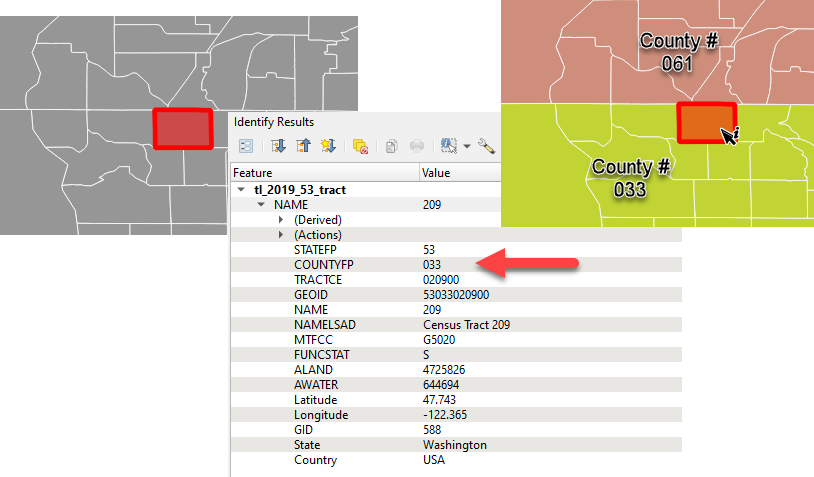
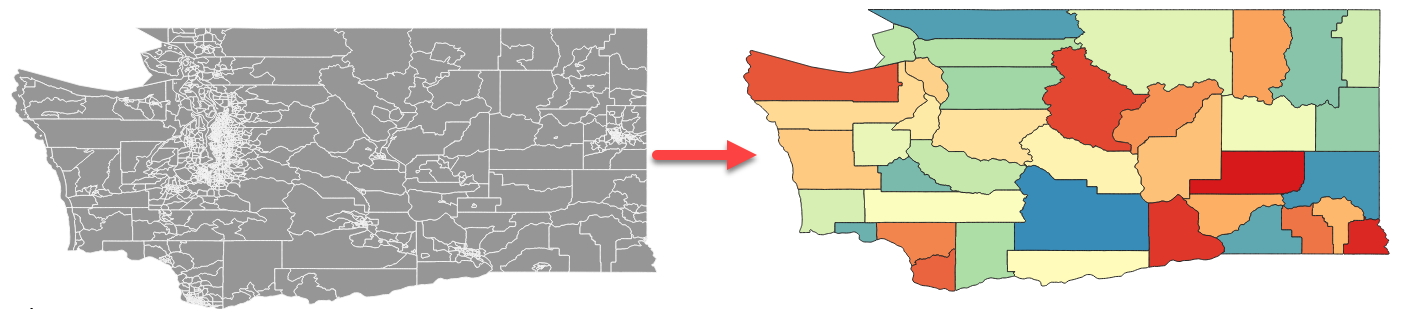
Some
data files have an attribute that defines how the polygons should be grouped
together. For instance, the image below shows data at the Census Tract
level. We can look at attributes for the selected polygon and see
COUNTYFP, which is a unique identifier for which county each Census Tract falls
inside. The map on the right shows the same Census Tracts colored based on
their county. If we needed to combine these Census Tracts into Counties,
we can do it easily here.
Note: In real life,
it doesn’t make sense to group Census Tracts into Counties since Counties
are already in the Tableau geocoding database. I’m just using this example
since it’s straightforward and easy to understand.
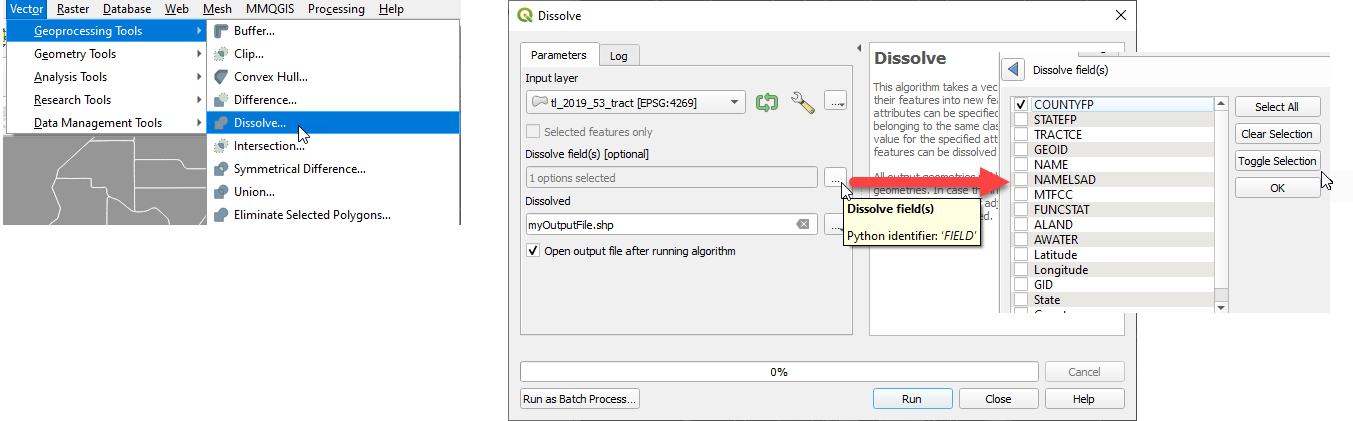
To
combine the Census Tracts into Counties in QGIS, we’ll use a process called
dissolving. This process will “dissolve” the borders between the census tracts
and group them together into a larger geography based on the attribute(s) we
choose. To do this, select Vector
→ Geoprocessing Tools → Dissolve. On the Dissolve dialog,
specify your input layer (the file with polygons you wish to dissolve
together), select one or more fields/attributes which will define how they
should be grouped (in this example, we’ll just choose COUNTYFP), and then specify
a name for the output file (and remember where you save it!!)
When
the processing is done, close the Dissolve window and enjoy the results. In our
example, the census tracts should all be merged into polygons based on the
COUNTYFP attribute, as shown below.
You
may still need to do some attribute cleanup (e.g., data from each of the
original polygons haven’t been magically aggregated based on the merge), but
that’s pretty easy. Most of the time I just delete all of the columns
except for my unique identifiers for each polygon and then join the interesting
data back in in Tableau—because Tableau is really good at aggregating and
letting me adjust the aggregation however I want.
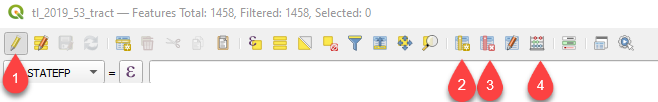
If
you’d prefer to do edits to the attributes in QGIS, right-click on the
layer name, open the attribute table and start editing. You can calculate
new fields (2) or update existing values using the Field Calculator
(4). When you’re editing (1), you can also use the Delete Fields (3)
button to remove fields you no longer need.
Split Based on Lines You Draw
Sometimes
you need to split instead of merge. For example, let’s say that you need to
break California into two regions—Northern California and Southern
California—and the border cannot be defined by county boundaries. Using
the editing tools in QGIS you can easily split the polygon wherever you want.
Here’s how:
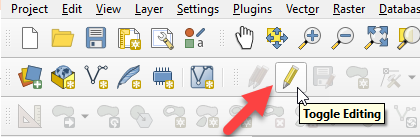
First
turn start the editor:
Next,
use the Split Features tool on the Advanced Digitizing Toolbar.
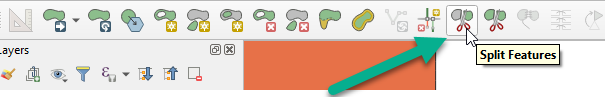
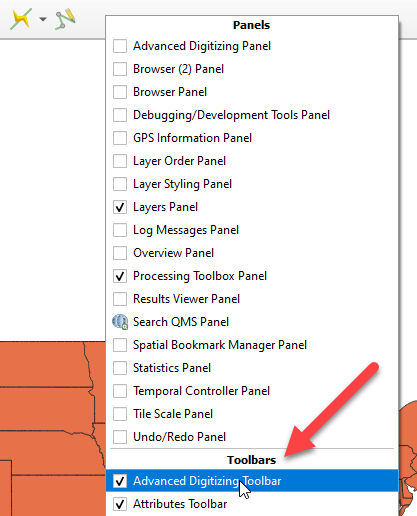
If
you don’t see the tool and toolbar shown above, you may need to turn it on
(right click in the empty grey space on the toolbar at the top of the window
and make sure the checkbox next to Advanced Digitizing Toolbar is checked).
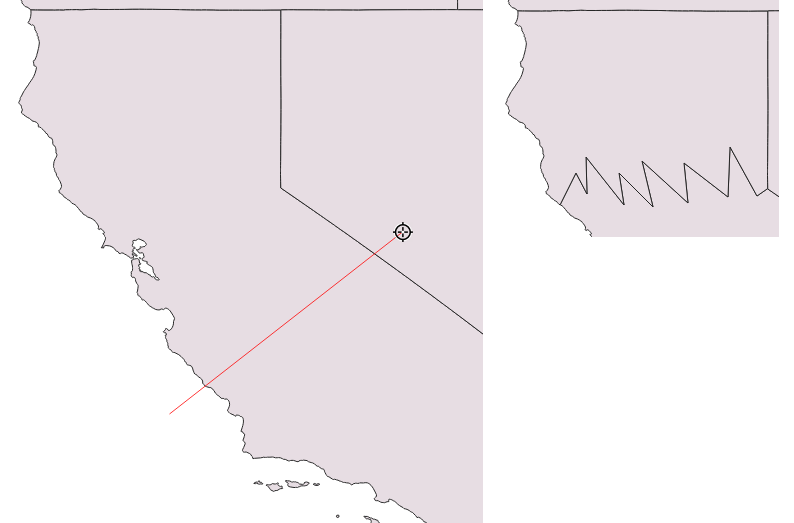
Now
simply click and draw the line you want to use to split your polygons. When
done, just-right click (and make sure your line fully crosses every polygon you
want to split with that line). Your lines can be simple or
complex—whatever you need to draw the split just where you need it!
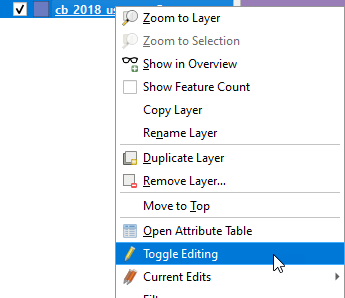
When
you’re done, save the edits by clicking on the Toggle Editing button on the toolbar or right clicking on the layer
name and selecting Toggle Editing):
You
will want to do some attribute cleanup since the new polygon(s) will just have
a duplication of the original polygon data values. Some basic tips on
editing attribute tables are listed above. There is also a great set of
documentation on working with the attribute table in QGIS.
Next Up!
And
those are the basics of merging and splitting polygons that I often fall back
on to make special geometry to work with in Tableau. Not too bad, eh? In the
next post in the QGIS for Tableau Users series, we’ll talk about proximity
analysis, including creating adjacency matrices, joining attributes based on
location, and creating Voronoi or Thiessen polygons around points.
In
the mean time, if great questions or ideas come to you, feel free to reach out
on the Tableau Community Forums
or to follow more of the random Tableau spatial thoughts that I share on
Twitter (@mapsOverlord)...or to
share the great maps that you’re making in Tableau. Thanks for reading!!
Sarah Battersby, September 20, 2021


No comments: