
Four Cool New Features in Tableau 2025.2: Part 2

In June, Tableau released the latest version of their platforms (with the exception of Server, which is now on a twice annual release cycle) and there is a ton of new stuff!! Lots of it involves Tableau Next and Pulse, but there are also some nice additions to Desktop & Cloud.
In my first post, I introduced you to Google Apps Integration and Dynamic Spatial Parameters. In this
post, I’ll share two more features, Show Me 2.0 and Dynamic Color Ranges.
Show Me 2.0
Show Me has
remained largely unchanged for many years—at least as far back as 2016 when I
started using Tableau. But this version implements two enhancements that make
it easier to use. First, Show Me now includes viz extensions.

Previously, you had to change the
mark type and select a viz extension. While that was easy enough to do, the
addition to Show Me is more obvious and will serve as a regular reminder that
additional viz types are available for your use.
The second new addition is the “Choose
for Me” option. Previously, you needed the correct mix of dimensions, measures,
etc. on your view in order to select an item from Show Me, but the new “Choose
for Me” option will make an educated guess about what fields you might want to
use for this chart. For example, here I’ve connected to Superstore and clicked
the map in Show Me.

If I click “Choose for Me”, Tableau
makes a guess at which fields should be used and adds them to the view. My
first attempt created this choropleth map showing profit by State/Province.

Interestingly,
I found that Tableau doesn’t consistently choose the same set of fields. When I
added a new sheet to this workbook and took the same steps, it created a
slightly different map.

I was
surprised that it didn’t create the same chart as before, but more surprised by
the fact that it didn’t use any measures. In my testing, I observed quite a bit
of this. Another example was that it created a bubble chart using profit as the
measure, something that doesn’t make sense since you can’t accurately portray
negative numbers with a bubble chart (how would you size a bubble with a
negative value?) I expect this intelligence will improve over time as Tableau
integrates more AI into the platform, but I personally don’t think it matters
that much. When Kevin and I teach people to use Tableau, we always demonstrate
Show Me as simply a learning tool. We instruct our students to watch what
happens to the pills when they select one of the options in Show Me—what moves
to Columns and Rows, what goes on each of the Marks Card options, etc. Then, in
the future, build that chart by dragging the pills out manually. And I think
this updated version of Show Me does a great job of that because you don’t need
to have any pills on your view at all. Just start with a blank canvas, click an
option, and see where the pills are supposed to go. Then you can build it
yourself moving forward.
Dynamic Color Ranges
The New
Features page states, “Dynamic Color Ranges help you highlight what matters,
even with outliers in your data. Instead of filtering, use parameters to adjust
your color scale and focus attention where it counts. It’s a fast, flexible way
to keep your charts clear and insightful.”
So let’s take
a look at how this works. We’ll connect to Superstore and create a map showing
Sales by state.

The new
feature allows us to specify the Start, Center, and End of the color range
using parameters. So, let’s create three parameters, Range Start, Range
Center, and Range End. Now we’ll edit the color legend. You’ll
immediately notice that the dialog has changed a bit—it’s more like what you’d
see on the web. But you’ll also see that you can choose one of the parameters
to define the Start, Center, or End of the range.

I used my new
parameters for Start and End and now I see this.

The problem
here is that I left the default values of 1 in both of the parameters, meaning
that the color scale goes from 1 to 1, which makes no sense.
The key is to
populate these parameters with values that do make sense—values that are driven
by our data. So, let’s change these to dynamic parameters that are updated when
the workbook opens. We’ll create a calculated field like this to get the
maximum Sales by State:

And we’ll
create a similar calculated field for the minimum value. We then edit the
parameters to be populated with these values.

And now our
range goes from the smallest value to the largest.

Use
Case # 1: Static Ranges
But this is
pretty much the same as setting the values to automatic, right? Yes, but not
quite. To demonstrate the difference, let’s create two maps—one that uses
automatic color ranges and the other that uses the parameters, as demonstrated
above. Then let’s filter the views, excluding the top two states, California
and New York.
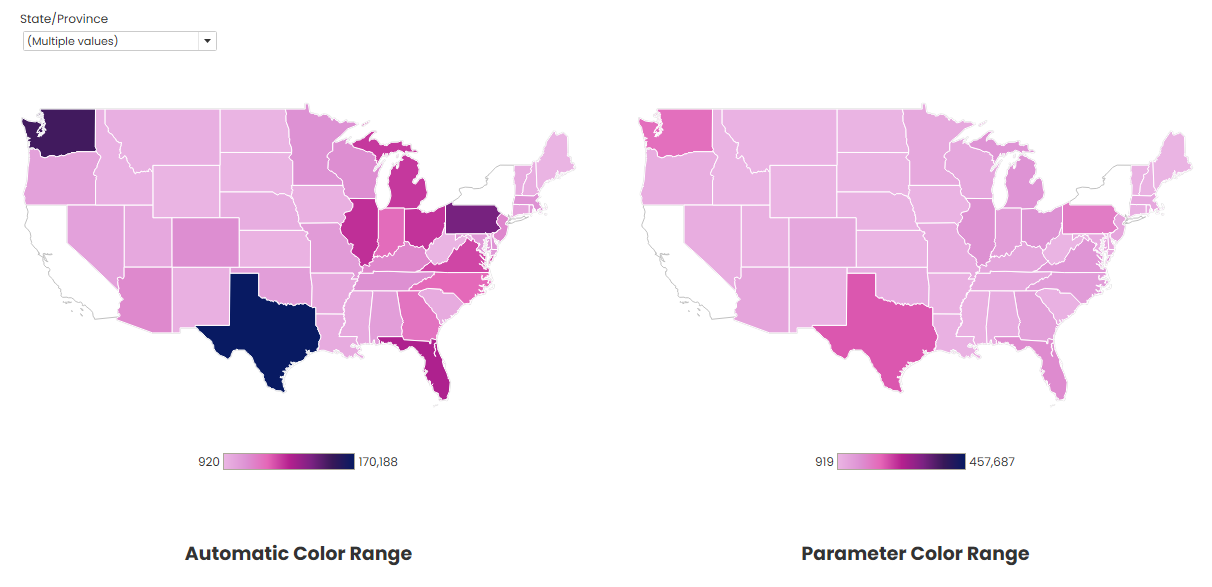
When you
filter a sheet using automatic ranges, it automatically adjusts the ranges to
the filtered data. So, in our case, the top value of the range is reduced to
170,188. The parameter-driven ranges, however, remain unchanged.
This is one of
the viable use cases of this feature. Sometimes you don’t want those ranges to
change based on filters. In the past, you had to perform various hacks to keep
consistent color ranges or hard code the start and end of the ranges, but with
this new feature, we can do it easily with dynamic parameters.
Use Case # 2: Change with Parameter Actions
Of course, we
can do more things with this feature when we apply parameter actions. For
example, on the New Features site, Tableau shows how you could select several
marks and have the color range change dynamically, as shown below.

To make this
work, we create two parameter actions—one that sets Range Start to the
minimum selected sales value and one that sets Range End to the maximum. Here’s an example:

But there’s a
pretty big issue with this particular usage. In the animation below, I select a
group of states and the range changes, but when I deselect those states, the
ranges do not change.

At the end of
this example, I select all the states to reset the ranges back to the original,
but your users likely won’t remember to do that and it’s going to lead to lots
of confusion. Ideally, we’d be able to set those values back to the starting
point using the “Set value to” option, but unfortunately, that value does not
allow you to select a calculated field or parameter—it’s just a static
hard-coded value.
Use
Case # 3: Change Center Point
Another use
case for this feature is setting a center value. For instance, let’s say that
we want to use a diverging color palette on our map and we want our center
point to be the median state sales. We could create a calculated field similar
to the ones shared previously, then set that for the center point.

This works
great if we want this median to remain static. But, what if we wanted it to
adjust automatically when we filter the view? Unfortunately, we cannot fire a
parameter action when a filter is selected (though that would be an amazing
feature that would solve this and many other problems), so we’d have to create
some sort of “Apply” button to trigger the parameter action and update the
median.
But there’s a
much easier way to do that—and it doesn’t require this new feature at all. We’ll
create a calculated field like this:

We then color
based on this measure, causing the middle value to update dynamically.

My final
assessment of this feature is that its use cases are fairly limited at this
time, but I’m hoping that we’ll see additional functionality in future
releases. The ability to use a calculated field or parameter in the parameter
action’s “Set value to” would be helpful, as would the ability to trigger
parameter actions based on a filter selection. I also think this feature could
be greatly improved if, in addition to parameters, we could use calculated
fields. That would allow for much more dynamic control over the color ranges,
without the need for parameter actions.
Other Intriguing New Features
So those are
the four new features I’m reviewing. I’m excited to see all the cool use cases
the Datafam finds for them. But, of course, these are just a few of the dozens
of new features included in this version. 2025.2 includes new Tableau Next
features, including Concierge & Semantic Learning, lots of improvements to
Tableau Pulse such as Custom Calendars and Off-Cycle Alerting, new Admin
Insights content, new connectors and so much more! So, download the new version
today and get started!!
Ken Flerlage, July 14, 2025
Twitter | LinkedIn | GitHub | Tableau Public


No comments: