
A Tableau Color Wheel

I have never created a sunburst in Tableau before and have been wanting to give it a try, but just haven’t found a data set that I thought would work for it. Then one day last weekend, my daughter was looking at a coloring book and I saw an image of a color wheel. It was quite beautiful so I figured that would be a good opportunity to play with a sunburst chart. Granted, all the segments are basically the same size and there’s no real hierarchical data being visualized but it would at least give me a chance to experiment with the chart type a bit.
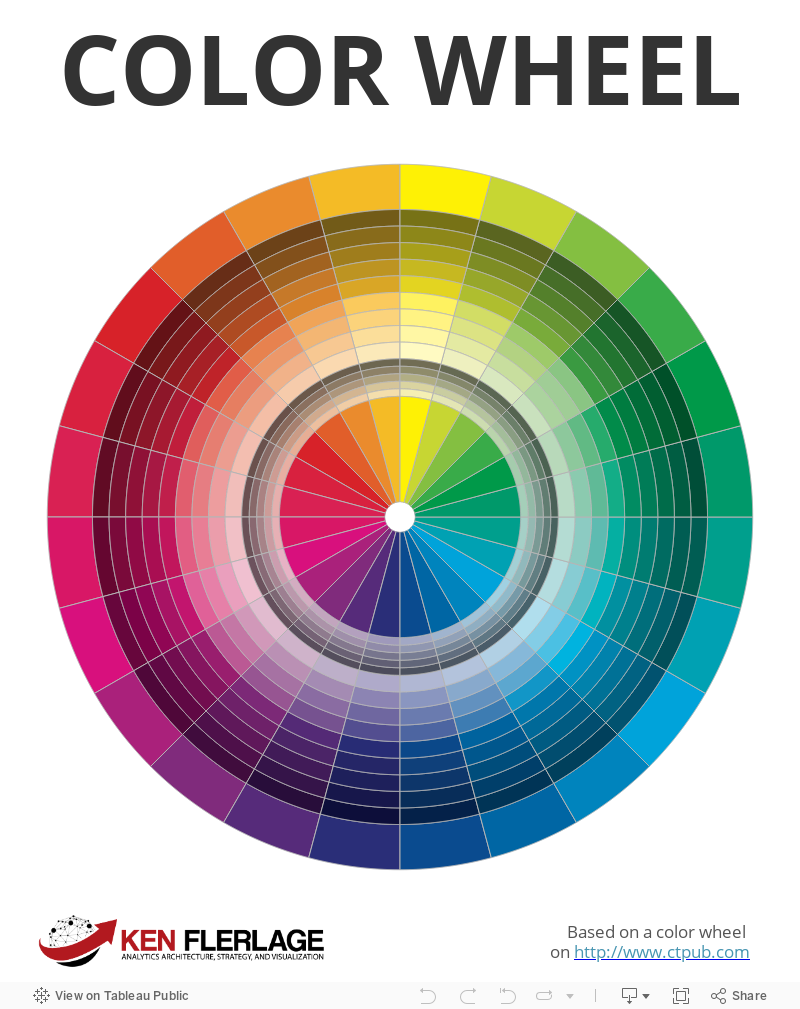
To build the chart, I leveraged a technique created by Bora Beran (Radial Treemaps & Bar Charts in Tableau), which was further explained by Toan Hoang (Sunburst in Tableau). And, as a basis for the chart, I used a color wheel I found on the quilting/sewing site, C&T Publishing.
Here’s the final result. I hope you like it!
Note: Keep your eye out for an upcoming series of posts where I’ll be sharing some templates I’ve created for some of the more complex charts, including sunbursts.
Ken Flerlage, March 8, 2018


Can you design a colorful wheel that spins for random answers? Wondering if that is possible. Example https://yesornowheell.com/
ReplyDeleteThat would probably be quite difficult to build in Tableau, unfortunately.
Delete