
Guest Blog Post: Curvy Tournament Bracket Template

Several months ago, I created a visualisation that looked at the 4 Grand Slam Tennis tournaments and built out a bracket to track the progress of 3 of the best players to grace the sport from the Open Era. After I posted it, Kevin Flerlage reach out to me to tell me how much he loved it. While we were chatting, we came to the conclusion that this would be really fun to turn into a template so that anybody could easily build it (and just in time for March Madness). Sure, it may not have a ton of use cases at your place of employment, but it could certainly lead to a lot of fun visualizations on Tableau Public.
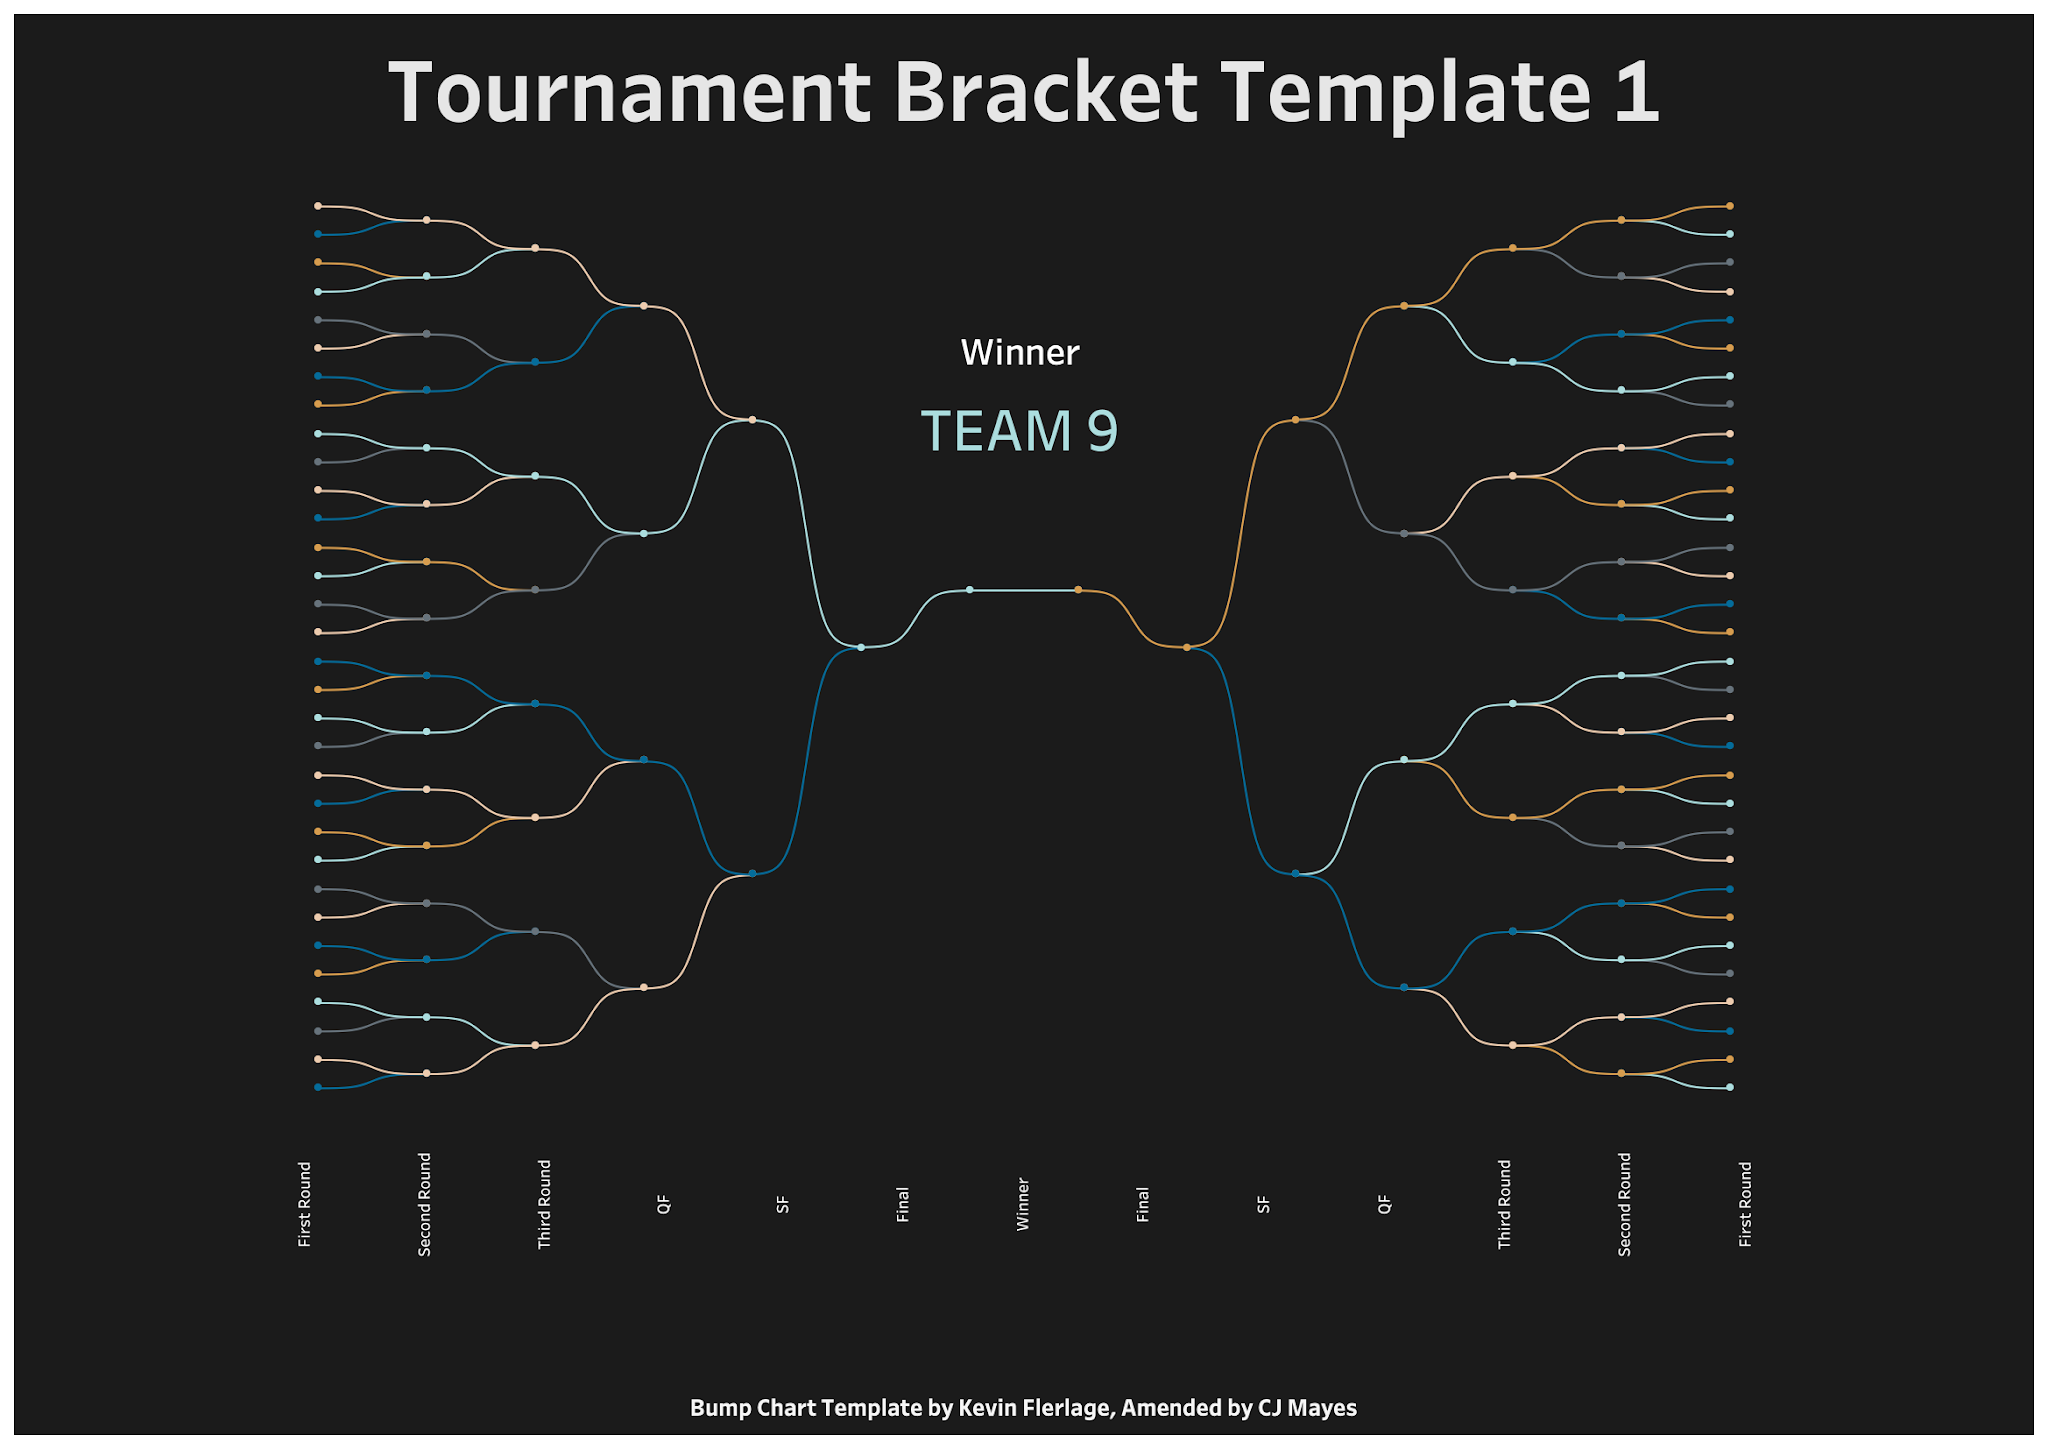
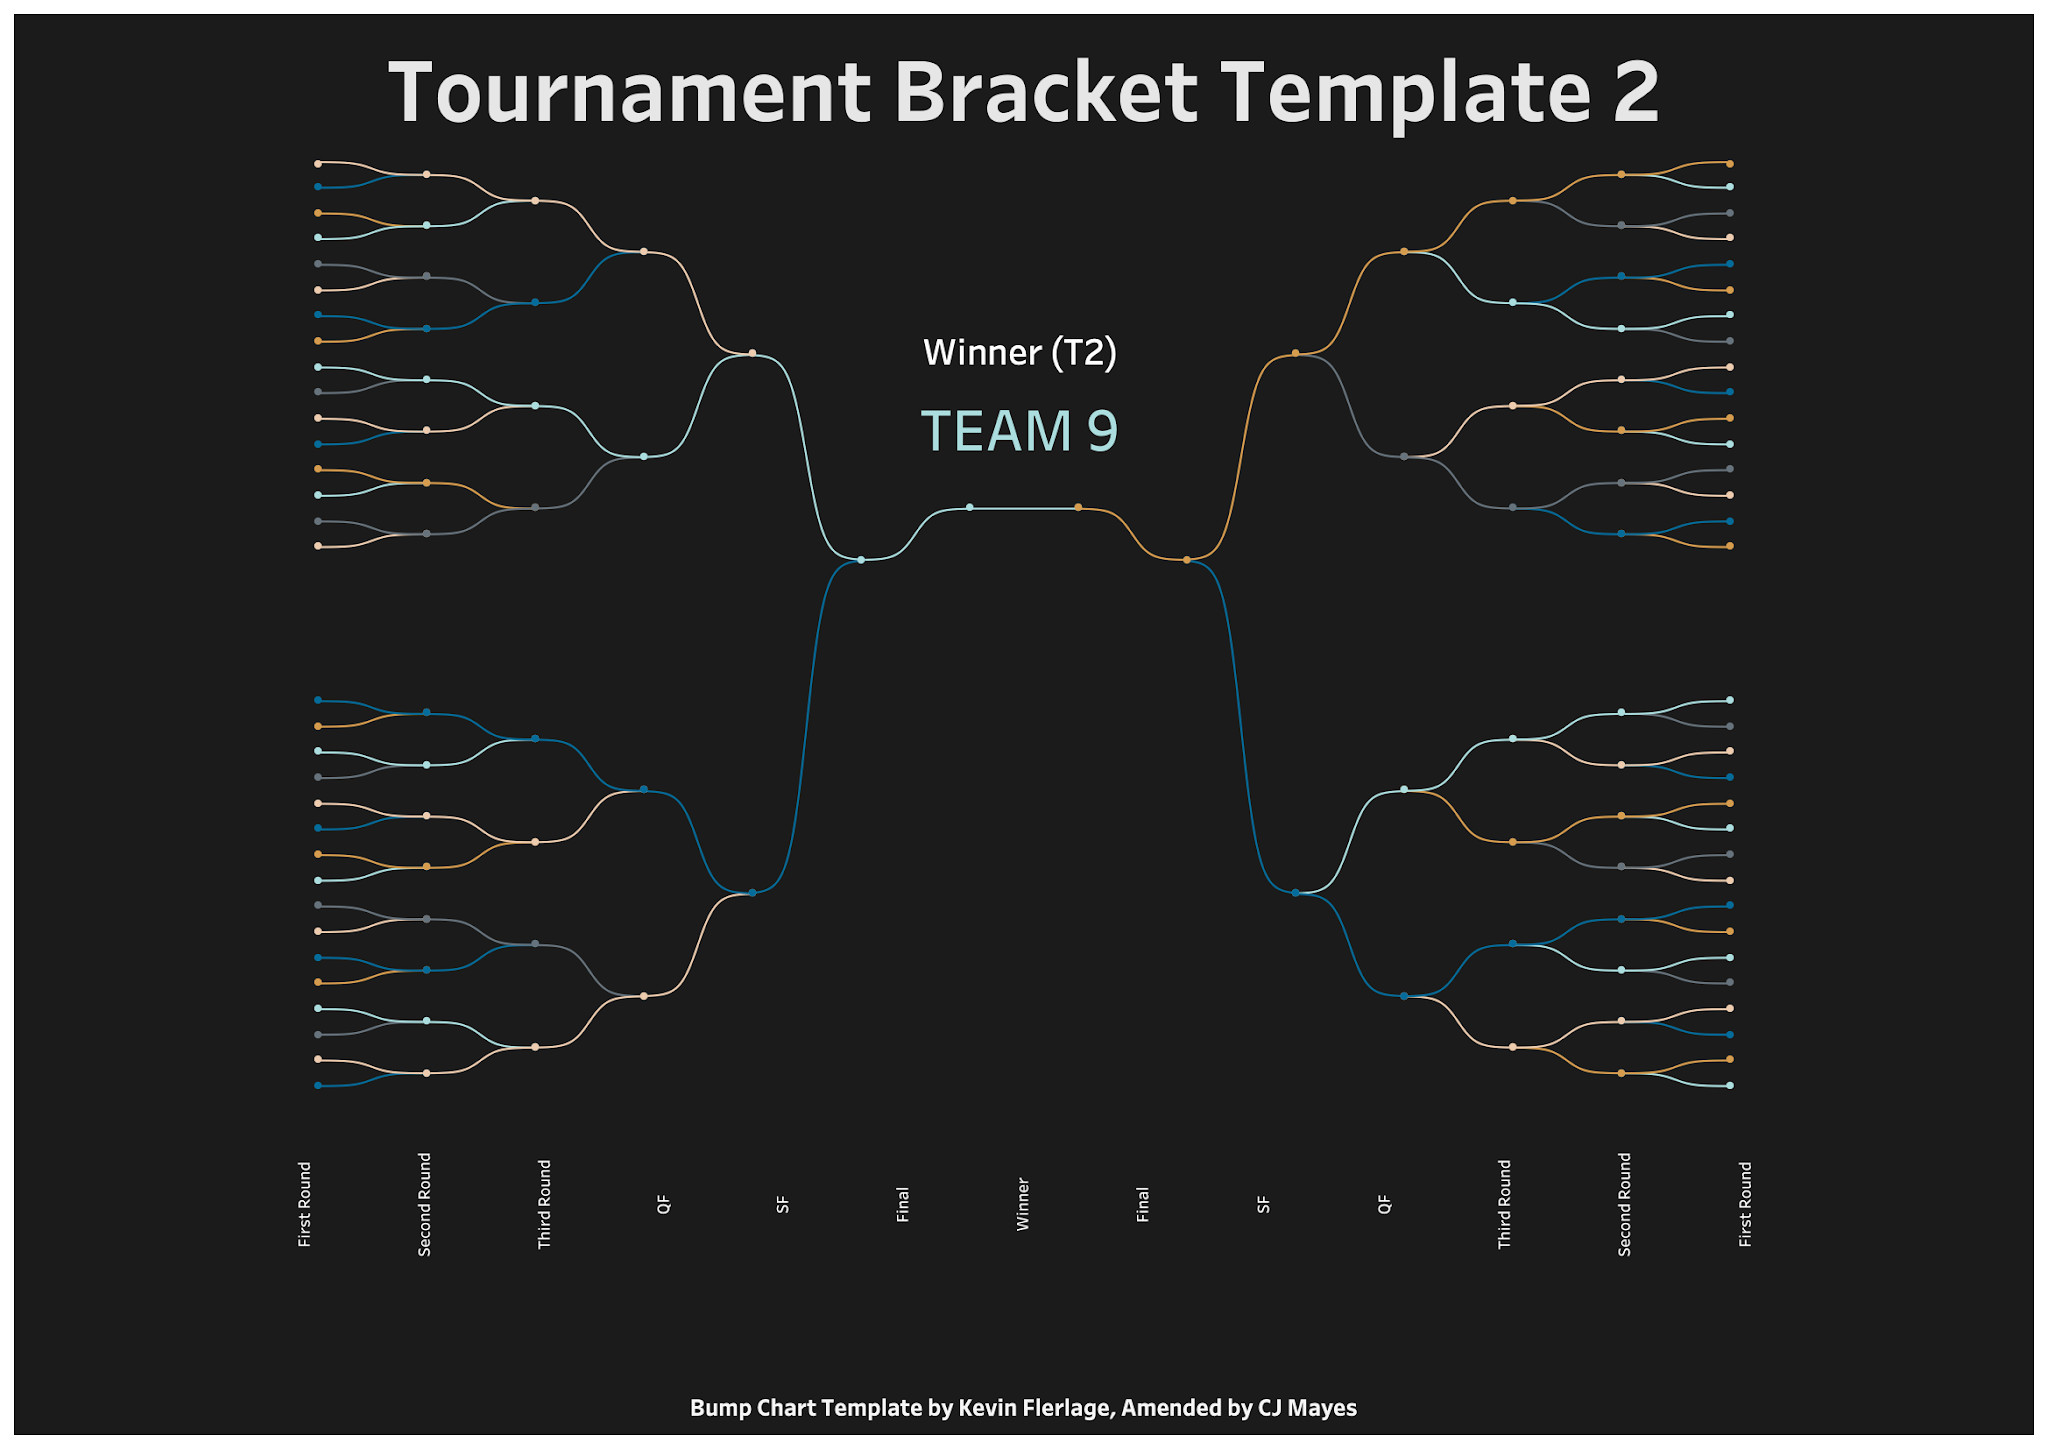
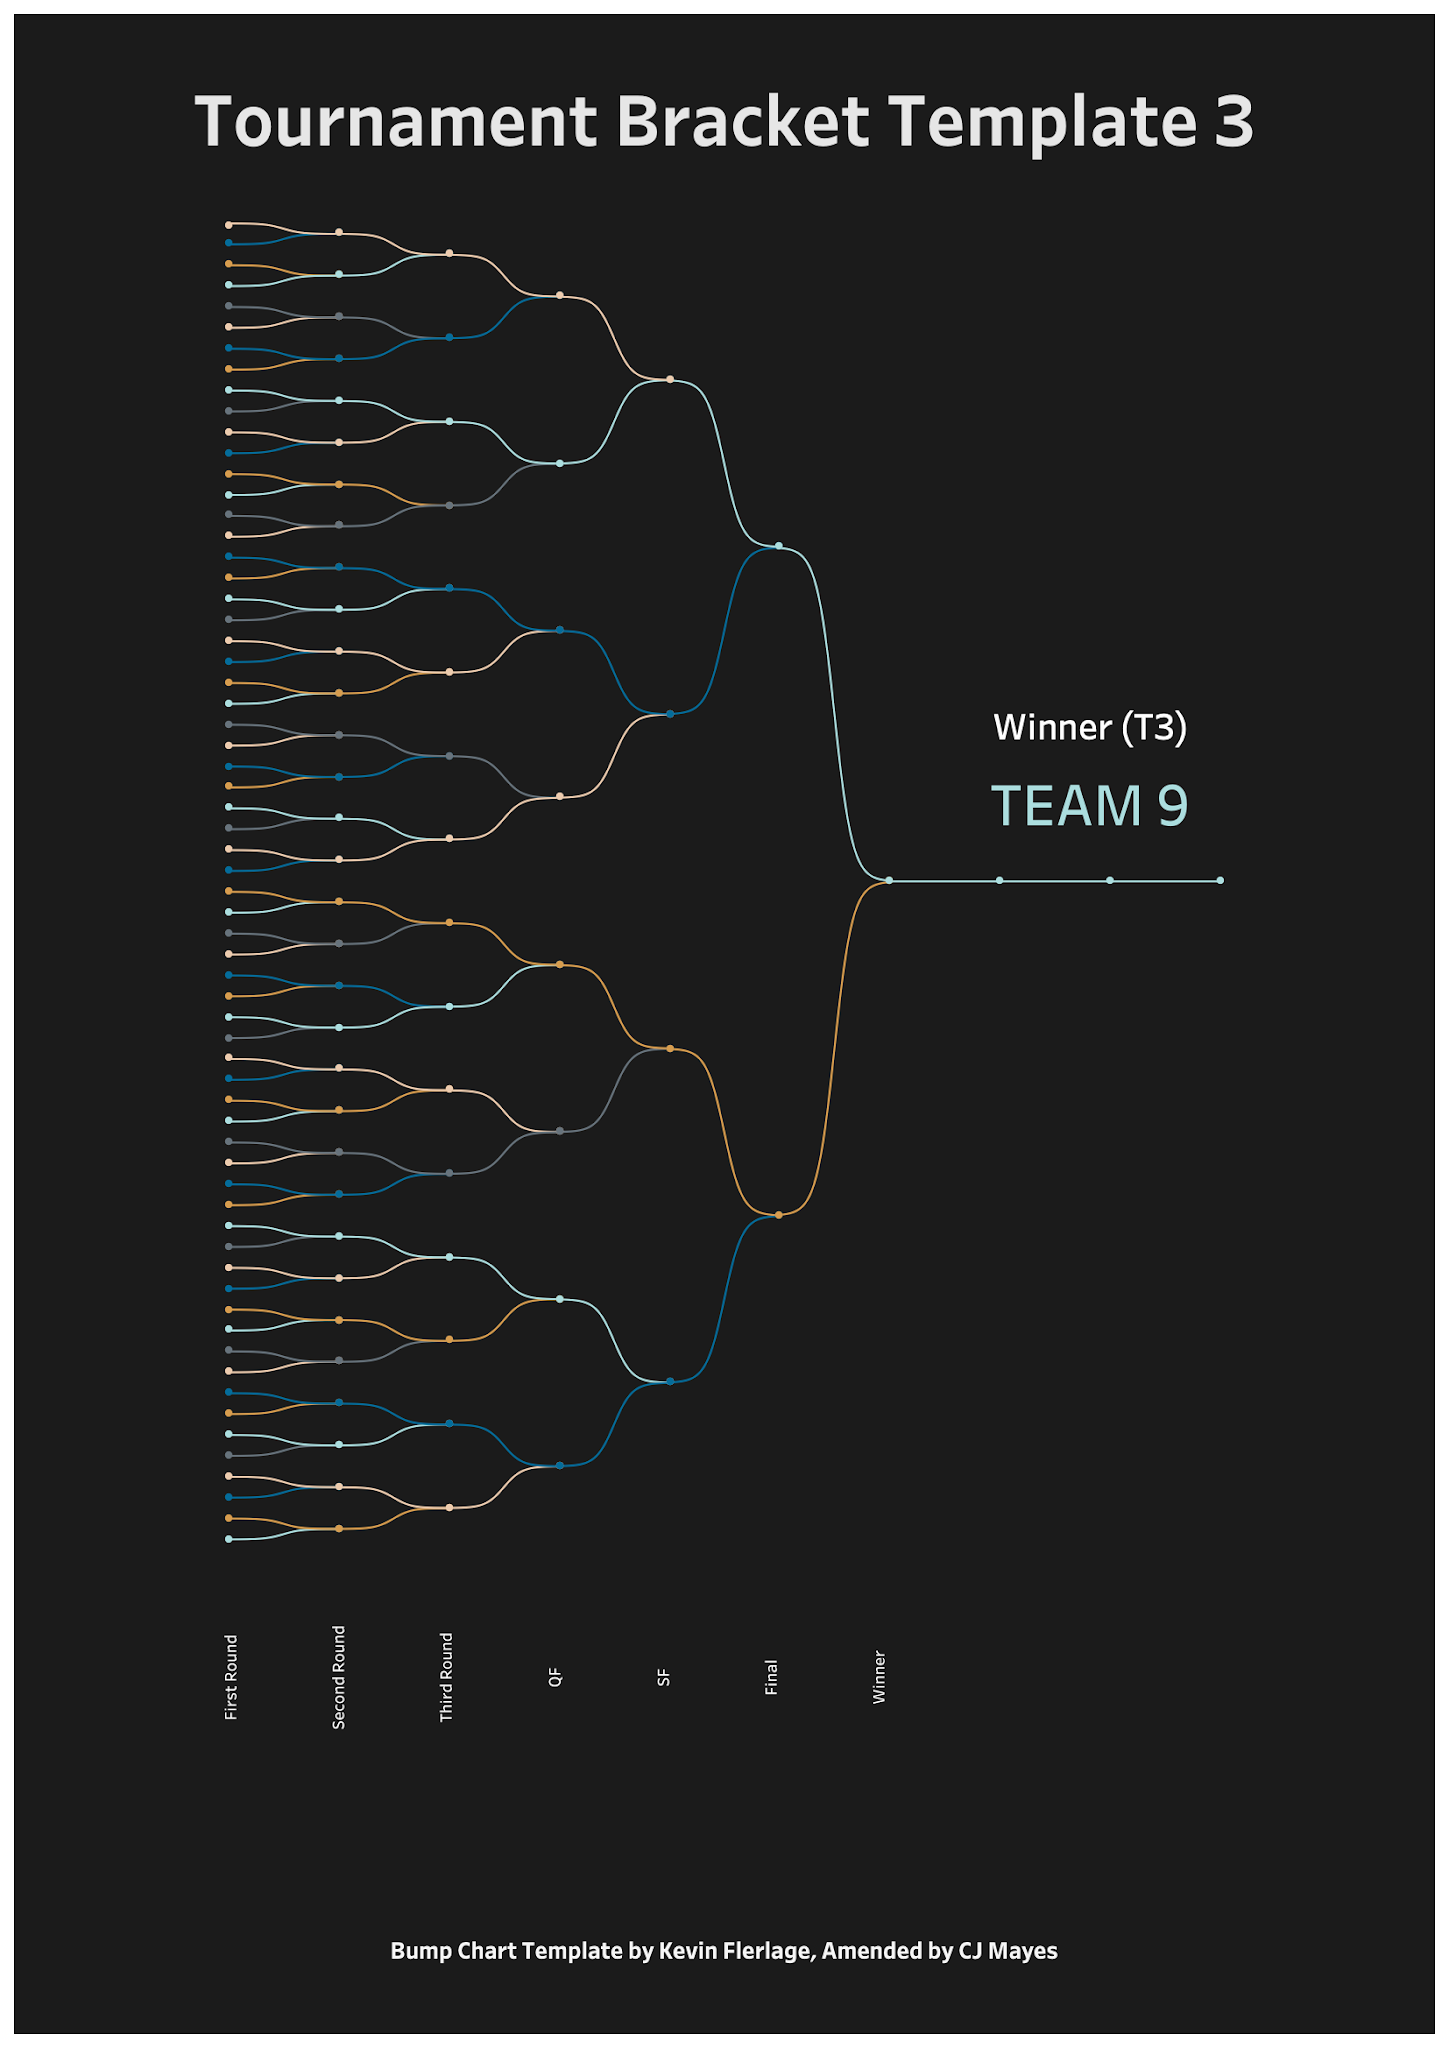
In this blog post, I am honoured to be able to share with the community three different sport tournament bracket templates. They can be customised based on the shape and style that you desire. For example, my third bracket template may be useful for a 64 player/team individual knock-out tournament, whereas my second bracket template is shaped for sports that may have a (North/East/South/West) regional split.
The Brackets to choose from are shown below and can be accessed using my Tableau Public workbook.
This template is based on the Curvy Bump Chart & Slope Chart Template built by Kevin Flerlage. I’d recommend you check out this easy-to use template as a bit of a refresher before proceeding. This will help you to understand how the ranking works and forms the foundation of how the bracket template was made. Similarly, I must give inspiration credit to Ludovic Tavernier & Klaus Schulte for their collaborative Boris Becker piece with an accompanying blogpost on building their tournament flow.
There is a lot of the maths that sit behind the
template within Tableau, but for this tutorial we won’t go into that detail.
However, at the end of the tutorial, I will briefly explain some of the data
entry sheets should you wish to amend your bracket shape slightly. The hope is
to make it as simple as possible.
Okay, let’s dive into the template. The template consists of two pieces, a
Tableau workbook and Excel spreadsheet.
(Once on the file in Kevin's Google drive, go to File and click Download. If you cannot access the Excel spreadsheet on the Google drive, please email him at flerlagek@gmail.com to request a copy).
Excel Spreadsheet:
The Excel Spreadsheet consists of seven tabs. Below is a breakdown of each one.
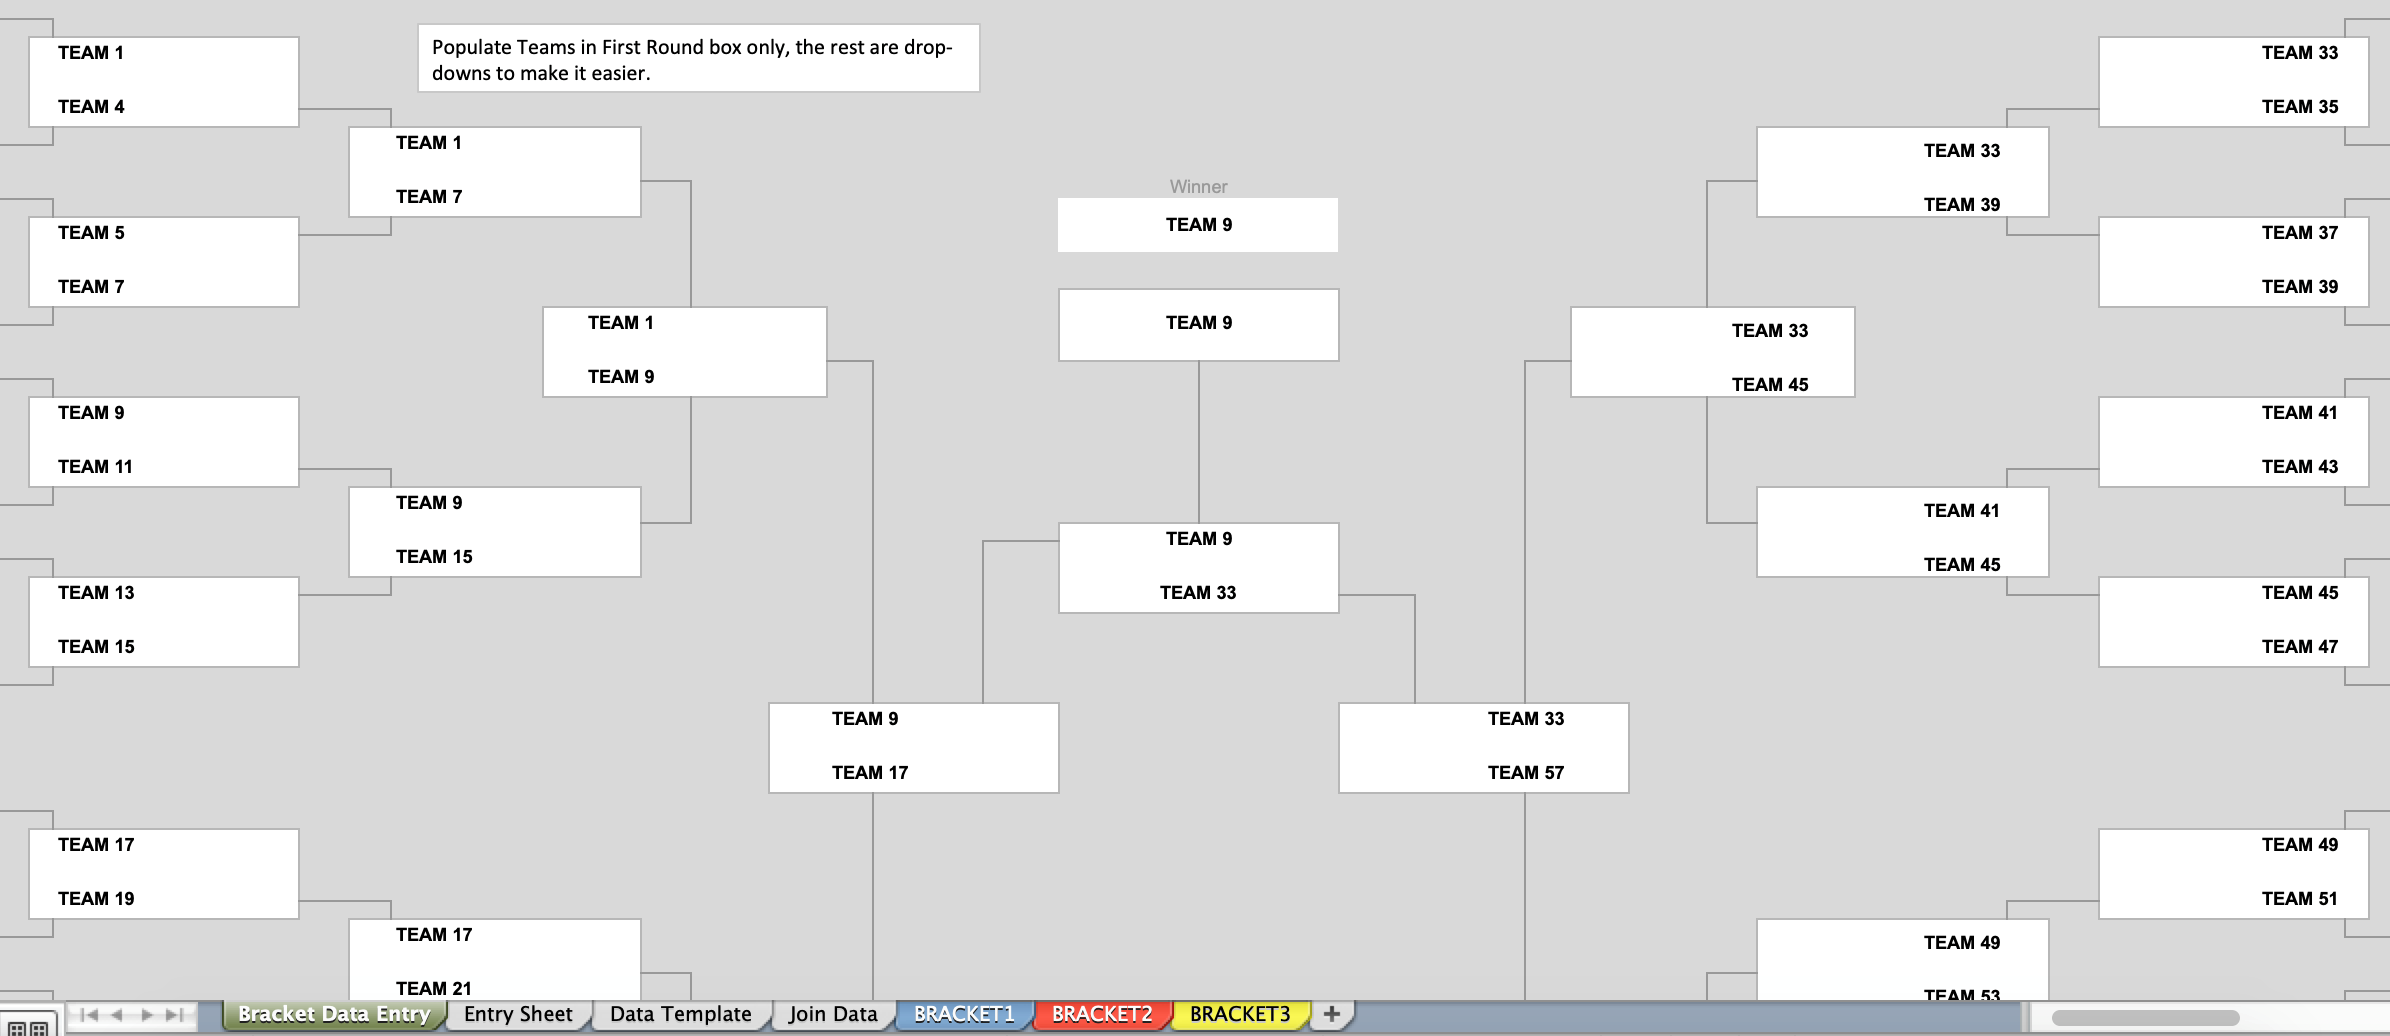
Bracket Data Entry:
This is the data sheet that we will be populating with
our match results. You can see currently that the template is filled with
generic team numbers and is in a tournament layout.
Entry sheet:
This is the data sheet that will drive the Data
Template. We will copy the data out of the chosen bracket style into this
sheet.
Data Template:
We do not need to do anything with this sheet but will
need to use it within the join in Tableau, the formulas do the magic. The
eagle-eyed among us may recognise it from the bump chart tutorial.
Join Data:
This sheet is used in Tableau for data densification,
giving us our curvy lines! We don’t need to do anything to this sheet.
Bracket 1 / 2 / 3:
These are three different styles
of bracket that you will see. We will use bracket 1 for the tutorial, but feel
free to use any of them. It’s important to use the correct bracket with the
correct template as the ranking used within the brackets differ slightly, more
on this later.
Tableau Workbook:
The workbook contains all three-bracket types. On the main page, simply click on the bracket
you are interested in. Each bracket uses
data from a different tab of the Excel template, so although it all comes from
the same spreadsheet, it actually comes into Tableau as three different data
sources. Once you have finalized the
bracket you will be using, you can delete the two unwanted dashboards and can
close their corresponding data sources.
Let’s start the build.
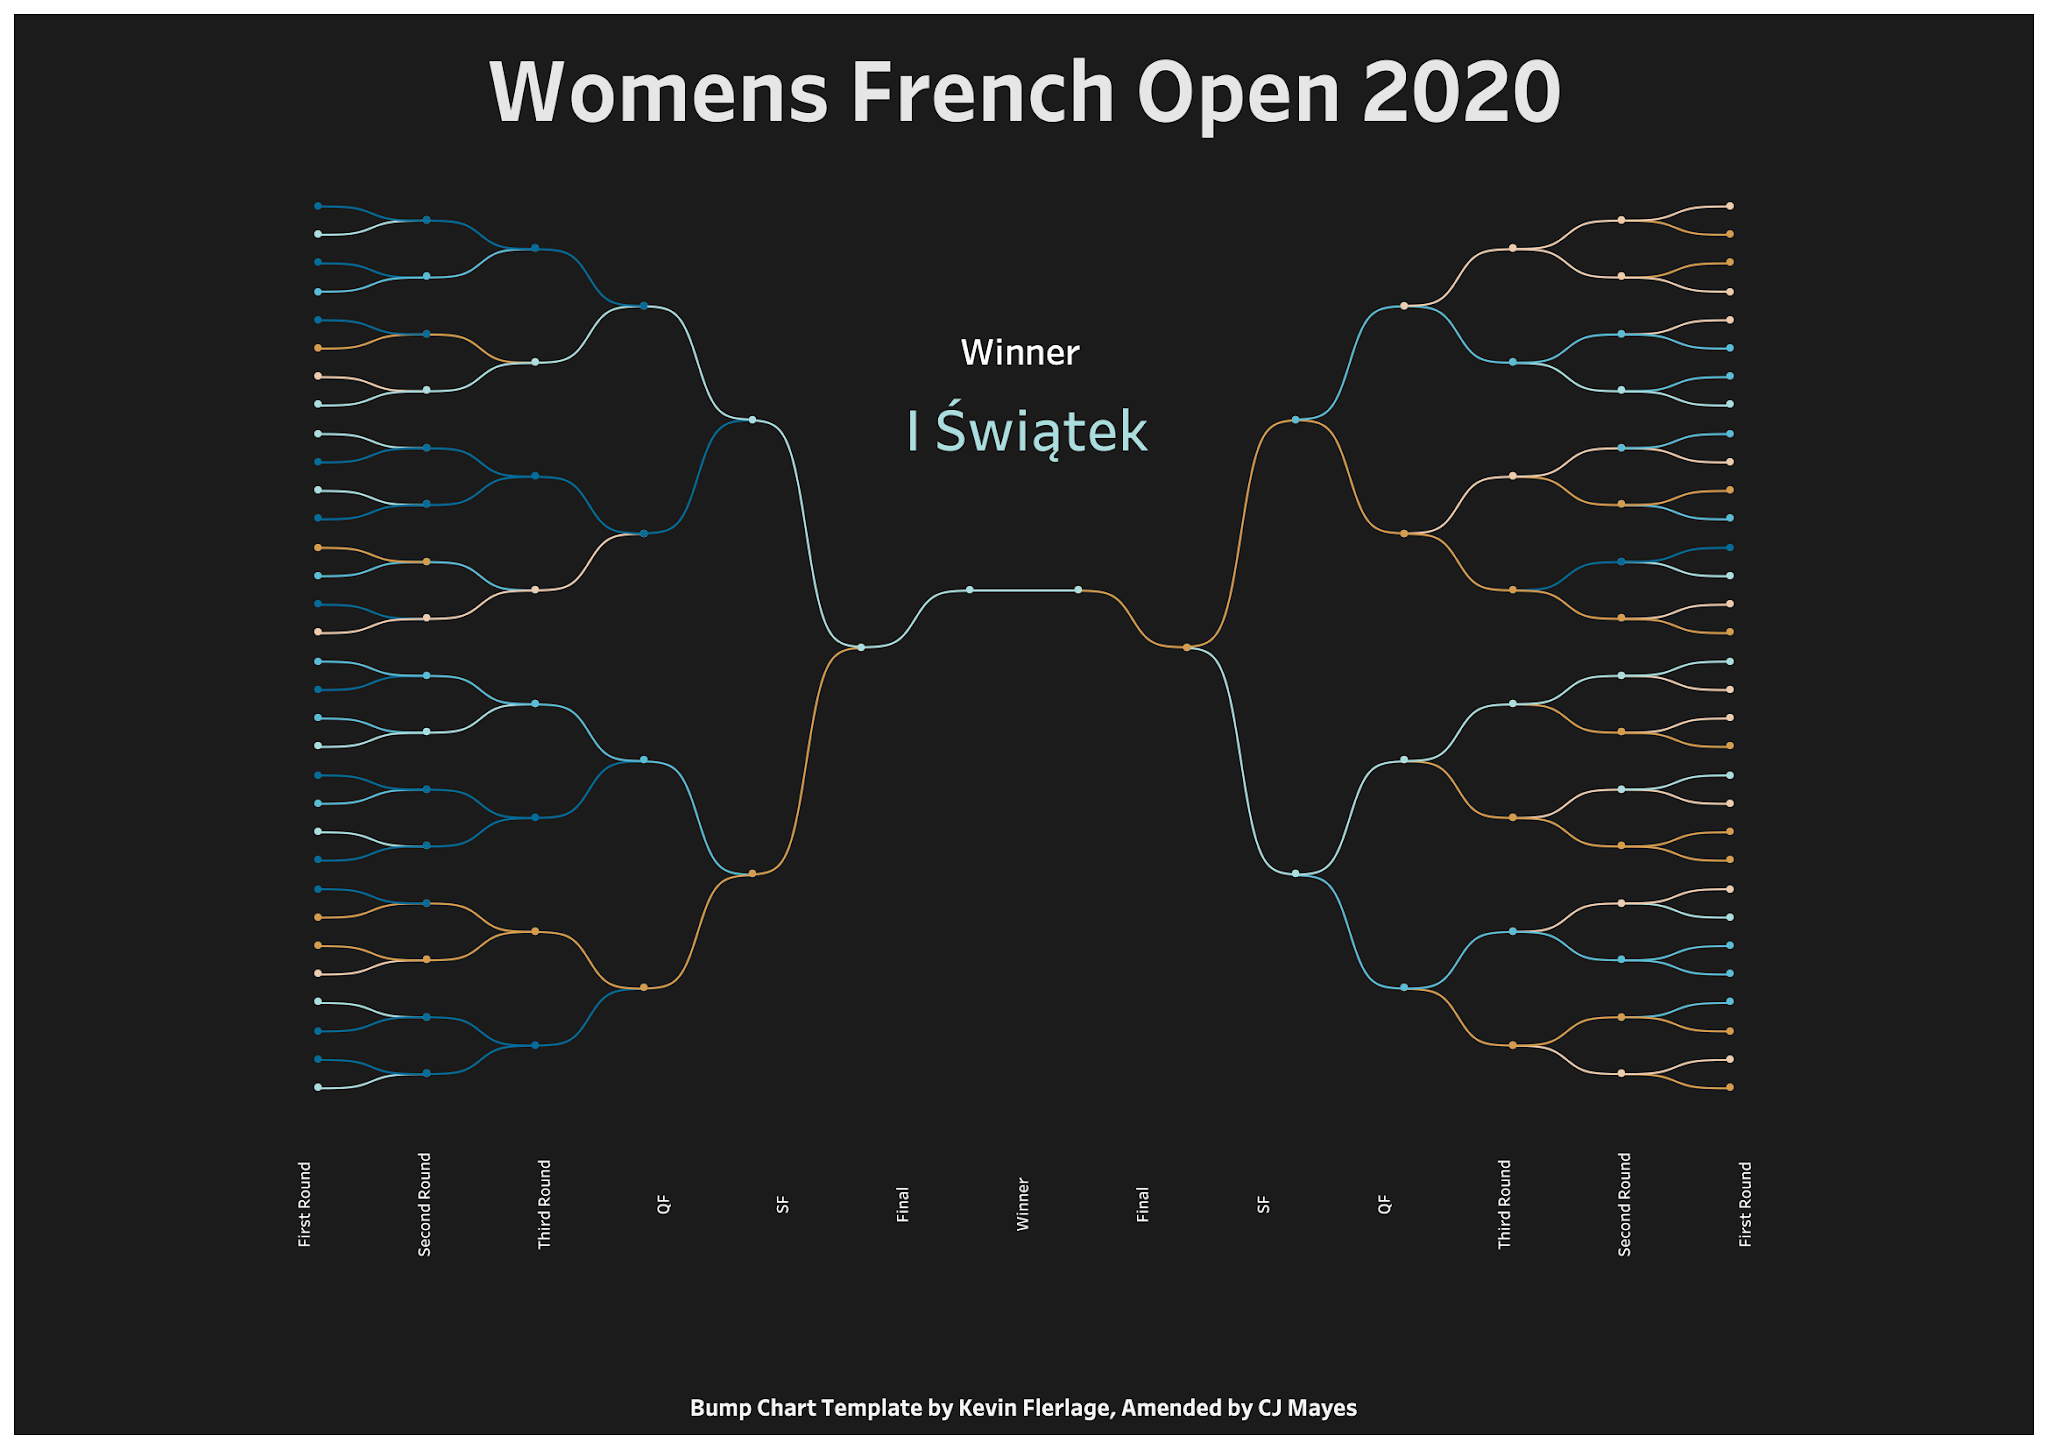
Locate the data we want to use. For this example, I
will be using the most recent Women’s French Open 2020 Tennis results to run
through the process as an example. If you’d like to follow along, the results
can be found here.
Open the Excel Document and the Tableau Workbook. From
the three tournament bracket options, choose the bracket that you’d like to
replicate. For this example, I will use the bracket 1 (blue worksheet). Once you’ve selected one, delete the other
two dashboard brackets and close their data sources within the Tableau workbook.
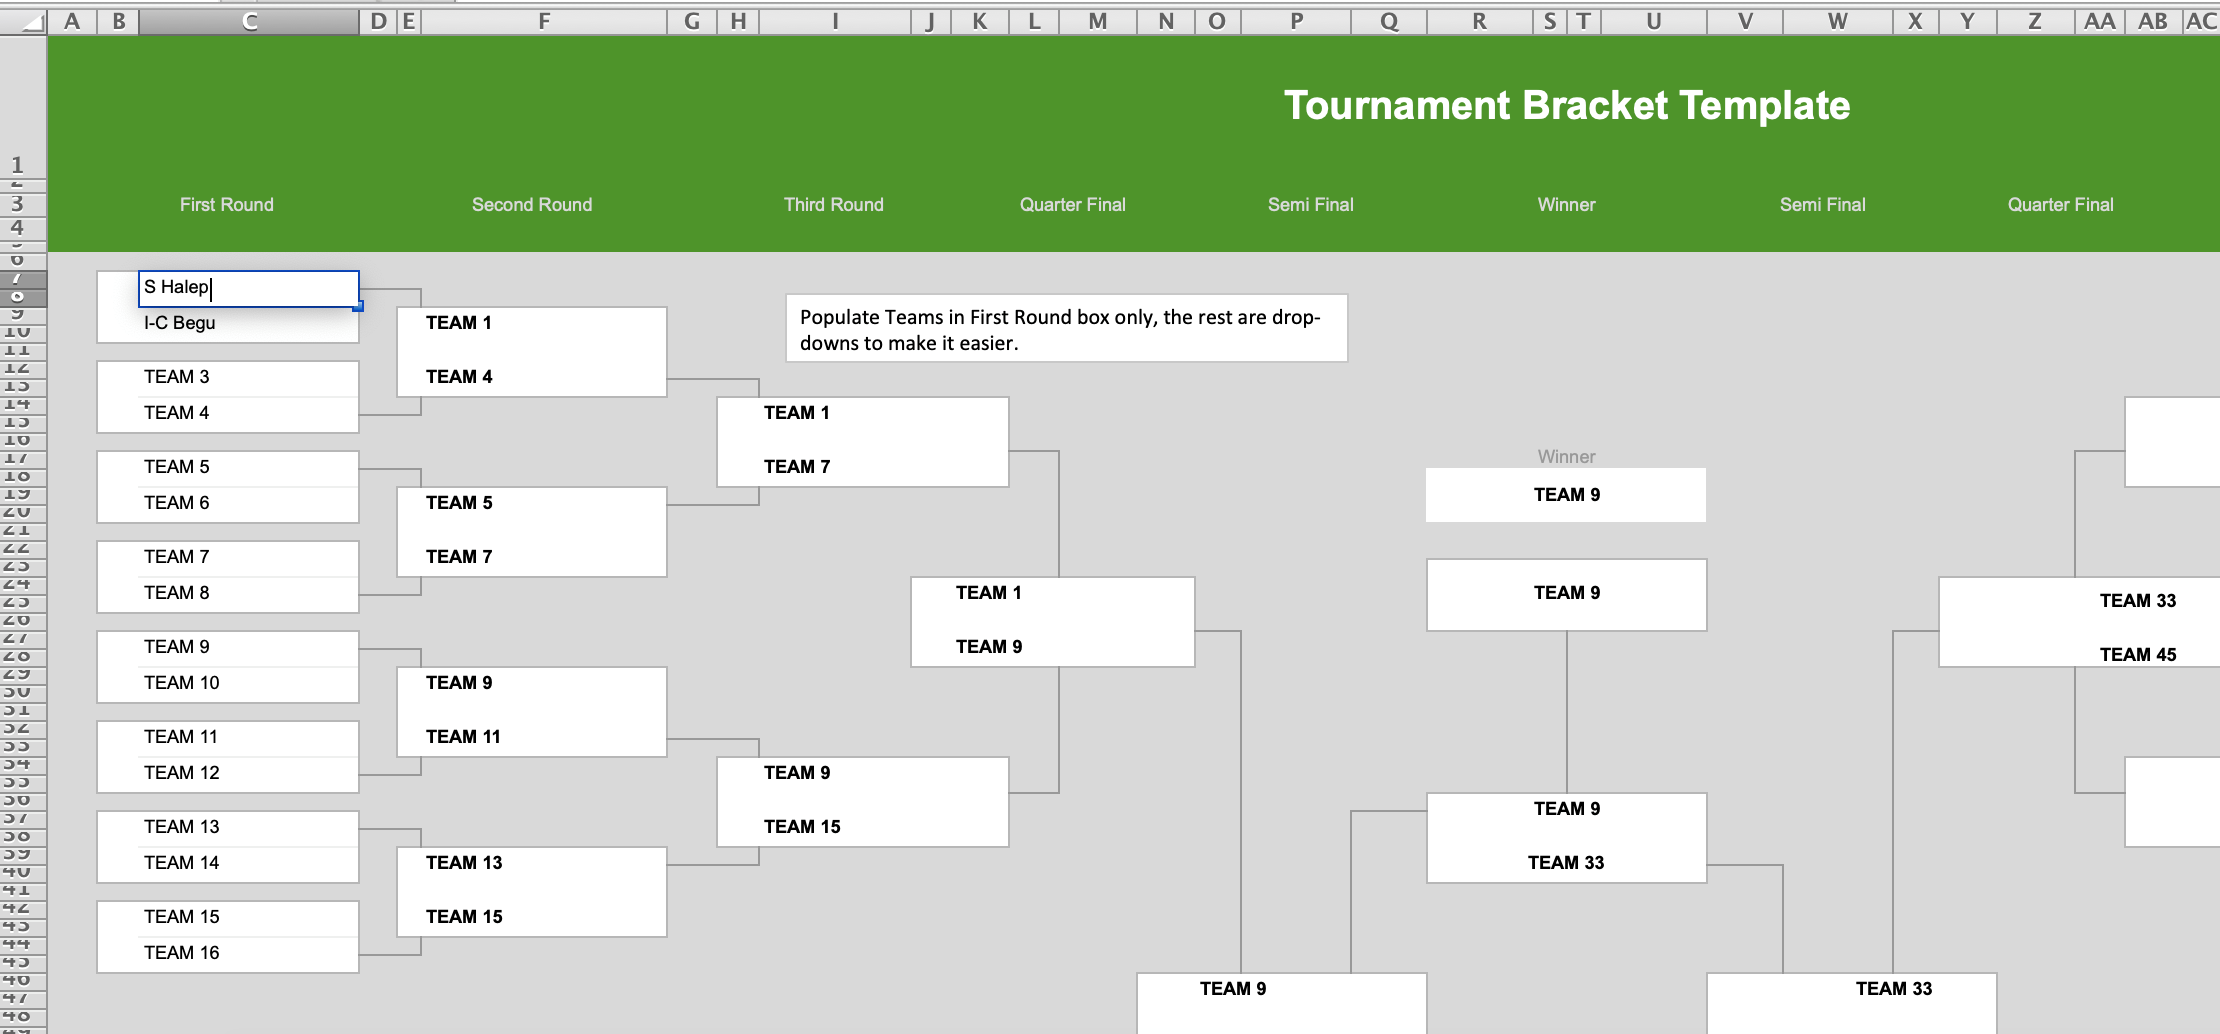
Now let's go to our excel document and open the Bracket
Data Entry tab. Here we will fill out
the names of the players/teams in the first round. To make it easier, I’ve created drop-down
menus in order to select players/teams for all subsequent rounds.
Let’s start entering players/teams. First double-clicking on Team 1 (or single
click on Team 1 then place your cursor in the formula bar). Type or copy/paste the name of the player/team. Continue to do this until you’ve entered all
players/teams for the first round.
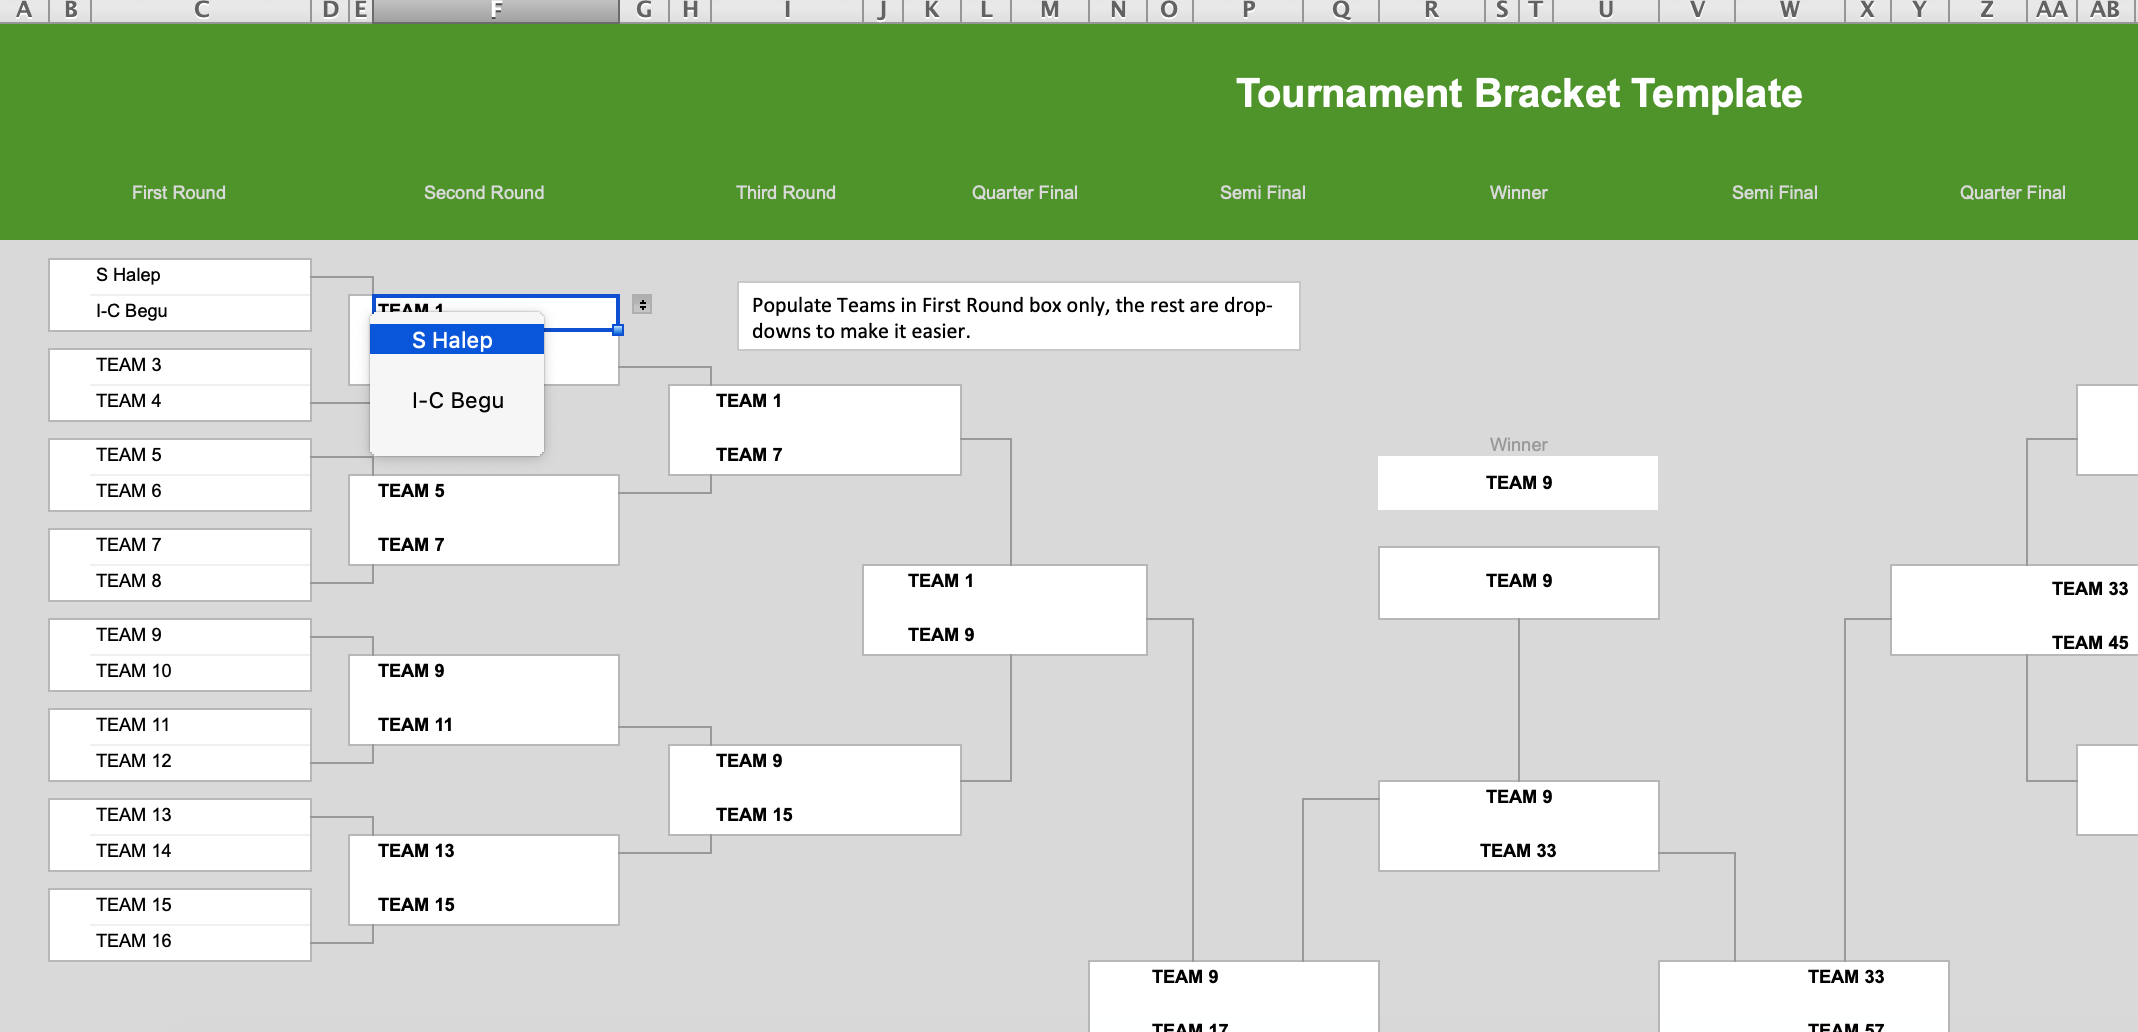
As mentioned, I’ve added drop-down menus to select the
winners of each subsequent round. Let’s
walk through an example. In this case,
the first listing in the second round shows Team 1 and Team 4. If you click on Team 1, you will see a little
down arrow appear in which you have the option to choose Team 1 or Team 2. If you choose Team 2, you are saying that
Team 2 beat Team 1 in the first round.
Okay, so as players/teams win, you will simply choose the winners via these drop-downs. Populating all subsequent rounds will be done via drop-down selections. Please note that as you get into later rounds, the drop-downs require the use of a scroll bar. This was done simply to keep the template and clean as possible.
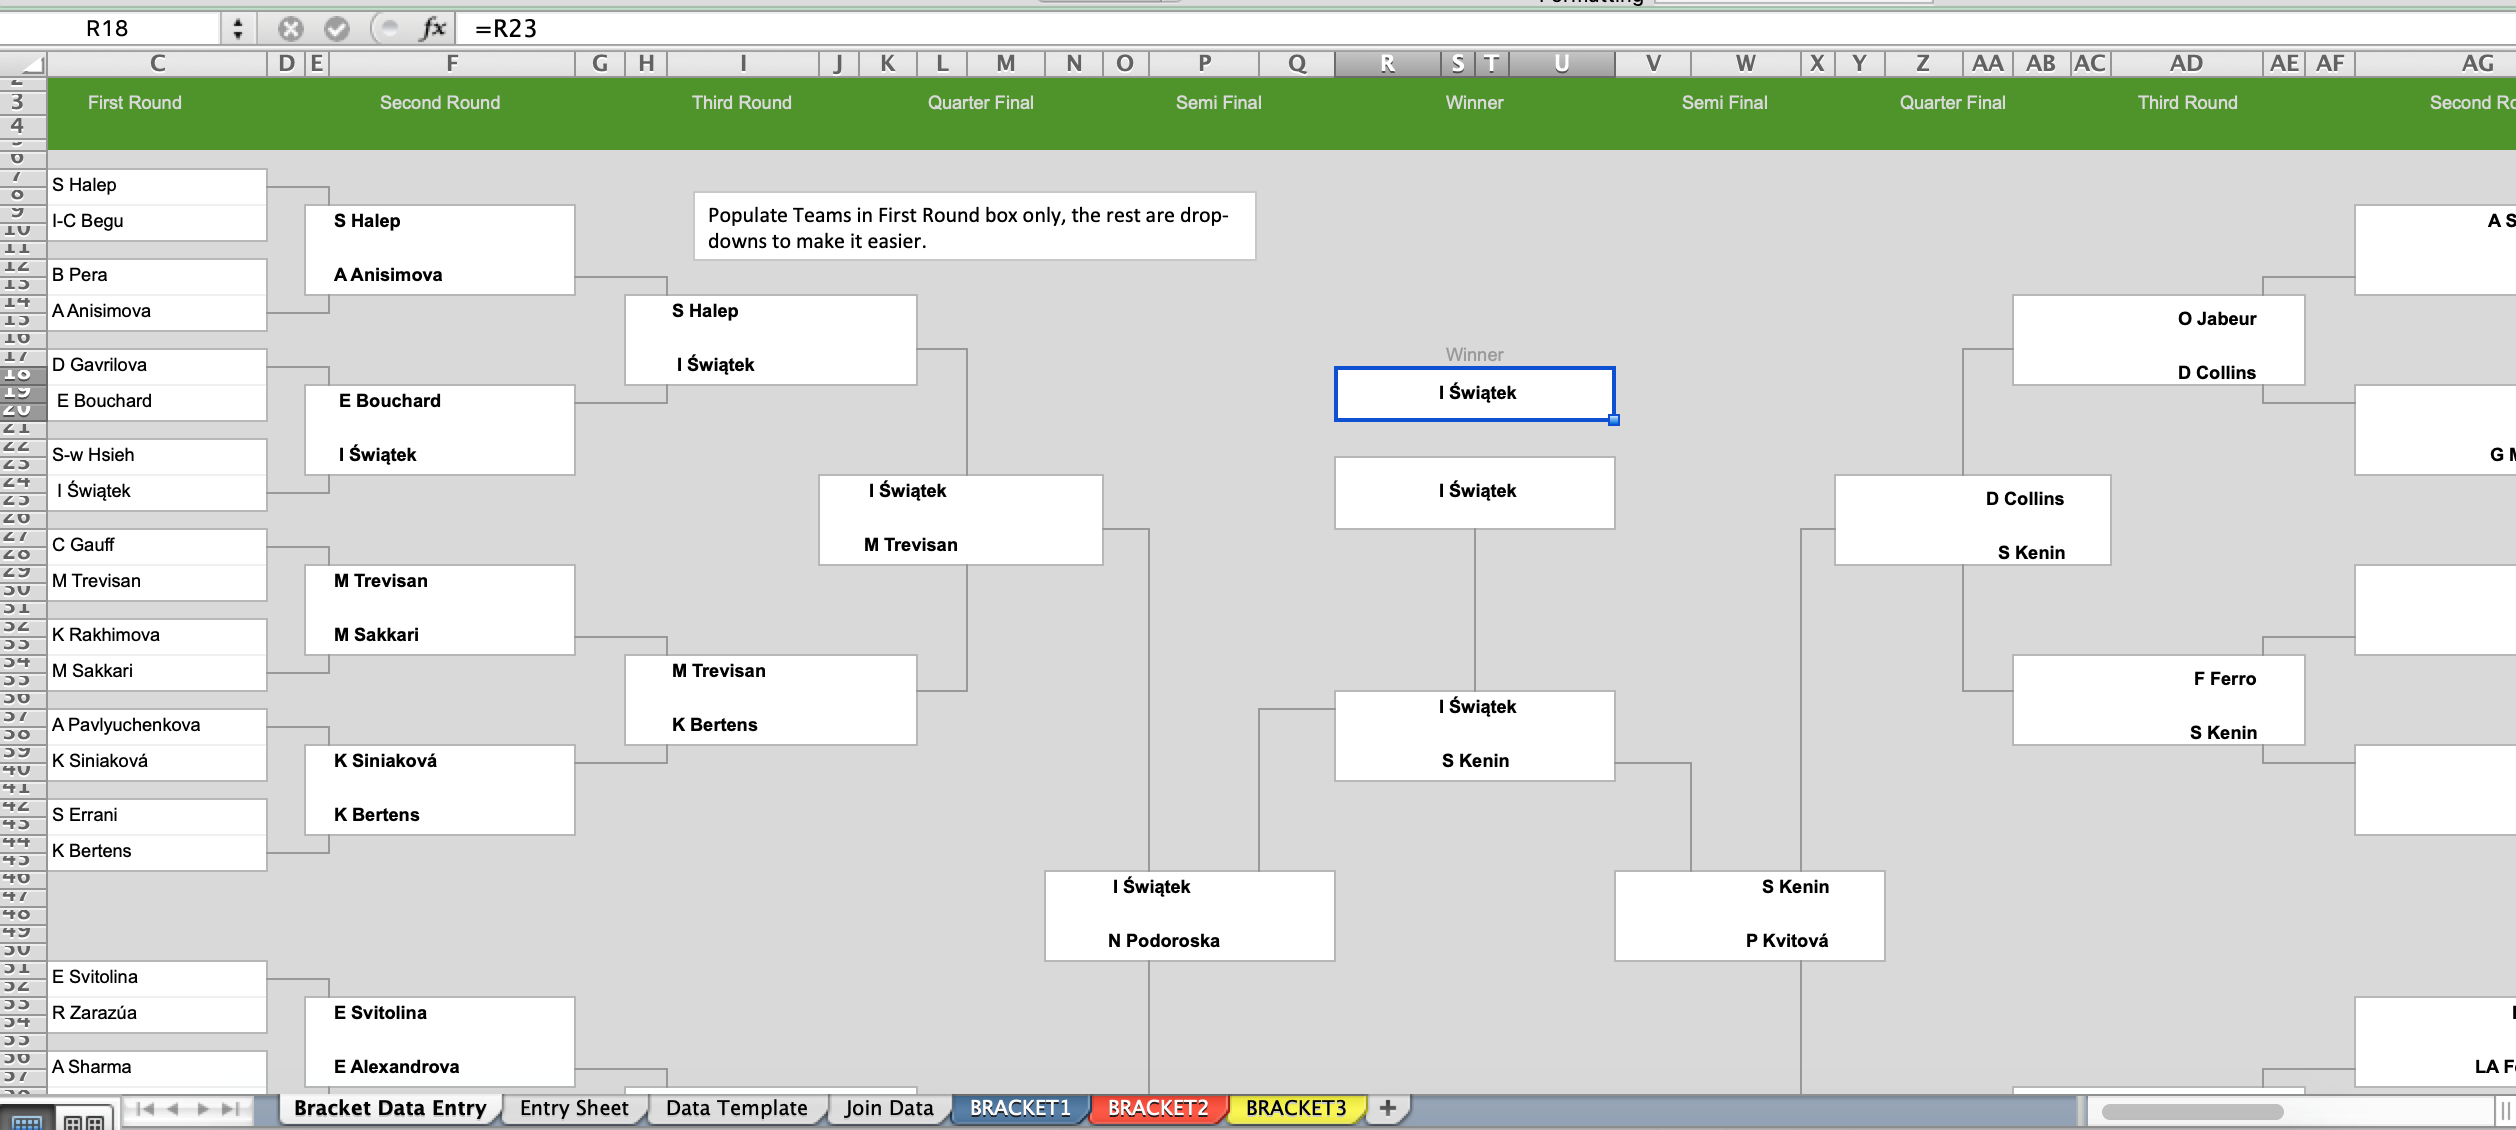
Once finished it should look something like this!
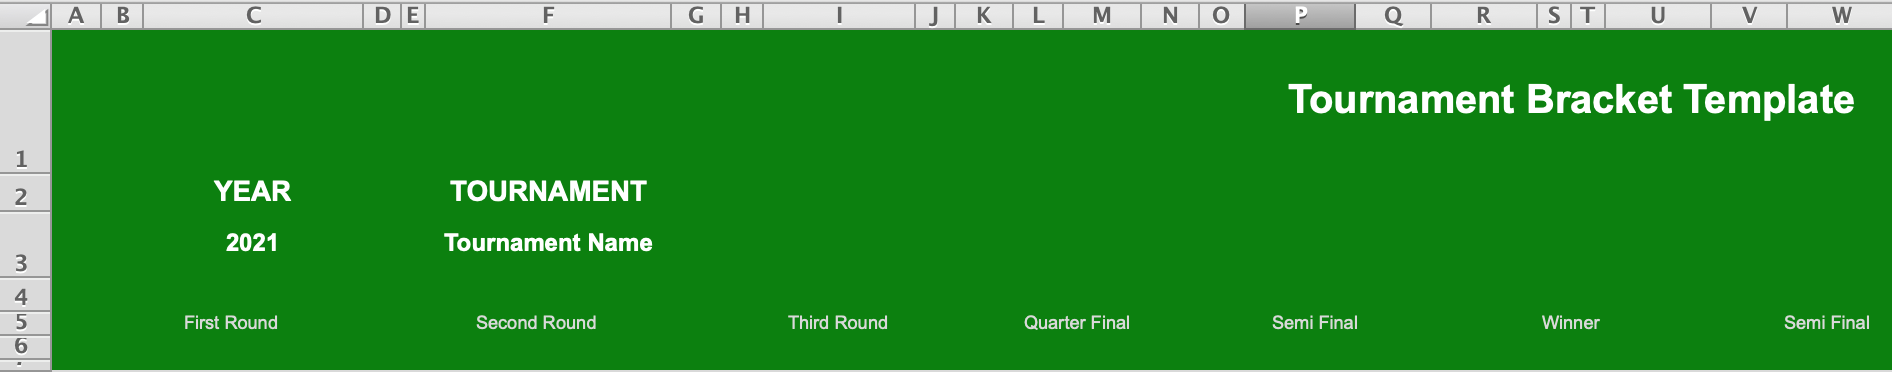
The last thing to update in the Bracket Data Entry tab
is the Year and Tournament in the top left of the sheet.
As mentioned previously, we are going to use Bracket
1, so while in the spreadsheet, let’s move over to Bracket 1 (but go to the
bracket of your choosing). You should
see the dimensions have updated with your new players names.
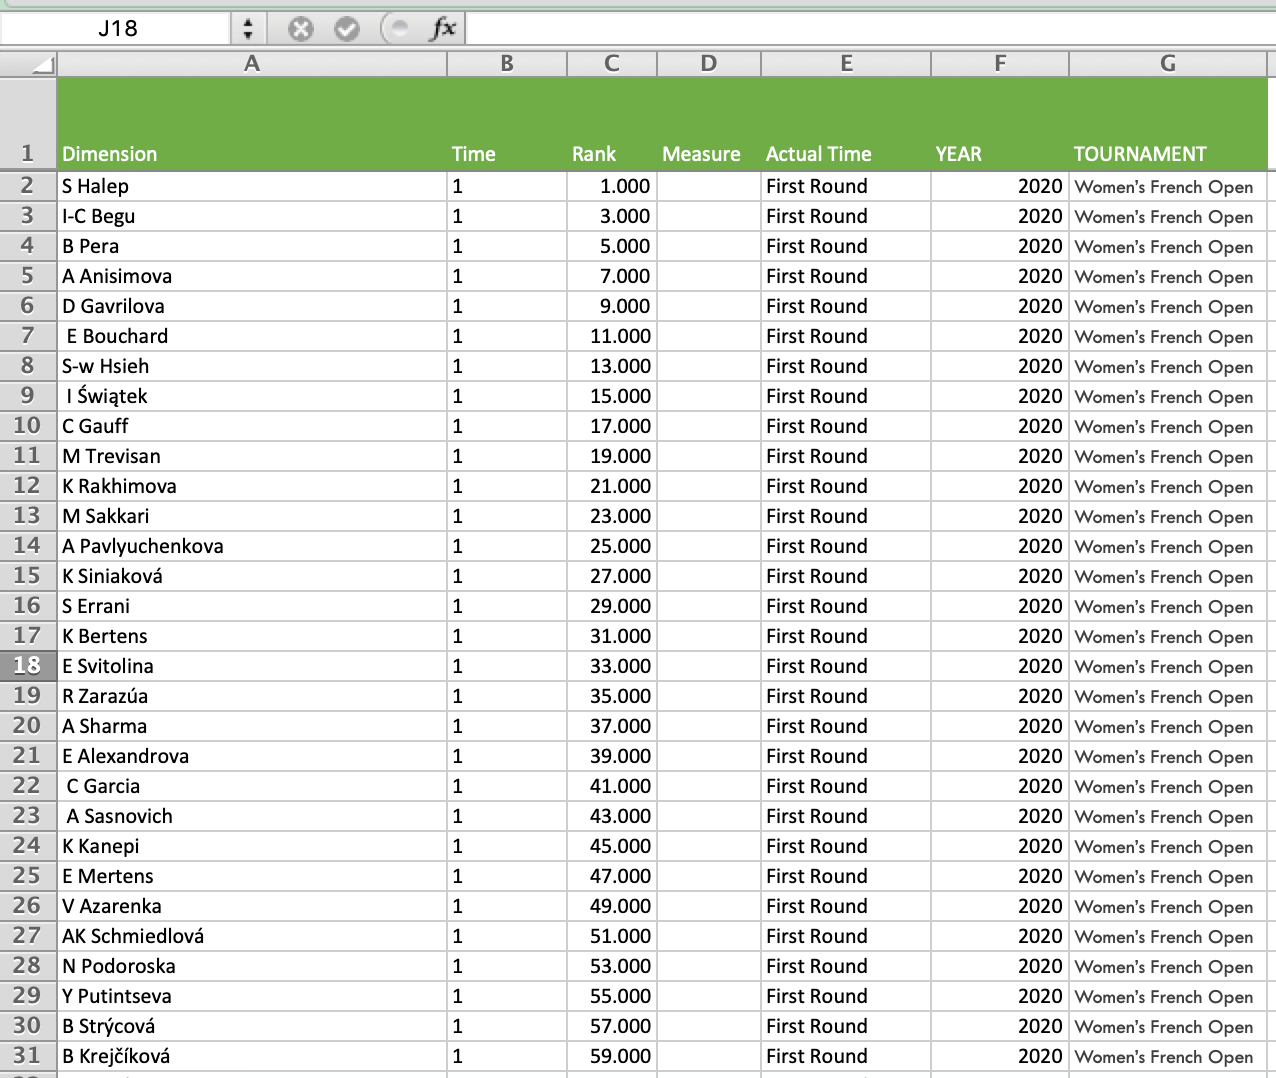
We will revisit the
Time/Rank/Measure and the Actual Round fields at the end of the tutorial. Here’s a snippet of what the data should look
like.
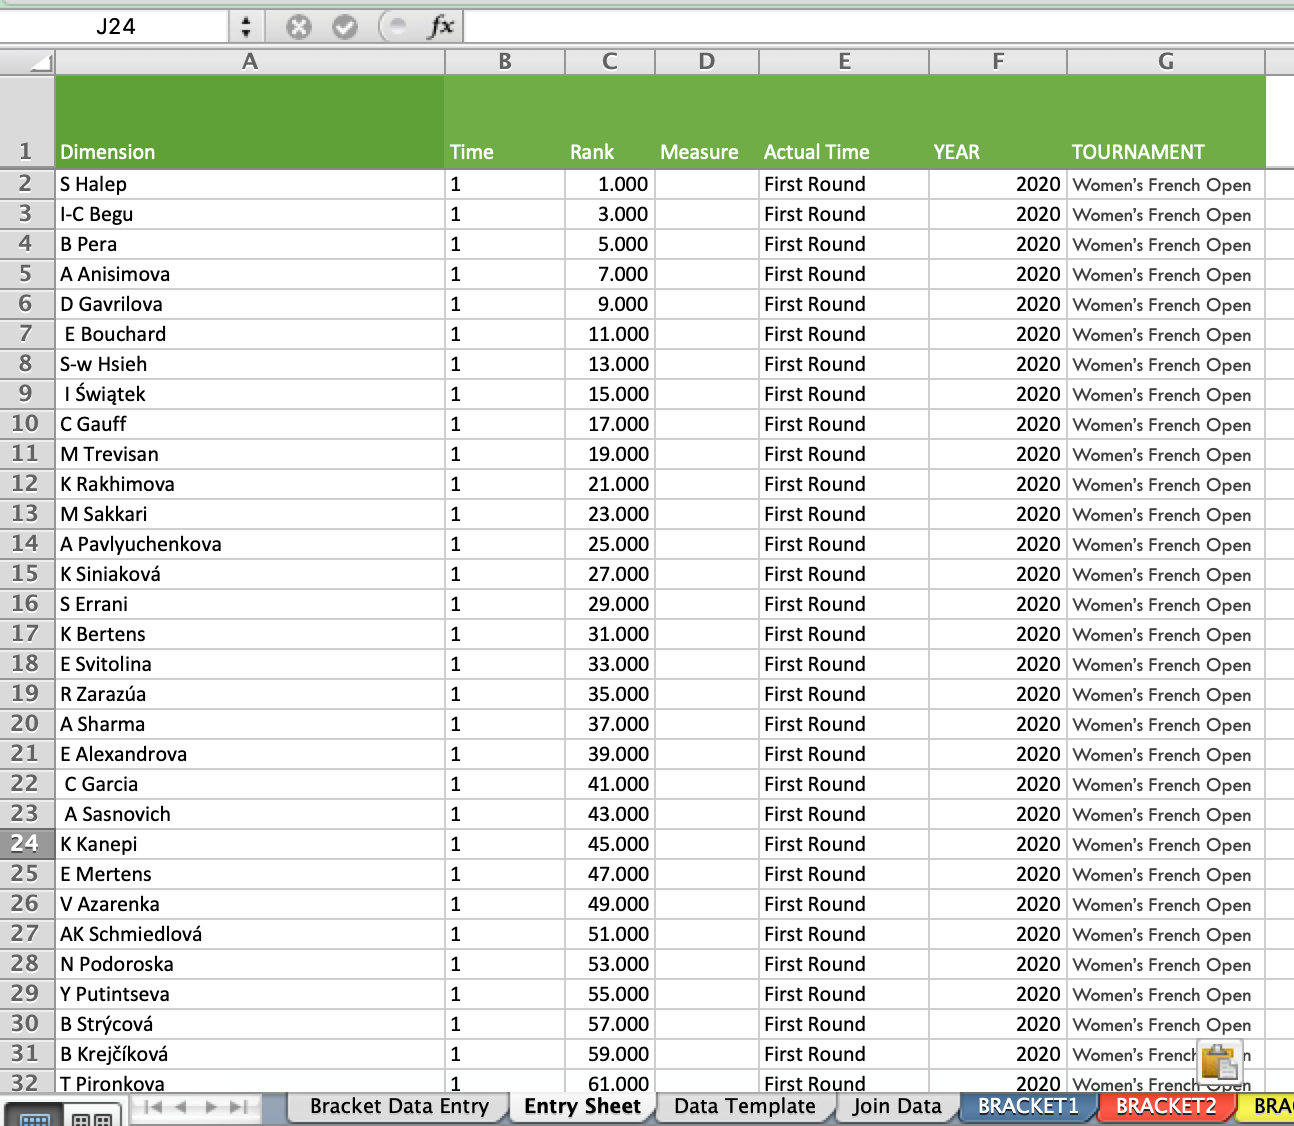
Now go to the Entry Sheet Tab. Clear the data from this sheet (leave the
headers and don't delete rows, just clear the data). Now copy the data from the
bracket we selected (just copy the data, not the headers) and paste into the
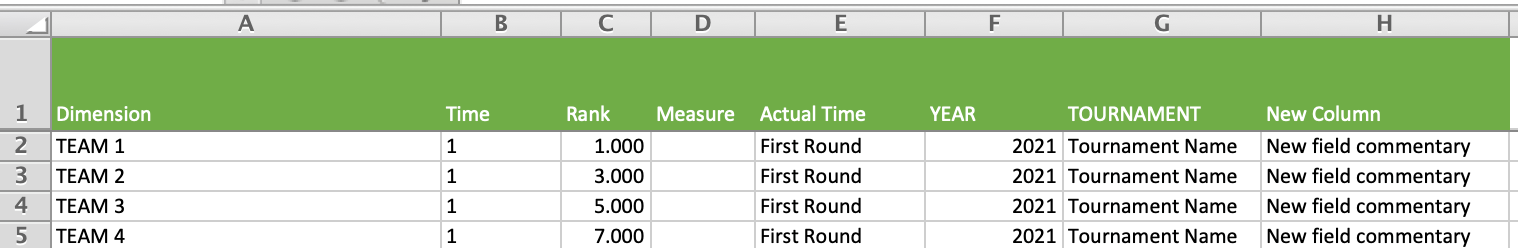
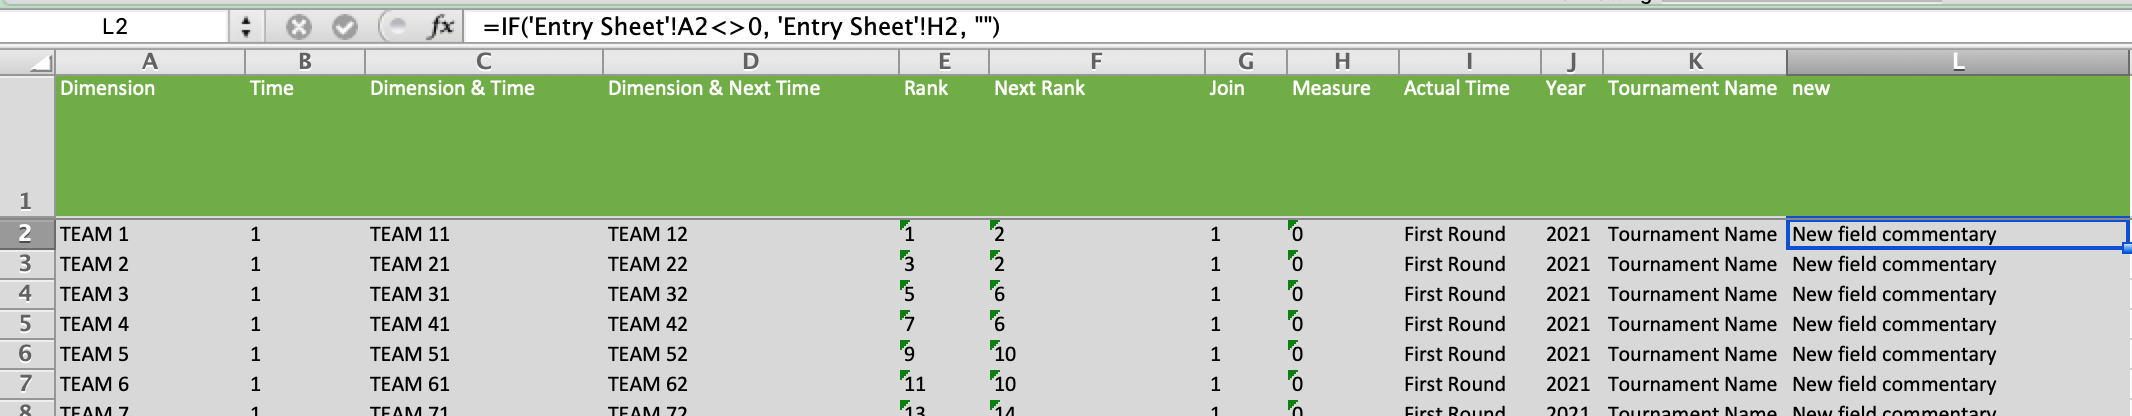
first blank row of the Entry Sheet (below the headers). This sheet feeds into our ‘Data Template’
sheet and then into Tableau. Save the Excel file. Should you wish to add any
further column details to your dataset you can add these in on the entry sheet,
as shown in Kevin’s original blog post. For this to work the data template
sheet feeds from the entry sheet, so you may have to expand the calculation
using:
=IF('Entry Sheet'!A2<>0, 'Entry Sheet'!H2,
"")
The below are printscreens of this in action.
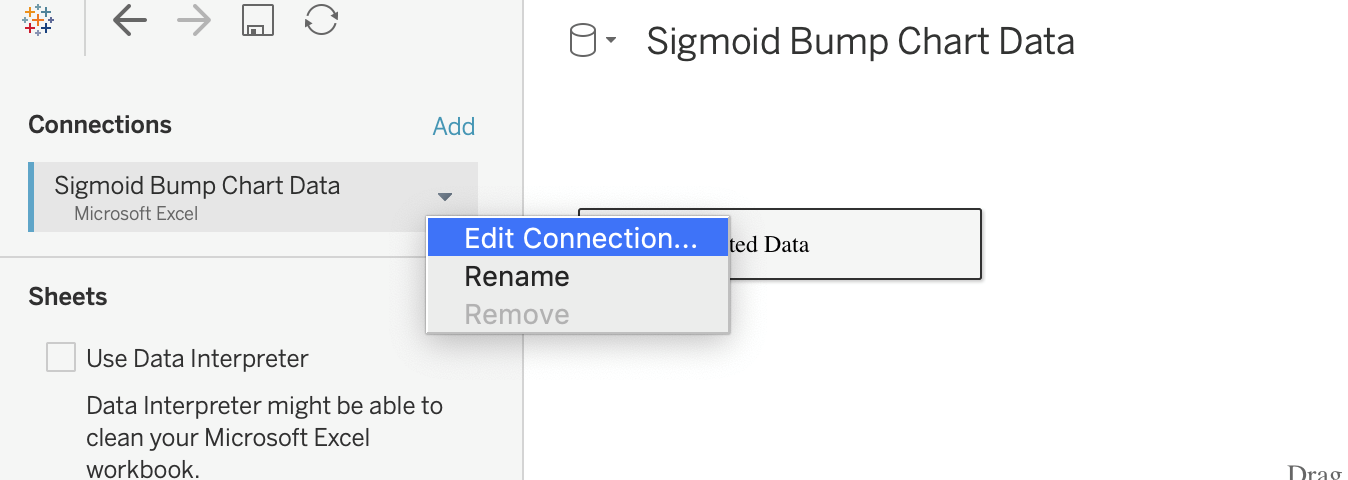
Let’s go back into the Tableau workbook. Click on the data source, choose Edit Connection, and choose this newly created Excel file. Remember that there are three data sources in this template, one for each bracket template. When updating the data source, make sure you are doing it with the proper data source.
It should auto-recognise the new data and refresh
automatically, but if it doesn’t, click the refresh button at the top. Below is an example of what the sample data
looks like, so if your workbook is still showing this information, then you’ll
need to refresh. (You’ll also see an
inner join. This is used for data
densification in order to create the curved brackets).

Click back onto the dashboard and voila, you have your
tournament bracket. Amend the colours and any other formatting until you’re
happy. You can also add “Dimension” (which is the team names) to the label card
(top-aligned) to show the players/teams on screen.
For our Women’s French Open example, I’ve provided a
full workbook with the results that you can check out here.
And that’s all there is to it!!!!!!!
The Data side to it.
Now we’ve built our viz, let’s take a deeper look at
what is really happening within in the data. I alluded earlier to Kevin’s bump
chart doing the legwork for the template mathematically. That’s because the
bracket is theoretically just a bump chart, but rather than each person having
their own distinct position (or ranking), two player lines meet at a singular
point which is identified as each match.
Let’s take an example of 8 teams.
TEAM X Y Round
TEAM 1 1 1 Starting
Rank
TEAM 2 1 3 Starting
Rank
TEAM 3 1 5 Starting
Rank
TEAM 4 1 7 Starting
Rank
TEAM 5 1 9 Starting
Rank
TEAM 6 1 11 Starting
Rank
TEAM 7 1 13 Starting
Rank
TEAM 8 1 15 Starting
Rank
Above is each of the team's starting ranks. X in this
case would refer to round (Time) in the tournament; Y would be the ranking
within the bracket. Team 1 is against Team 2. Team 3 against Team 4 and so on.
When the teams play each other, their ranking position in the bump chart
becomes equal to one another. We therefore find the midpoint for each of the
team’s matches, as below.
TEAM X Y Round
TEAM 1 2 2 First
Round
TEAM 2 2 2 First
Round
TEAM 3 2 6 First
Round
TEAM 4 2 6 First
Round
TEAM 5 2 10 First
Round
TEAM 6 2 10 First
Round
TEAM 7 2 14 First
Round
TEAM 8 2 14 First
Round
Let's say Team 1 beat team 2. Team 3 beat team 4. Team
5 beat team 6 and team 7 beat team 8.
TEAM X Y Round
TEAM 1 3 4 Second
Round
TEAM 3 3 4 Second
Round
TEAM 5 3 12 Second
Round
TEAM 7 3 12 Second
Round
We can repeat this methodology, now team 1 will play
team 3, so the new midpoint between their points is for the Y-coordinate
(Rank) would be 4. Team 5 will play team 6 and the new midpoint between their
Y co-ordinates is 12.
This is the exact structure bracket 3 follows in the
excel template. Bracket 1 and Bracket 2 are similar, but differ slightly
because 32 teams start on the right hand side so their X co-ordinates are
essentially working in the reverse order up until the final at the midpoint.
We can also increase the spacing between some of the brackets by transposing
some of the X (Time) values between after player 16 and player 48, to give a
gap between the sections of 16, as can be seen when comparing Bracket 1 and 2.
This in effect shifts the bottom brackets downward.
This should give a basis to modifying the template to
build another type of bracket, like a 128-player bracket. Note: if you want to
make a 32-player bracket, just filter out the first round.
If you give this a try, I’d love for you to tag me and
let me know your thoughts! If you have
any issues or questions, please feel free to contact me any time on Twitter or
LinkedIn.
Thanks for reading,
CJ
Kevin Flerlage, February 22, 2021
Twitter | LinkedIn | Tableau Public


Hello, thank you for this great how to and supporting templates! I am trying to add labels to my bracket, but can't get them to appear correctly at the appropriate points. I can get a formula to work on one half of the bracket but doesn't work on the other (or vice versa). Do you have any tips, tricks or formula help you can provide to get working correctly?
ReplyDeleteAre you able to share an example? Feel free to email me at flerlagek@gmail.com.
Delete