
The Power of Place: Unleashing Census Data in Your Tableau Analytics

Kevin and I are incredibly excited to have Sarah Battersby join us today as for another guest blog (if she keeps writing for us, we may have to make her an honorary Flerlage Twin!!). Sarah has been a member of Tableau Research since 2014. Her primary area of focus is cartography, with an emphasis on cognition. Her work is focused on helping everyone to visualize and use spatial information more effectively—without the need for an advanced degree in geospatial. Sarah holds a PhD in GIScience from the University of California at Santa Barbara. She is a member of the International Cartographic Association Commission on Map Projections, and is a past President of the Cartography and Geographic Information Society (CaGIS). And, perhaps her greatest skill—she can identify Kevin and Ken correctly 50% of the time! Sarah can be contacted at sbattersby@tableau.com or on Twitter @mapsOverlord.
Problem: You have a ton of
US data—and it has a spatial aspect to it. It’s easy to map your data in
Tableau, but you want to know more detail about the geographic locations where you have lots of data. Maybe you want to
know about the total number of people and their race or socioeconomic status?
Or the median income or age? Or how about level of education? The US Census
tracks all sorts of social, economic, housing, and demographic details about
the US population, but it can be hard to collect it all and get it into
Tableau. Especially if you want the data at fine detail (e.g., Census Tract)
and for large areas (e.g., more than one state).
Let’s fix this
problem!
In this post, I will discuss methods for collecting Census attributes and geographies to use in Tableau.
We’re going to get into a bunch of different technologies along the way, but
don’t let this stress you out. In most cases, you won’t need all of this. My
goal is simply to give you everything you might
possibly need in order to collect and map this data.
Collecting
Attributes
You
can always download attributes as individual tables from the census website but, if you want
a lot of data, it might be easier to use the Census API and some code to
automate the data collection. The Census API provides a
programmatic method for accessing a number of their data products. It lets you
directly tap into datasets by specifying the product, the geography, and the
attributes. When you use Python (or the language of your choice) to automate
your calls to the API, you can collect large quantities of data, combine it
together, and write it to an output file (e.g., csv file) in one fell swoop. To
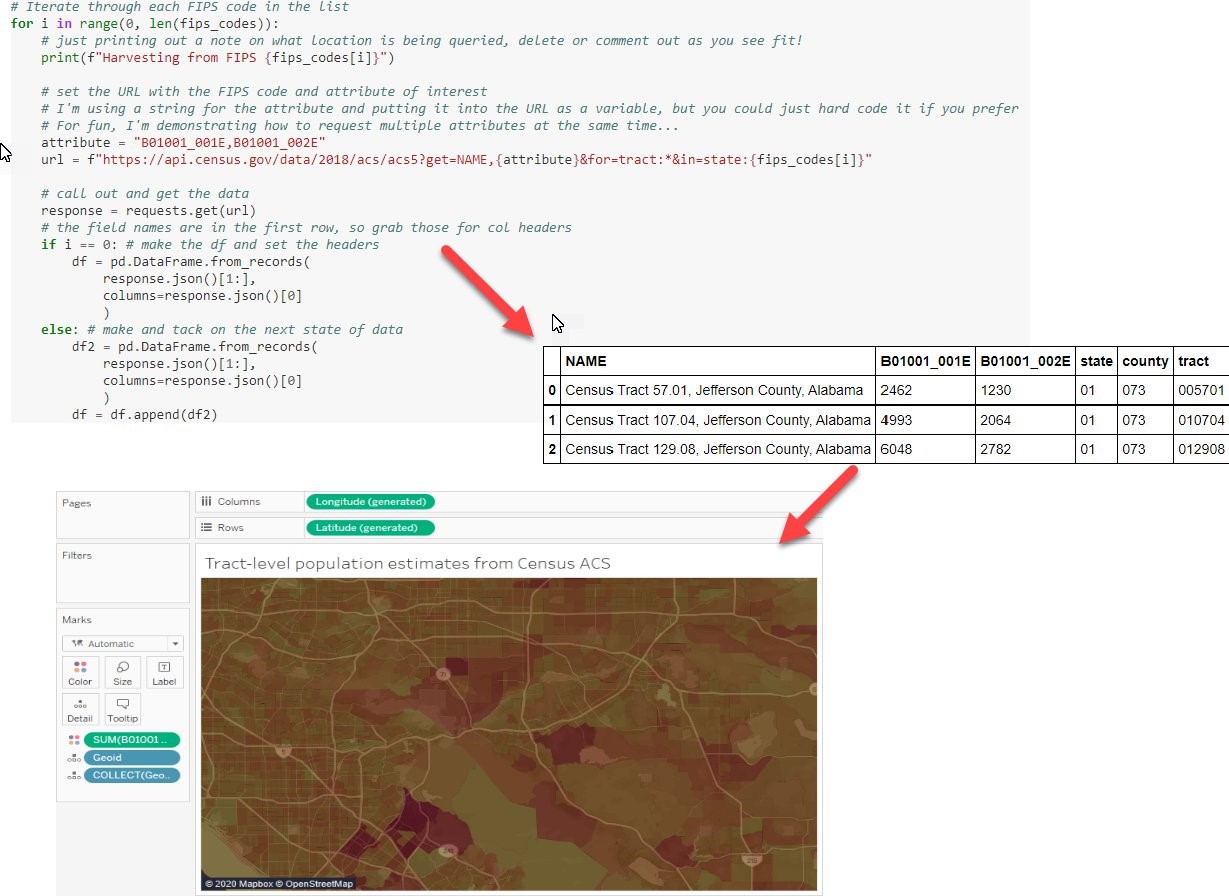
that end, I’ve written a Jupyter
Notebook (basically
an interactive file that contains code, images, and narrative text) which
contains all the code as well as detailed descriptions of what we are doing at
each step. The basic process that the notebook takes is to iterate through
calls to the API until we collect everything we need, after which we write the
data to a csv file, which we’ll use in Tableau.
Mapping
State/County in Tableau
If
you’ve run through the Jupyter notebook, then you now have all your attributes
in a csv file. If those attributes are at the county or state level,
you can map those directly in Tableau using the built-in geocoding. We won’t
need any fancy spatial files or anything like that.
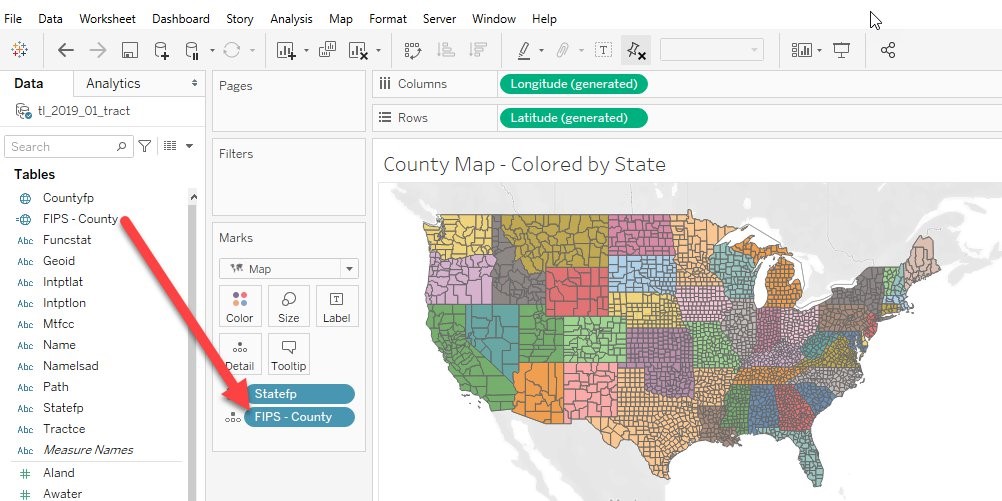
If
you have states, then all you need is the state name. Counties, on the other
hand, can be mapped with a county name/state name
combination OR with the 5-digit FIPS code. This code is just a combination of the 2-digit state FIPS code (e.g., 01
is the code for Alabama) and the 3-digit county FIPS code (e.g., 001 in Alabama
is Autauga County). You should have all of this information with the data you
downloaded. The trick is to make sure the FIPS codes are defined as strings (or else leading zeroes
will be truncated), and then make sure you have them
combined into a single 5 digit FIPS code (e.g., 01001
is the 5-digit code for Autauga County, AL).
Once this is in Tableau, just be sure to make sure the field’s
geographic role is set to “County”.
Different Levels
of Detail
If
you are mapping at another level of detail (e.g., census block, block group,
tract, etc.) you will need to download the spatial boundary files from the
Census. Fortunately, they’ve made all of this data available online. If you
just need a few files, it’s easy to download them from the Cartographic
Boundary Files
page. There will often be different files for different years (census tracts,
for example, change with each decennial census) so make sure the year you
download aligns with the year of your data.
Another
thing to consider is the level of spatial detail (generalization) of the
spatial file. For instance, you can download US
Counties as a 1:500k, 1:5m, or 1:20m file.
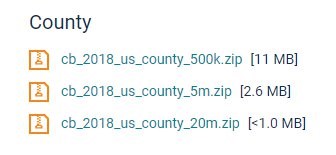
The more generalized, or simplified, the geographies, the smaller
the file—the 1:20m file is less than 1MB in size, while the less
generalized/more detailed file at 1:500k is
11MB. Tableau will have to work harder to process the more detailed
files, so choose the one that meets the level of detail you need in your
visualization.
Using the Census
FTP Site
If
you need a lot of spatial files—for instance, all Census tracts for 10
different states— you can use the Census FTP site to collect all of the files
you need at once, rather than downloading them individually. Here’s how:
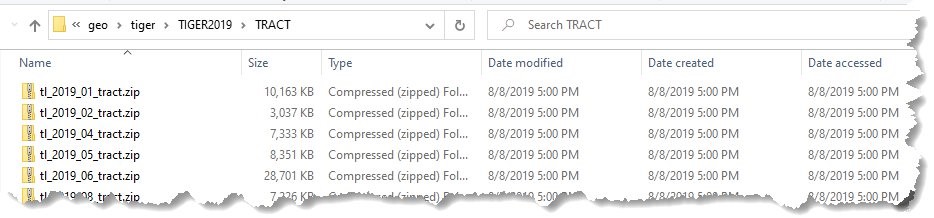
Connect to the Census FTP server and find the data. The 2019 TIGER
data can all be found here. For
Census tracts (TIGER 2019 data), I use my Windows file explorer to add a
network location of ftp://ftp2.census.gov/geo/tiger/TIGER2019/TRACT/
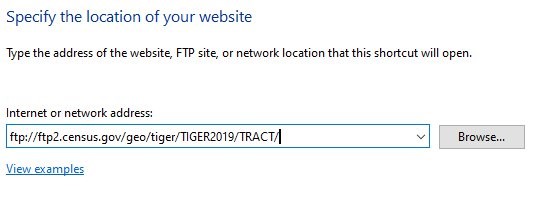
This
takes me to a directory with zip files for the tracts for each state. I can
select all of the states that I want and copy all of the files I need to my
local drive. You will need to know the state FIPS codes as the end of each file
contains that code, rather than the state name (you can find a list of FIPS
codes here).
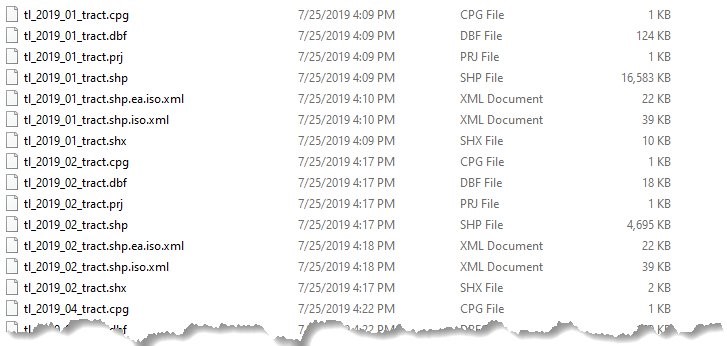
With the zip files on your local drive, select them all and
unzip them. I like 7-Zip
since it lets me easily unzip lots of files
at once, but you can use whatever software you like, including the one that is built into Windows. Whatever you use, you’ll most likely end up with a separate folder for the geometry for each
unzipped file. To make your life easier, it’s good to move all of the files
into the same parent folder (that makes combining/unioning them easy in Tableau
or GIS).
I use Windows, so I will tell you how I do this from a Windows command line. I’m sure you can do the same on a Mac and I’m
sure that Mac users will tell me how infinitely better that method is :) All I
can say is that if you use a Mac, just use Google to figure out how to move a
bunch of files easily.
I unzipped all of my data into a single directory. Then, using the command line, I first change to that directory.
Next, I use a simple statement to recursively walk
through each folder in the directory and move the files to a new directory
located at C:\temp\Census - tiger\tracts_all\.
FOR /R
".\tracts" %i IN (*) DO MOVE "%i" "C:\temp\Census -
tiger\tracts_all"
We
now have a nice, single location with every freakin’ part of every freakin’
shapefile for Census tracts in every freakin’ state. That’s 357
files!
Note: If you’ve
used the Jupyter notebook then you may already be adept with Python. In that
case, then feel free to do the above in Python if you wish.
Combining the
Files in Tableau
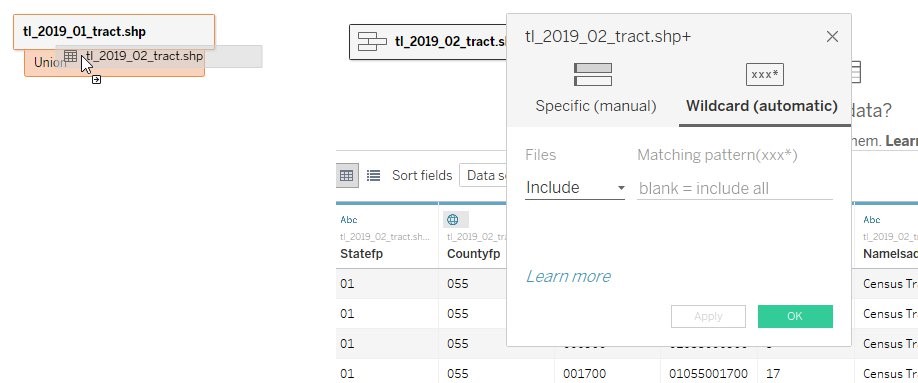
To combine all of these files together, you can add all of these shapefiles in Tableau and union
them together using Spatial
union in Tableau,
which is new to 2020.3. Just create a wildcard union then
create a hyper extract. It’s important to note
that these files can be quite big when you’re
working with small geographies over a large space—for instance, an extract containing all Census tracts for
all US states is a 200MB file!).
Combing the Files
in GIS
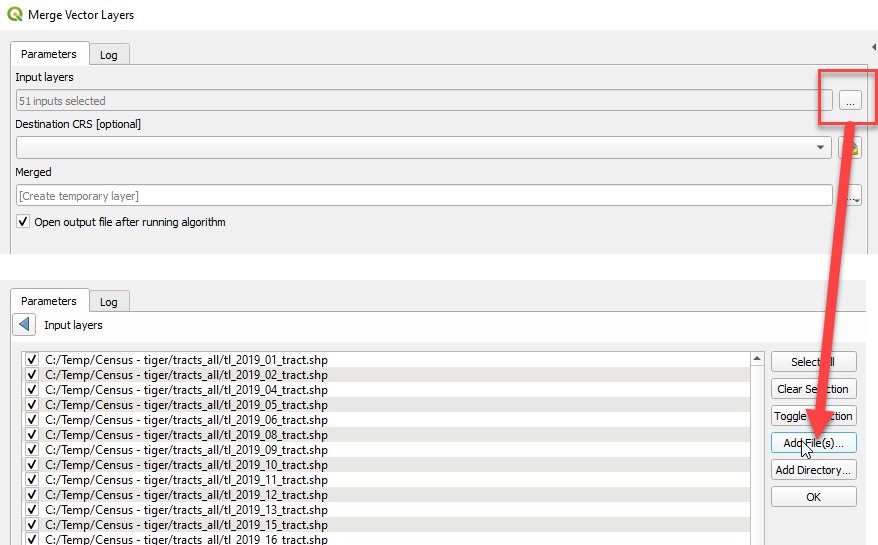
If
you’re still on a pre-2020.3 version of Tableau, then you can use a GIS, such
as the free/open source software QGIS, to union the files together. Just use
the Vector Data Management tools to merge vector layers. You can click on three
dots next to ‘Input Layers’ and add all of the *.shp files in the directory
where you unzipped your shapefiles.
Small
geometries come in as fairly detailed polygons—and as really big files so you may wish to simplify them a bit. A
great tool for simplifying the geometry is the online software, MapShaper.
Once you have your geometries collected (and combined together, if needed) you
can use MapShaper to quickly and easily simplify them.
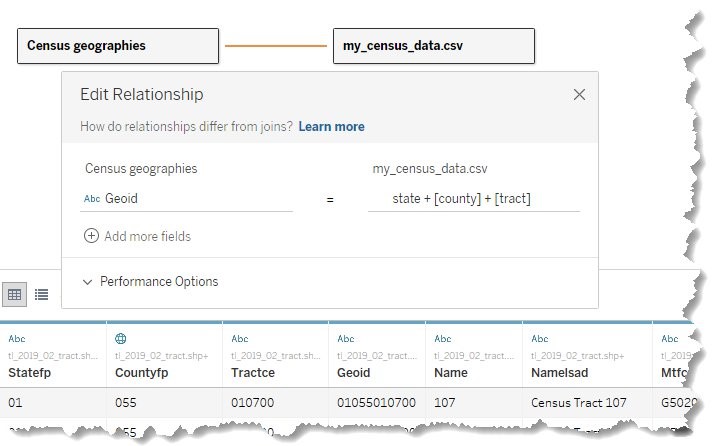
So,
we now have all of our attributes and we’ve combined and simplified all of our
geographies. The only thing left to do is join them together in Tableau. Once
we’ve done that, we’re ready to map away!!
Wrap-Up
Okay,
I know that I just threw a lot at you—we talked about Python, Jupyter
notebooks, APIs, FTP sites, command line, and GIS tools. Fortunately, it’s
likely that you won’t have to use all of this every time you need to collect
census attributes. For instance, smaller projects may only require the Python
code and Tableau. However, if and when you find yourself in a situation where
you need lots of different attributes for lots of different geographies, I hope
that this post acts as a helpful guide for the tools and steps you’ll need to
take to go from idea to amazing Tableau map! Thanks for reading!
Sarah Battersby
March 8, 2021


Hello Ken, can we get spatial files of another countries?
ReplyDeleteThis blog is focused on getting info from the US Census website, so the above is focused on the United States. However, other countries likely have similar sites you can use to obtain spatial data.
Delete