
QGIS for Tableau Users # 2: Bending Text Files to Your Will!

We’re once again excited to have Sarah Battersby joining us for the second in her series about QGIS for Tableau users. Sarah has been a member of Tableau Research since 2014. Her primary area of focus is cartography, with an emphasis on cognition. Her work is focused on helping everyone to visualize and use spatial information more effectively—without the need for an advanced degree in geospatial. Sarah holds a PhD in GIScience from the University of California at Santa Barbara. She is a member of the International Cartographic Association Commission on Map Projections, and is a Past President of the Cartography and Geographic Information Society (CaGIS). Sarah can be contacted at sbattersby@tableau.com or on Twitter @mapsOverlord.
In the previous post of the QGIS for Tableau users series (the first!), I walked through the basics of QGIS—download, open some data, look at attributes, and export spatial and CSV files. Now we’re going to get down to the serious business of using QGIS to bend the data to our will! This post and the ones that will follow dive into the functions that I use a bunch in QGIS to prep my data for Tableau—or to do things that are just faster to do here than Tableau. Each post will cover a set of functions with description of the when, why, and how-to.
Today we’ll start with manipulations that I often perform on TEXT files (typically CSVs in my case). This posts covers:
· 1) Exporting
tables of Well Known Text to spatial
files
·
2) Converting
points in projected coordinate systems to latitude and longitude
·
3) Convert
lists of points into lines or polygons
The Real Basics (Your Series Disclaimer
Message!)
This post goes into how-to for specific tasks. If you
need to take a step back and see where to even start (setting up QGIS, basics
of adding and working with files, etc.) please refer back to the introductory post.
There
are also several great QGIS tutorials that will provide a broader (non-Tableau
focused) introduction to the power of the software, such as QGIS Tutorials and Tips.
Now,
we’ll get back to our regularly scheduled blog post message about awesome stuff
you can do with QGIS!
Well Known Text to Spatial File
Why:
Sometimes you have geometry in a format that Tableau
doesn’t recognize, like Well
Known Text (WKT). For the uninitiated, Well Known Text is a sort of markup
language used to describe types of vector geometries. WKT can be used to
represent single points, lines (linestrings), polygons, as well as groupings of
these different objects. For example, LINESTRING (1 8, 15 3, 20 2)
represents a line string that is drawn from coordinates (1, 8) to (15, 3) then
connected to (20, 2).
Fortunately,
we can use QGIS to easily convert WKT into a spatial file so that we can map it
in Tableau.
Note:
While this technique is useful for things other than WKT, I tend to use it
primarily to convert WKT.
When:
You
have WKT in your text file. This might have come from downloading data
from an open data portal where there wasn’t an option for a spatial
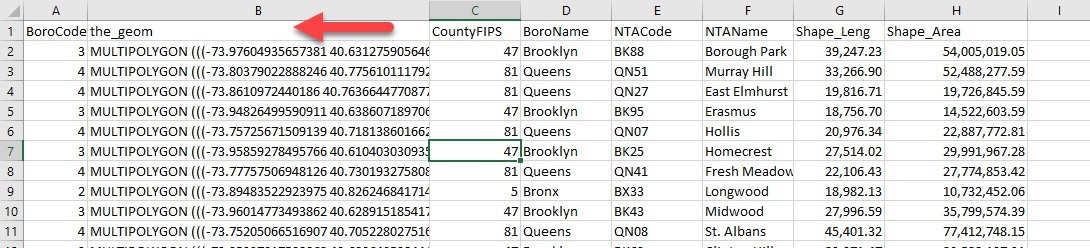
file. Here is an example of neighborhood polygons that I downloaded from
the NY
City Open Data Portal—notice that column B has a gnarly text string named
‘the_geom’, which uses WKT.
When you don’t really need it:
If you’re just working with point data and there are
already fields for latitude and longitude, you don’t need to use QGIS. If
you have projected x and y coordinates, you can also use those directly in
Tableau with the MakePoint(x, y, srid) function
(available in Tableau 2019.3+).
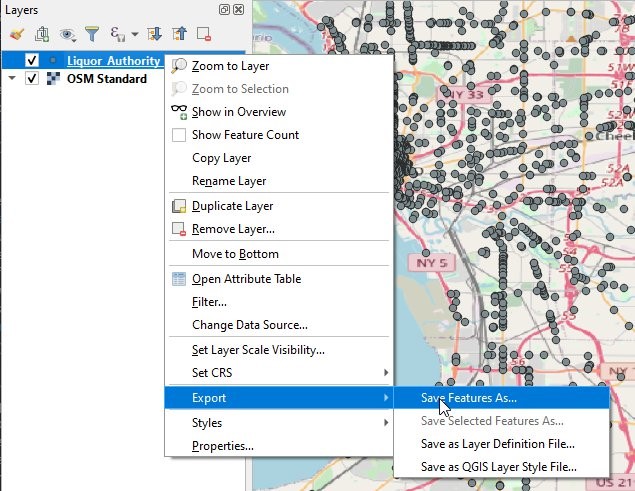
How:
After you add your file to QGIS, if you can see the points, lines, and/or
polygons from the files that you’ve added, you can export them as a spatial
file with a simple right click... Just select Export →
Save Features As... and save the features in the format of preference. I
generally use Esri Shapefiles, because that’s what I learned way back in the
day when I started working with GIS and I know how they work and how to fix
them, but use whatever you’re most comfortable with (Shapefile, GeoJSON, KML,
etc.) so long as it’s a format
that Tableau is able to read.
Convert Points in Projected Coordinate
Systems into Latitude and Longitude
Why and when:
This is a bit of an edge case, but sometimes you have a
file with coordinates in a non-latitude and longitude coordinate system (e.g.,
the local State Plane or UTM coordinates). You can work with these
directly in Tableau just fine—you just need to use the MakePoint functionality (2019.3+) to convert them to a point
geometry. BUT...what if you really need the latitude and longitude for the
points as well? This came up in a question someone asked me a few weeks ago—the
data would map just fine using the projected coordinates after using MakePoint,
BUT, in order to link the points to an external Google Streetview web page,
they needed the latitude and longitude associated with each location. That
wasn’t in the original file.
When you don’t really need it:
If all you need is geometry to show up in Tableau, just make your life easy and
use MakePoint functionality (2019.3+)
How:
We can calculate latitude and longitude from projected
coordinates easily in QGIS so long as you know the coordinate system used for the
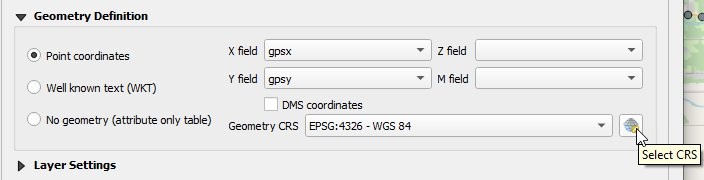
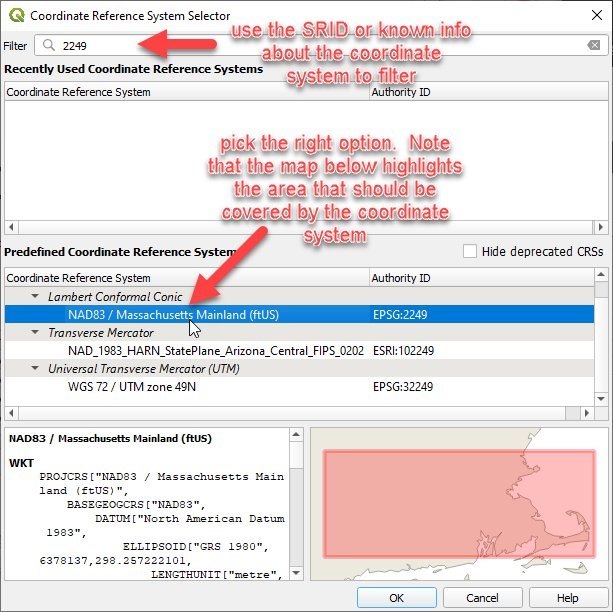
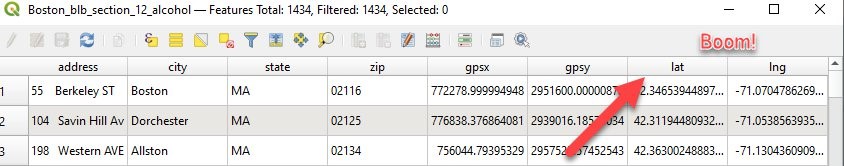
original data. Here’s a quick example using a text file from the City of Boston Licensing
Board for their Section 12 Alcohol Licenses. The dataset’s
Data Dictionary notes that the GPSX and GPSY coordinates use Massachusetts State Plane Coordinate System
(2249). When adding the file into QGIS we’ll use that information in
the Geometry Definition to get it all set up... just like this:
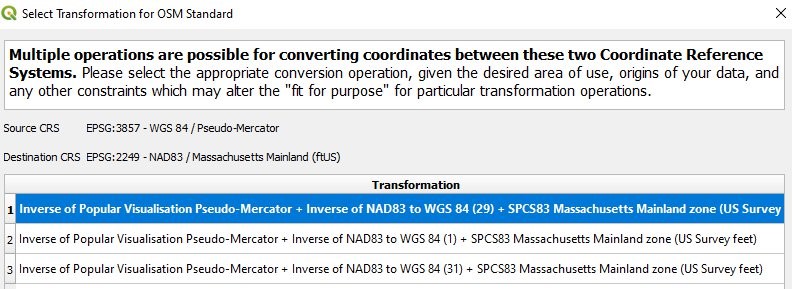
When
you’re adding a file, you may get a warning about needing to select the
Transformation method. If so, I normally just go with the default.
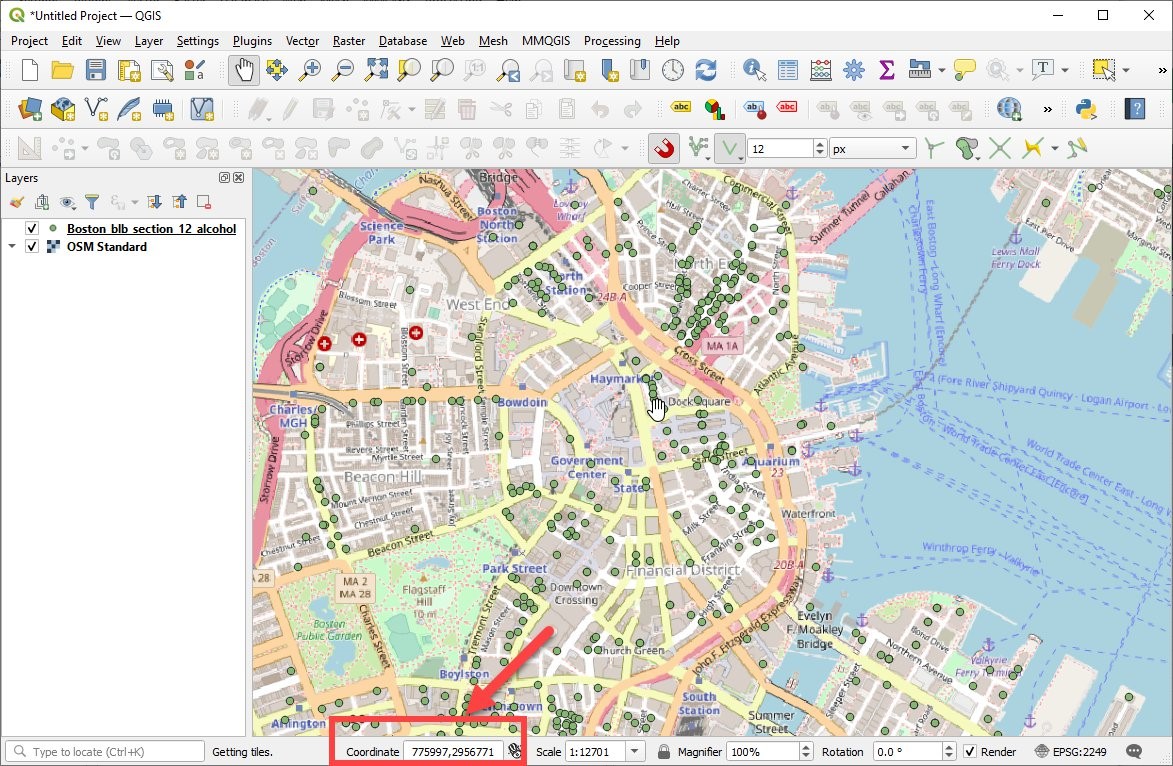
Once
you add in a base map, you should see something like this…note that the
coordinates for the map (highlighted in the image below) are clearly not
latitude and longitude.
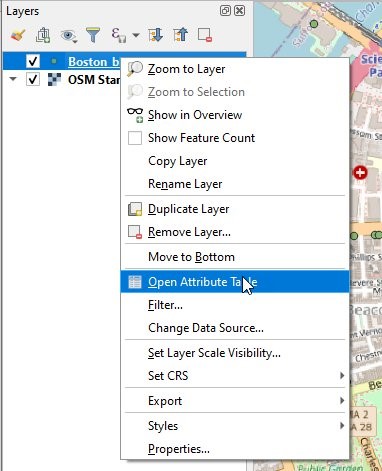
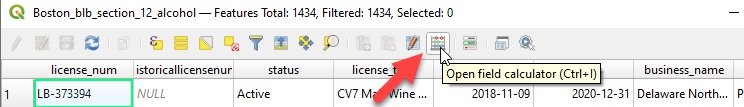
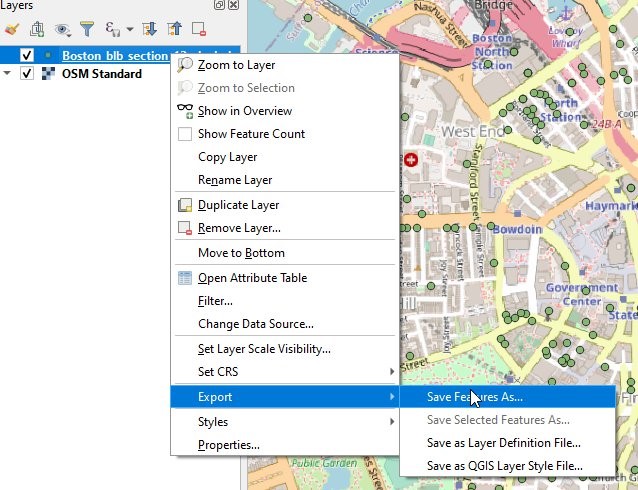
Right
click on the layer name and open the Attribute table
We
want to calculate a new field using the Field Calculator:
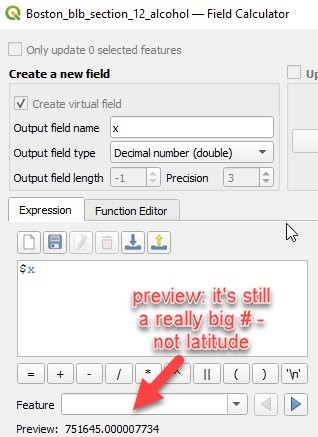
Since
our source is a CSV, we can only create a virtual field, but that’s okay,
because we’ll eventually save this to a new CSV, which will allow us to keep
the new calculations (Note: I covered calculations in the first post if you
need to go back for a refresher). The short story is that you name your
field, pick the output type, and then use an expression to calculate what you
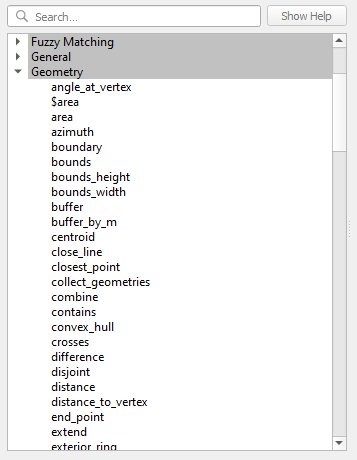
want... in this case, we want the x coordinate, so can use $x as our expression. I have this one burned in my brain,
but you can always find it—and many other fun options—in the list of
calculation terms under Geometry (see image below—so many options that I didn’t
scroll down to show you $x specifically).
Note: If you’re having trouble with your
field calculations, try the QGIS field calculator help files
But...as
you can see above, we have a problem. The previewed output is clearly wrong as
it’s huge! That’s because its using the Massachusetts State Plane Coordinate
System! So, maybe $x doesn’t quite solve our problem in this case. So, how
do we transform the value from the X and Y coordinates in Massachusetts State
Plane Coordinate System into Latitude and Longitude? We just have to use
the transform function. So,
let’s try a new calculation:
x(
transform( $geometry, 'EPSG:2249', 'EPSG:4326' ) )
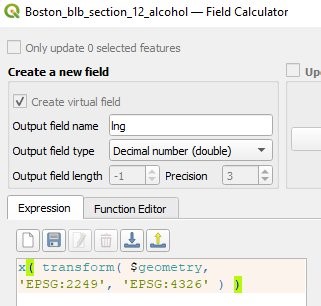
This
may look complicated, but it’s simply telling QGIS to give me the X coordinate (Longitude), but before
you calculate it, do a little on-the-fly transformation (transform) of my $geometry
(the point) and go from EPSG:2249
(MA State Plane) into EPSG:4326
(this is the WGS84 coordinate system, which gives us a nice longitude value
here).
Now
we say ‘OK’ to have our values calculated. And then we do the same for our
Y values (Latitude), making a new field using:
y(
transform( $geometry, 'EPSG:2249', 'EPSG:4326' ) )
And
now we have two new columns with latitude and longitude values. Easy
peasy.
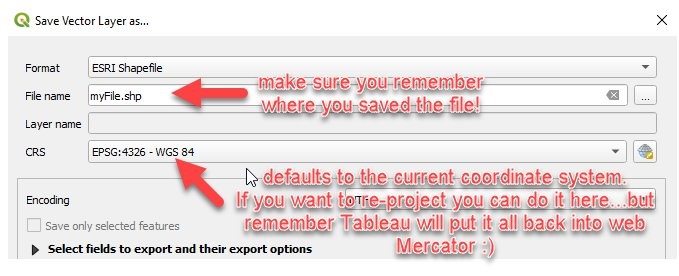
Now
save we’ll save the file by right clicking on the layer name and choosing
Export → Save Features
As…
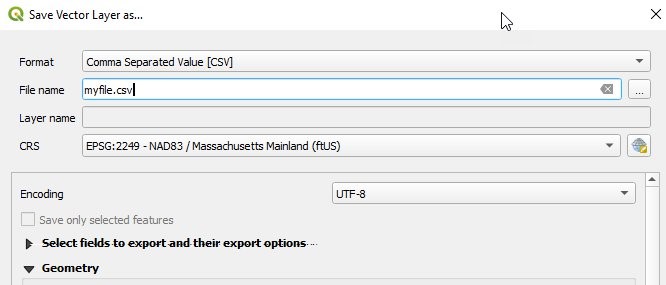
Export
the file as a CSV (remember where you save it!). The CRS doesn’t matter
since this is just a text file with the raw latitude and longitude values.
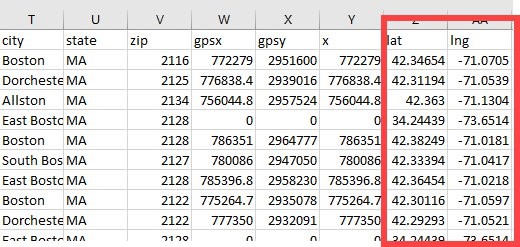
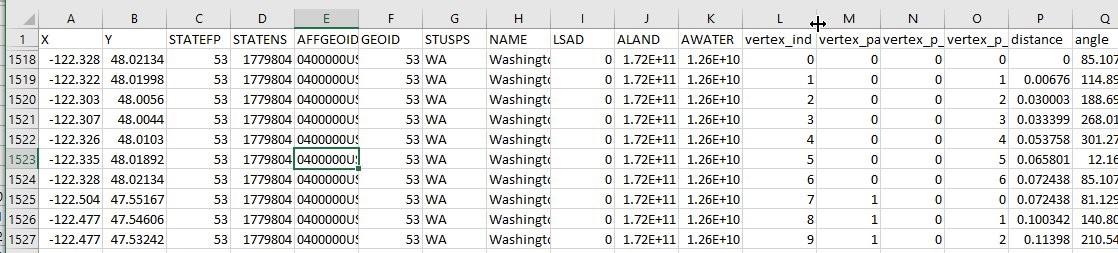
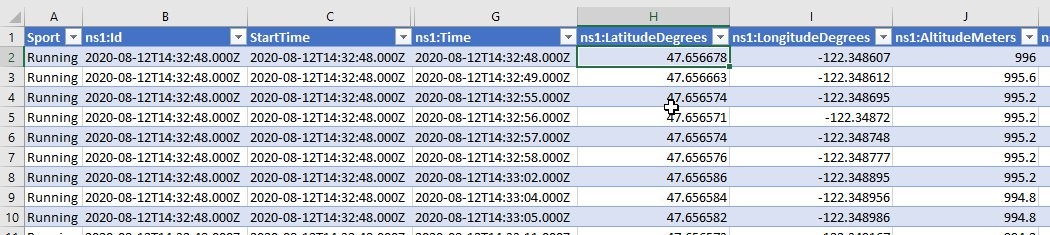
And
now you have two new fields tacked on to the end of your table with the
latitude and longitude values ready to go! Here is the proof from opening
the file in Excel when I finished.
Convert Lists of Points into Lines or Polygons
Why and When:
What if you have a big table with individual points which need to be connected
together to form lines or polygons? For instance, maybe you have a ton of
data collected with a GPS (e.g., running data). While you can often make
lines or polygons in Tableau using the Path Shelf on the Marks Card—sometimes
it’s nice to just have them as single line or polygon features instead of a
bajillion points in a table. For an example, we can go from this (The
geometry for Washington state alone is 1847 rows in this table!):
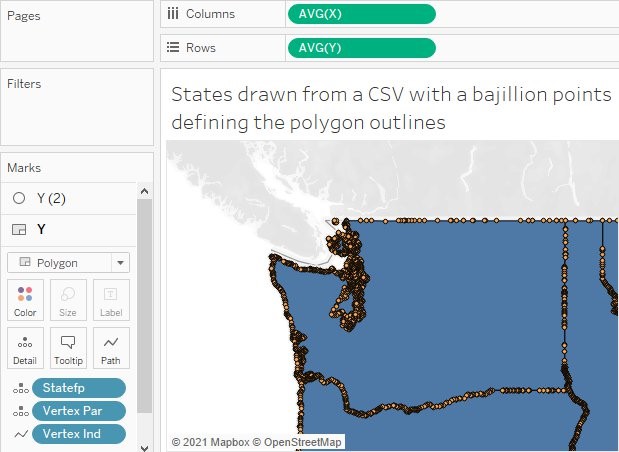
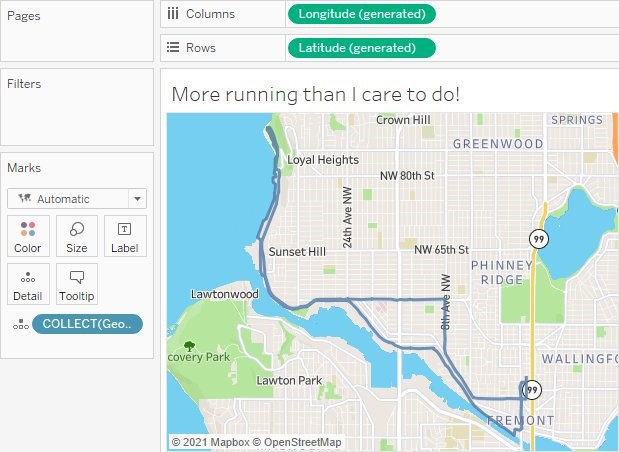
to
this in Tableau if we just use the Path Shelf method:
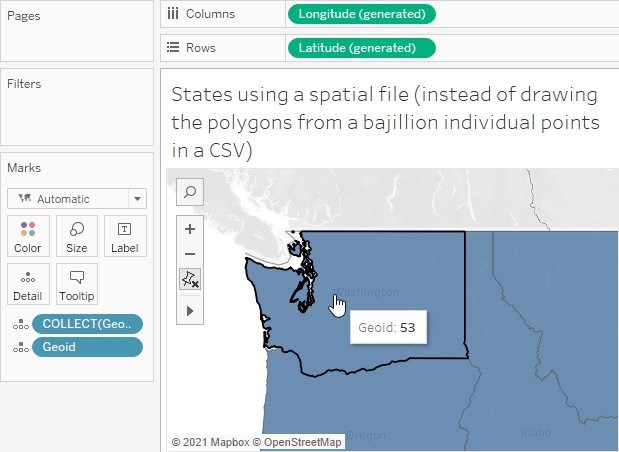
Or
to this in Tableau if we first convert to lines or polygons. In the end, this
will be a cleaner solution than the connected points.
How:
It seems pretty nice to have a long, complicated data table
converted to a simple geometry instead of wrestling all of the points in
Tableau. It’s easy to convert—you just need to identify the fields in your
table needed to:
·
Identify
unique polygons or lines. You can only use one field for the unique ID, so
if you have multi-part polygons you may need to create a new unique ID (e.g.,
polygon name + part #)
·
List
the order of the points. Your ordering field can be numeric, like 1, 2, 3,
etc. or if you’re working with GPS (or other) data it might be dates and you
want to connect the points in temporal order (day, hour, etc.). Any type
of field like this will work.
Here’s
the process with the states file I showed in the images above...
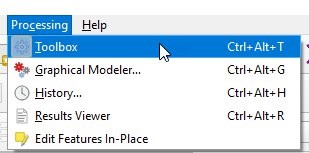
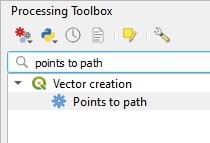
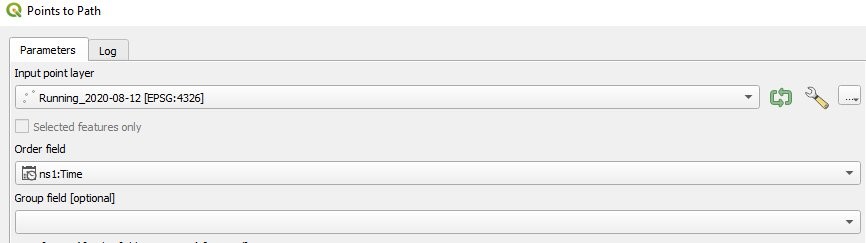
With
the file open in QGIS, you’ll convert the points to paths by opening the
Processing Toolbox (Processing → Toolbox) and searching for Points to Path
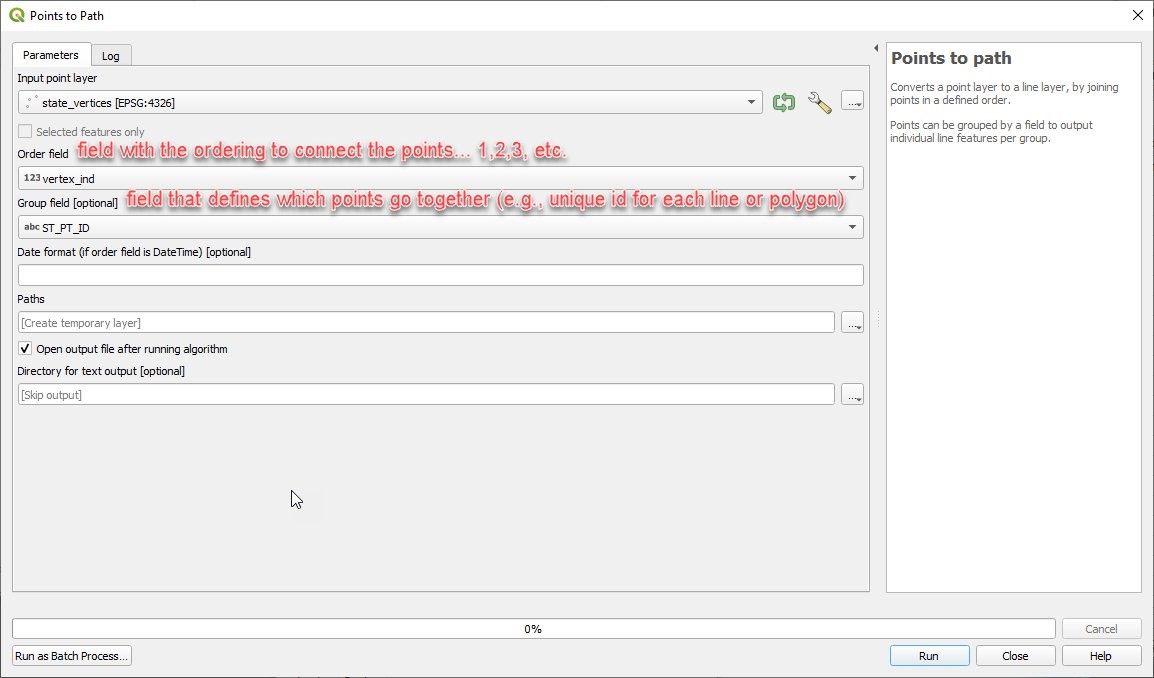
Fill
in the details on the fields to use to define the polygons or lines and the
order in which to connect them, just like this:
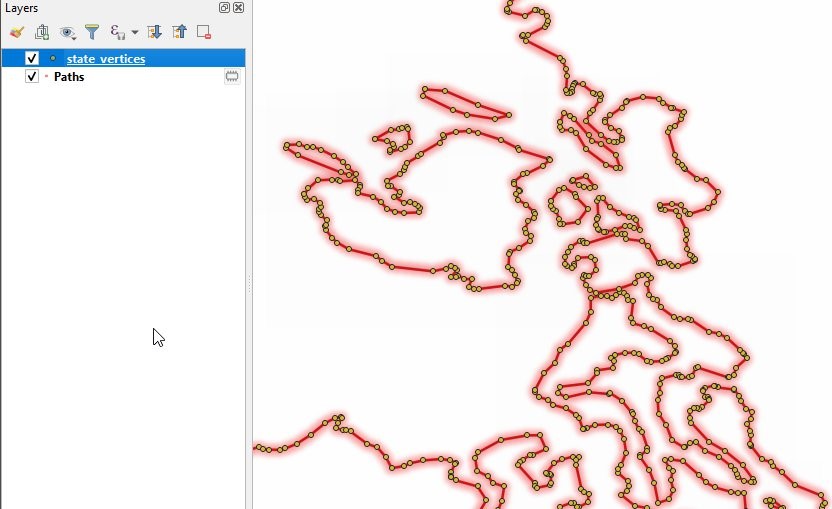
If
you pick the fields correctly to define the unique ID for each polygon and for
the ordering of the points, you should end up with a nice outline file of your
dataset—it isn’t polygons yet, but we’re close. If all you wanted was the
outlines, you’re done—if not, keep on reading!
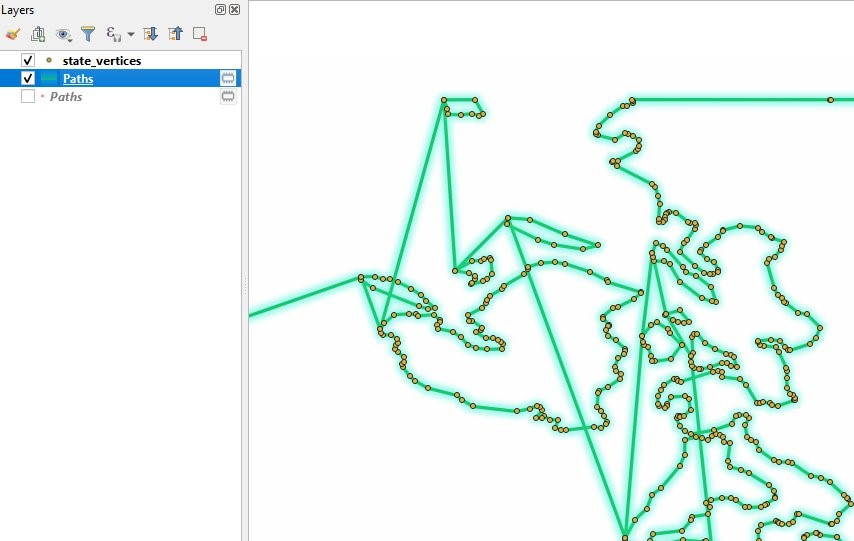
Though, a quick warning about what happens if you don’t get your fields identified correctly...you might end up with something like this (or even messier)! Boo! Bad!
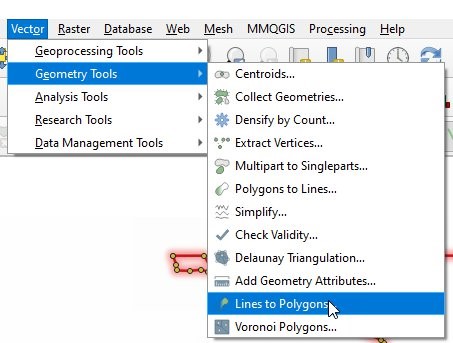
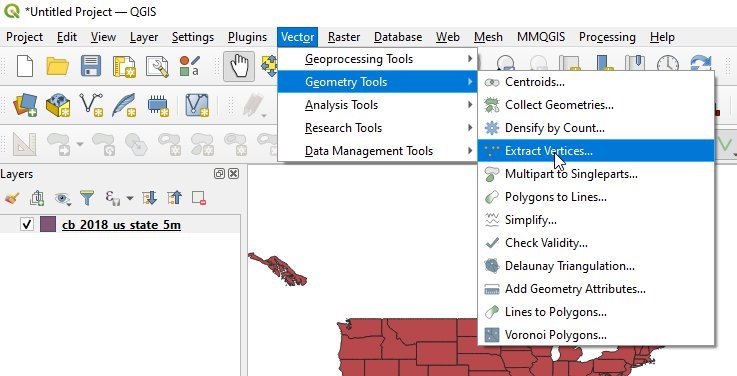
Once
the outlines look good, assuming you want polygons, you just have one more
step—we can use the Lines to Polygons tool from Vector → Geometry Tools → Lines to
Polygons
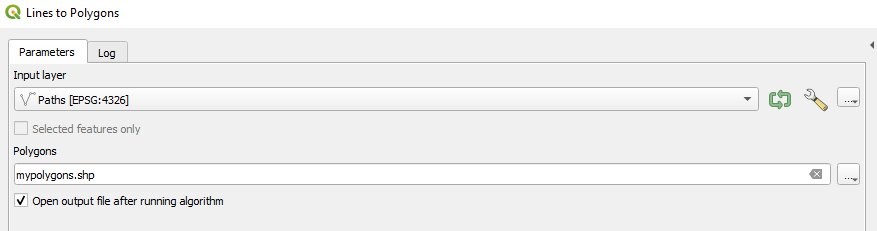
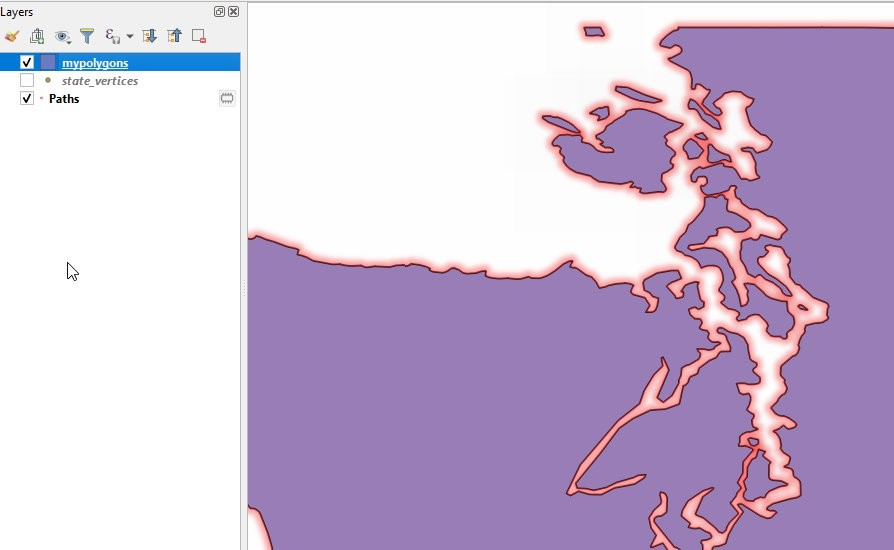
Run
the tool on the paths file that you just made and check out the results—you
should have a nice set of polygons (I kinda like the look of the ones below
where I left the glowy outlines on underneath...)...and that’s all there is to
it! Export your new polygon file as a shapefile (or other spatial file
format that you like) and add it to Tableau!
Here’s
one more example using GPS data. This particular data set is running location
data:
You
can add the CSV to QGIS and set the vertex ordering based on the time field:
Which
gives you:
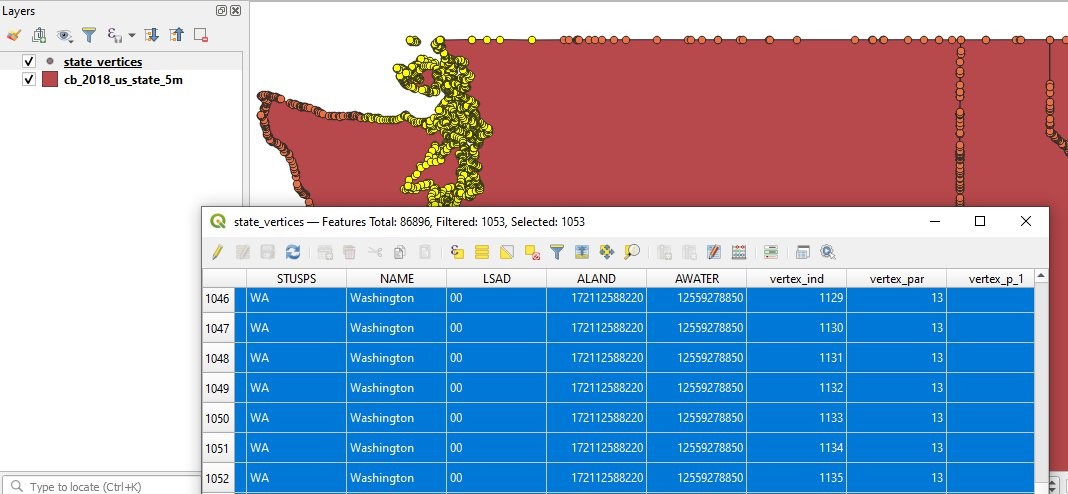
Random note: If you ever feel
the need to generate a text file with a list of vertices for lines or
polygons, QGIS has some nice tools for doing that. Let’s say I have a nice
file of US States (like from the US
Census), I can open the polygons in QGIS and use the Vector → Geometry Tools → Extract
Vertices to make a shapefile with just the points for every polygon. That will give me a file with all of the
vertices, and attributes so I know what order to connect them. Just save that file as a CSV and you’re
good to go! Why might you want to do this? It’s a good way to render
polygons in Tableau if you’re using a version before Tableau started to support
geographic data types natively! (or if you want to make an example to show
how to turn these files back into polygons. Haha)
Next Up!
In the next post in the QGIS for Tableau users series, I’ll
dig into grouping and splitting polygons to make custom geographic regions!
In
the meantime, if great questions or ideas come to you, feel free to reach out
on the Tableau Community Forums
or, to follow more of the random Tableau spatial thoughts that I share on
Twitter (@mapsOverlord)...or to
share the great maps that you’re making in Tableau!
Sarah Battersby, June 21, 2021


Thanks for the blog Ken and Sarah.
ReplyDeleteThanks for the blog Ken. I have a spatial file which opens in tableau as it is expected but while publishing it on tableau public the map is not as it was on tableau desktop. Can you help me in fixing the error?
ReplyDeleteI'd need to see the workbook. Can you email me? flerlagekr@gmail.com
DeleteHow did you created the GPS Data? Thanks for the blog.
ReplyDelete