
5 Reasons to Use a Calendar/Date Table (Date Dimension) in Tableau

In this blog, I’ll be making an argument for the increased usage of something I’ll refer to as a calendar table. These tables—referred to as a date dimension in data warehousing vernacular—have long been used in data warehouses, so it’s somewhat surprising that I don’t see them used more often in Tableau. I’d like to help change that.
Note: Date
Dimension is the most commonly used term for this type of table, but I’ll
be using a more generalized term—Calendar Table—throughout this blog.
What is a Calendar Table?
A
calendar table is a table containing a single record for every date that you
might use in your analysis. Generally speaking, you’ll choose a start date (in
the past) and an end date (well into the future) then create a record for every
date in between. For example, later in this blog, I’ll be sharing an example
that starts on January 1, 2000 and goes through December 31, 2040. The range of
dates should include any dates that you might possibly want to use in your analysis.
Since you create dates well into the future, you typically only generate the
table once then never touch it again (until a long time in the future when you
need to add more dates).
But
these tables are more than just a single date—they contain additional details
about each date. For instance, it’s typical to include the number and name of
the month, the year, the day of the week, the day name, and many other features
related to each date. Here’s an example:

This is
just a very small subset of the additional columns you’ll typically see in a
calendar table. I’ll share a resource later in this blog that has over 50 fields
and contains virtually anything you’d ever want to know about a date.
In
addition to standard information about each date, you can also include fields
that are very specific to your business, including:
Fiscal
Year Info – You can create fields that define the fiscal year, month,
quarter, etc. based on the fiscal calendar your business uses.
Weekends
& Holidays – It can be useful to include fields denoting which dates
fell on weekdays or weekends, which are holidays, or any other indicator that
might be important to your business.
Useful Dates
– You can include fields that provide other useful
information such as the first (or last) day of the quarter, the week, or the month.
Other
Languages – If you do business in multiple languages, you can include
translated versions of day names, month names, or include alternative date
formats.
How to Use a Calendar Table
Creating a calendar table does require a bit of upfront
work. Generally, we need to write some code (often using SQL) or create some
sort of ETL/data prep workflow to create this table. That can be a bit time
consuming up front, but it’s worth it in the end for reasons we’ll discuss in a
moment. Plus, once it’s created, you never need to do anything with it again—you
just connect it to your data model and use it.
The good news is that, if your organization has any sort of
data warehouse—even a small departmental “data mart”—it likely already has a calendar
table (the data warehouse team will, of course, call it a “date dimension”)
which you can connect to immediately. Because these tables generally contain no
confidential information, getting access to these tables is typically a pretty
simple process. So, before you create your own calendar table, be sure to see
if such a table already exists.
If, after asking all the right questions, you determine that
there is no enterprise calendar table you can use, then you’ll need to create
one. Fortunately, others have already open-sourced their code for creating such
tables, so you can probably borrow this code as a starting point, modifying it
to meet your needs. A really good set of T-SQL (SQL Server’s flavor of SQL)
code, created by Mubin M. Shaikh, can be found on Create
and Populate Date Dimension for Data Warehouse. To get you started, I’ve used
his code to create a calendar table called DimDate in my publicly-available
SQL Server database (for details on connecting to this database, see SQL for Tableau
Part 1: The Basics). The table has every date from January 1, 2000 to
December 31, 2040. This will act as a good starting point for most people. I’ve
also exported this table to Excel format and made it publicly available here.
Note: The fiscal date fields are based on a 4-5-4 fiscal
calendar, so this may not match your own organization’s fiscal calendar. You
may also have other holidays not specified by the script.
Once we have this table, we can easily connect it to our
data model in Tableau using relationships or joins. For instance, the following
data model relates the Order Date from Superstore to the calendar table.
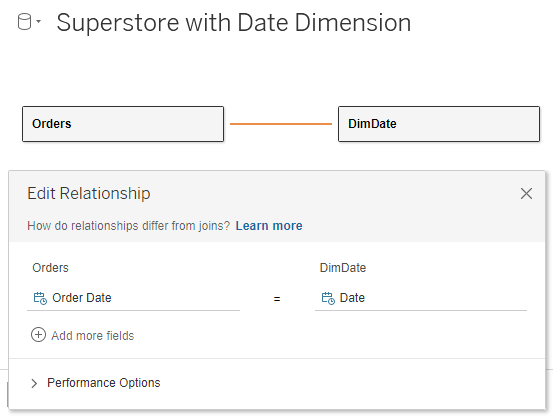
Of course, Superstore has more dates than Order Date, so we
could use multiple calendar tables, as shown here.

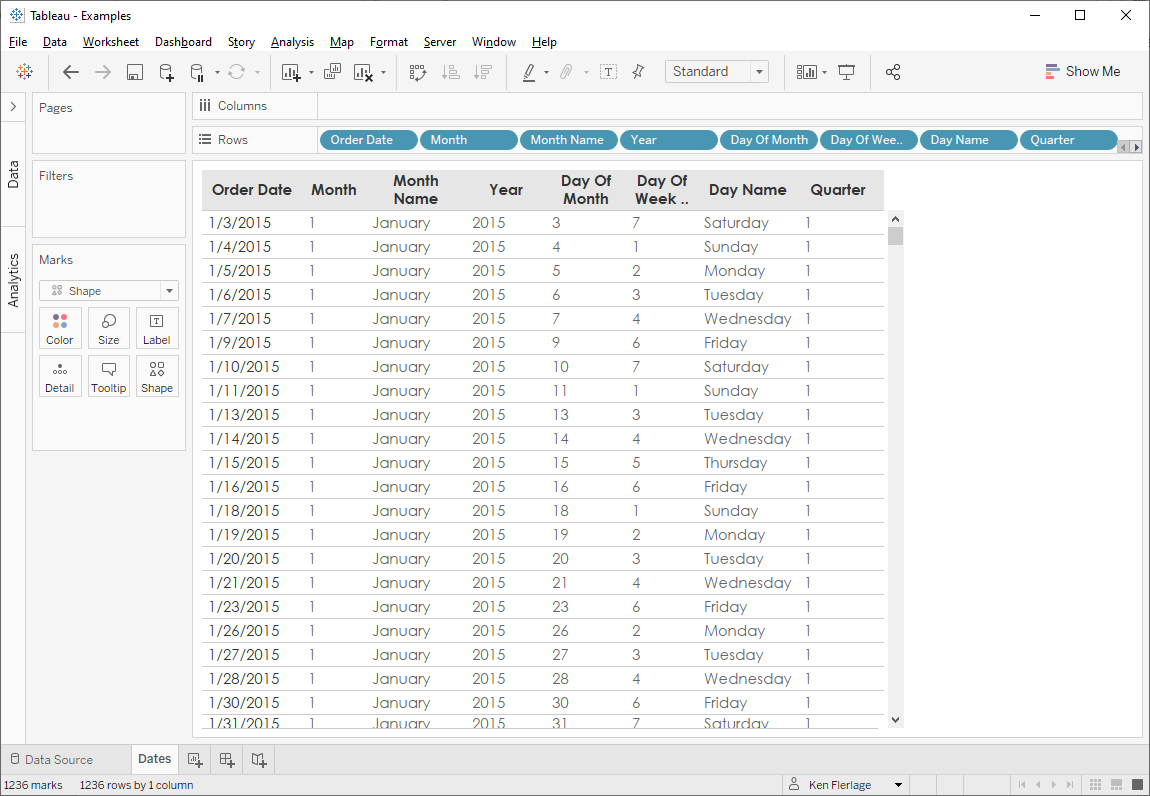
All of these fields will then be instantly available for us
to use in our workbook. For example, here are the Superstore Order dates along
with related information from the calendar table.
Why Use a Calendar Table?
At this point, you maybe asking yourself why we would want
to do this when we can just use Tableau’s built-in date hierarchy for basic
information and create calculated fields for the rest. I’ll share 5 reasons in
a moment, but the key question is why do all that if you don’t have to? With a
calendar table, you can simply join it to your data model and be off and
running. Let’s explore this further by looking at five reasons to use a calendar
table.
# 1: Eliminate Calculated Fields
The most obvious advantage to using a calendar table is that
you don’t have to create calculated fields for every component of your date.
Some time ago, I created my Date Calculation Cheat
Sheet which provides 46 reusable date calculations. Some of these
calculations were quite complex to create so why should you create them every
time you work with a new Tableau data source? With a calendar table, we can
create the calculations once, insert them into a table, then simply use the
fields from the table. No need to create multiple date-related calculated
fields every time you start a new project—it’s just a simple join/relationship.
# 2: Create Consistency Across Data Sources & Workbooks
In my experience, it’s always best to enable as much reuse
as possible. For example, if you have a sales data source that can be leveraged
by your entire sales organization, then publish that to Tableau Server/Online
and make that published data source available to those who need it. You can
build in all the calculations, groups, sets, parameters, etc. that people could
need so that they are not forced to create each of those themselves. When
individual users create these themselves, they are duplicating efforts and
opening up the organization to mistakes, differences in logic, etc. So, in my
opinion, it’s best to do it once then share with others. By doing this, you
create consistency and prevent wasted time.
The same is true of a calendar table. This table is
pre-established with all of the proper rules governing dates and the specifics
of your organization (fiscal calendars, holidays, etc.). If everyone in your
organization uses that same standard calendar table, then you’re guaranteed to
avoid mistakes. So, by encouraging use of a calendar, you’re encouraging
consistency and reuse across all of your data sources and workbooks. And this
consistency extends beyond Tableau. If your organization leverages multiple BI
tools, then you’ll be ensuring consistency not only with other people, but
across all platforms.
# 3: Simplify Date Scaffolding
I spend a lot of time answering questions on the Tableau Community Forums and one
common problem I see is missing dates. For instance, you may want your
visualization to always show all twelve months of the year, regardless of
whether or not there is data for all twelve months. In some cases, the solution
to these problems is to use a date scaffold. As I’ve written on this topic
before in Creating
a Date Scaffold in Tableau, I won’t go into much detail on this here. But
the basic idea is that we’re forcing our data set to include all of the dates
we need in order to fill in those gaps. We do this by creating a table which
contains all of the individual dates we wish to show. Sounds familiar, doesn’t
it? This is pretty much exactly what a calendar table gives us. So, instead of creating
a date scaffold table from scratch every time we need to use this technique, we
can simply use our standard calendar table, saving us a bit of time and ensuring
consistency.
Note: See the date scaffold
blog for further details on how to create the scaffold. You’ll just swap
out the custom-built date table with your standard calendar table. In addition,
please be sure to see Jeff Shaffer’s blog, Data
Densification Using Domain Completion and Domain Padding, in which he
shares some ways to avoid using date scaffolds using data densification techniques.
# 4: Deal with Your Fiscal Calendar
Fiscal years are notoriously difficult to deal with,
particularly because there are so many varieties of fiscal calendars. In
Tableau, you can specify your fiscal year start date, but you cannot specify special
fiscal calendars such as those that use 4-4-5 or 4-5-4
structures. To deal with these, you will inevitably be forced to create
complex logic within calculated fields. Furthermore, when you use Tableau’s built-in
fiscal year functionality, that information is not readily available to you in
calculated fields. So, if you need additional calculated fields for your dates,
you have to build the fiscal calendar logic into your calculated fields. Having
done all of this in the past, I can tell you that it’s not fun and it is very
prone to errors.
Calendar tables to the rescue! We will build this logic into
the creation of our standard calendar table, populate the table using that logic,
then never touch it again. We can simply connect to the table, then use the
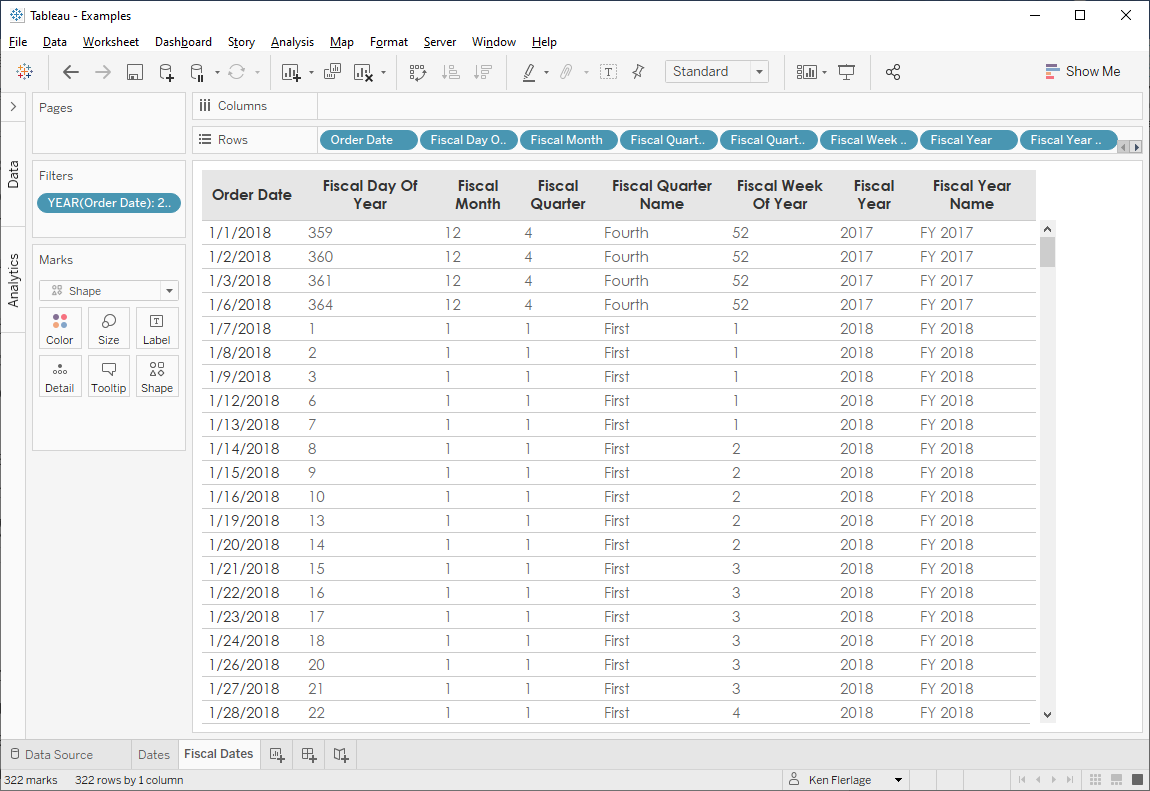
various fiscal calendar fields, without writing a single calculation. Here’s an
example using a 4-5-4 fiscal structure.
# 5: Deal with Weekends & Holidays
Another common question I see on the Tableau Community Forums is a need to
exclude weekends and holidays from an analysis (i.e. only include business
days). In some cases, excluding weekends from an analysis isn’t terribly
difficult since there are always two weekend days each week, falling on
Saturday and Sunday. But, in other scenarios, it can be quite difficult. And,
once you introduce holidays, it becomes virtually impossible since Tableau does
not have any sort of holiday library you can refer to. Furthermore, every
organization has a slightly different holiday calendar than others, so there is
no one standard that meets everyone’s needs.
Since our calendar table contains every date, we can first
scaffold our data (see # 3) to ensure all dates are counted. We can then use
the weekend and holiday indicators to properly exclude or count days.
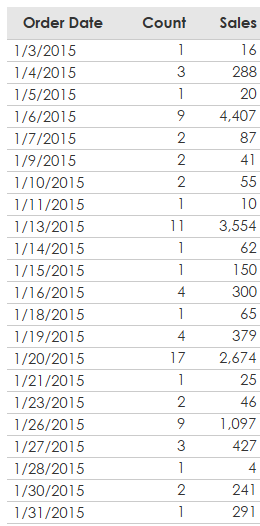
For example, here’s are Superstore sales for January, 2015.
Now let’s say that you want to determine the average daily
sales for weekdays only. We’d first need to create calculated fields to
determine which days are weekdays. That’s easy enough in Tableau using the
DATEPART function:
Weekend
// Is this a weekend day?
IF DATEPART('weekday', [Order Date]) IN (7, 1) THEN
"Yes"
ELSE
"No"
END
We could then get the daily average using the following
calculated field:
Weekday
Average
// Average sales for weekdays only.
SUM(IF [Weekend]="No" THEN [Sales] ELSE 0 END)
/ COUNTD(IF [Weekend]="No" THEN [Order Date] END)

As we can see above, the overall average for January is $845,
which sounds reasonable enough. But there’s a problem…We’re only counting days
for which there is an actual sale. January 1, 2, 8, 12, 22, and 29 were all
weekdays and should be counted in a daily average, even though there were no
sales.
To address this, we can use our calendar table as a
scaffold, then switch this view and the calculated fields to use the Date
and Is Weekday fields the calendar table.
Weekday
Average
// Average sales for weekdays only.
SUM(IF [Is Weekday]=TRUE THEN [Sales] ELSE 0 END)
/ COUNTD(IF [Is Weekday]=TRUE THEN [Date] END)

Because of the scaffold, we now have every date in January,
regardless of whether or not there are any sales, which ensures that we will
now get the accurate daily average of $614.
And, of course, this example could be expanded to only
calculate the daily average for weekdays that are not holidays. We’d simply
adjust our average calculation to also exclude anything where Is Holiday
is true.
Calendar table scaffolds also allow us to easily count
business days between two dates. Tableau has a good
knowledgebase article on this, but if you wish to account for holidays, it
gets a bit more complicated.
Let’s say, for example, that we wish to count the number of
business days (excluding holidays) between December 20 and January 9. As in our
previous example, many of these days do not have sales, so we’ll only see that
dates that do.

To account for holidays, the KB article instructs us to
first join/relate our data to a holiday table that we’ve created outside of
Tableau. That would give us something like this:

We can then apply the somewhat complex calculated fields
used in the article.
But, since we have a calendar table, we don’t need the
additional holiday table—we already have holiday info. And, if we use this
table as a scaffold, we will get a complete list of all the dates between December
20 and January 9, along with which are weekdays and/or holidays.

With these in place, the task of counting business days
turns into some simple math—we just count the days that are weekdays, but not
holidays.
Wrap-Up
So there you have it—five reasons why I think we should all
be using calendar tables (date dimensions) more frequently in our Tableau
workbooks. By creating these standards within our organizations, we’ll be able
to reduce the time we spend writing calculations, ensure consistency across all
workbooks and data sources, and solve lots of different business problems.
I hope that you’ve found this blog useful. If you have any thoughts or comments, please feel free to share them in the comments below. Thanks for reading!!
Ken Flerlage, October 18, 2021


I also use date dimensions to flag moving date ranges (e.g. YTD for the current and prior fiscals years to make year-over-year calcs update automatically). Another great article. Thanks Ken.
ReplyDeleteYes! Once you have the date dimension and get in the habit of including it, so many new use cases emerge.
DeleteAmazing work again, thank you for being awesome.
ReplyDeleteI just created a date label for all periods TW, LW, PW, MTD, QTD,YTD TWLY, LWLY etc
These serve me well in calcs and just as labels to show im going in right direction.
Fantastic!
DeleteDo you have the calendar table code for MySQL? It'll help me streamline the Tableau calculations.
ReplyDeleteI do not, but I'd assume it would be pretty similar to this. You might want to search for something like "MySQL date dimension script".
DeleteThis is a great article, Ken. Our team builds out Tableau data sources and publishes them to Tableau Server for our business analysts to use. One common complaint we have heard from them is that the addition of all the attributes from these date dimensions "is too confusing" and they prefer to create calculations based on the date field.
ReplyDeleteWe're trying to strike a balance by still exposing some of those "extra" date dimension date type fields (ex. Sales Quarter Start Date or Fiscal Period End Date). This provides them some of those extra value fields, but not an overload of information.
Yes, I can definitely see how that would be a challenge. One thing I like to do is put all of the date fields into their own folder in the Tableau data source--that way, they can just collapse the folder. And, of course, as people are building data sources, they can hide the fields they don't need. Finally, you could always create a database view that includes just the heavily used fields--by doing that, you can ensure you have all the fields in the database, in case they are ever needed, but most of the time, people will just use the stripped down view.
DeleteHi, Ken Amazing information! I am an old power BI user and used to have a calendar table available at all times. Now since I moved to Tableau I have not seen anyone use it. A couple of questions.
ReplyDeleteCan I build a calendar table in Excel and use that in tableau?
Should I include calculations on the table or is this table just for helping out in calculations later?
Thanks and again amazing information!
You could build one in Excel, but the advantage of having it in the database is that others can use it as well.
DeleteThis old Power BI user agrees with you. It's taking me some time to figure out how to use a date dim table correctly with Tableau. The blog post is extremely helpful as I learn. Thank you!
DeleteIs there any equivalent of userelationship available in power bi?
Deleteif I have multiple date fields in a table, I don't wish to have multiple copes of table date dimension loaded.
I'm not familiar with this, so I'm not entirely sure. But I will say that the only way I know to make this work in Tableau is to relate/join the table multiple times.
Delete"I’ll share a resource later in this blog that has over 50 fields and contains virtually anything you’d ever want to know about a date." Did I miss it in the article?
ReplyDeleteSearch the article for Mubin M. Shaikh and you'll find the paragraph--sorry, it's a bit buried.
DeleteHi Ken, this was great information! As a former Power BI user, this makes a lot of sense to me. One of the things I'm struggling with that I didn't see addressed here is how to do these calculations when the start and end dates are 2 separate fields in the data. For example, Order Date and a Ship Date are separate columns, and we need to calculate the non-holiday weekdays between the two dates for each row/order.
ReplyDeleteHmmm. That could be tricky. Admittedly, I don't have a good solution for that off the top of my head. Would be a great question to ask on the Tableau Community Forums.
DeleteHi Ken, this is the second time this week that a google search has landed me on your site...so thank you for knowing what I need before I do! The tableau person before me used a custom scaffolding sql query in all of our dashboards and I have a hunch that this is the reason our extracts take longer to refresh. Before I go down the path of working on a calendar table to replace our scaffolding, how do you find the performance is with the calendar table join?
ReplyDeleteWell that's great to hear!! I'm glad Google is leading you here. Performance for a calendar table should be quite good since it's a very simple join.
DeleteCan you republish then calendar data sheet? For some reason the google docs link won’t open.
ReplyDeleteSeems to be working for me. Can you email me? I can then send it via email. flerlagekr@gmail.com
DeleteHi, Ken. I can't seem to find the google doc links on the page at all. Are they still there? Cheers!
DeleteSorry, I found it. Here's the link for anyone not finding it in the article: https://docs.google.com/spreadsheets/d/10CLQGp57UlDkYM_eXEl2_qJMTYARjznD/edit#gid=1993513003
Delete