
Creating a Date Scaffold in Tableau

I spend a lot of time answering questions on the Tableau Community Forum and one common problem I see is missing dates. For instance, you may want your visualization to always show all twelve months of the year, regardless of whether or not there is data for all twelve months. Quite often, the solution to these problems is to use a date scaffold. So, in this blog I’m going to show you how to create and use a date scaffold in Tableau. I will note here that I’m not the first to write about data scaffolds—it’s actually a pretty common technique and something that has been written about quite a bit. But my goal is to give you my spin on it as well as provide a couple of different methods for creating a scaffold.
Before we jump into the tutorial, let’s define the term “Data Scaffold.” Dictionary.com defines “scaffold” as “a temporary structure for holding workers and materials during the erection, repair, or decoration of a building.” So a data scaffold is kind of the same thing—it’s a temporary (or artificial) structure used to arrange the data in a certain way to aid in the creation of a data visualization. This technique, which was pioneered by Joe Mako—former Tableau Zen Master and one of the most brilliant Tableau people ever—is incredibly powerful and versatile.
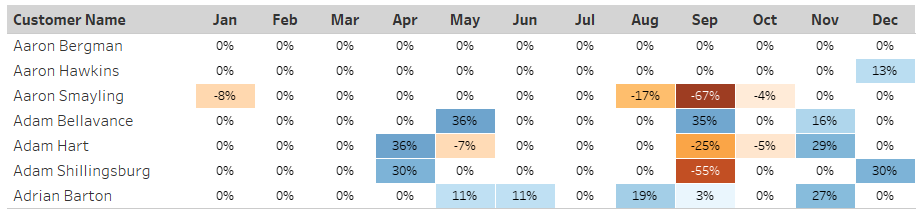
So, let’s take a look at a use case for scaffolding. We’ll start with this fairly simple highlight table which uses the Superstore data set and shows Profit Ratio by Month for each Customer.

This is great. It shows all of our customers and all of the months, exactly as desired. But what if we start filtering out some of the customers? Here I’ve filtered down to just the first seven customers in the list:
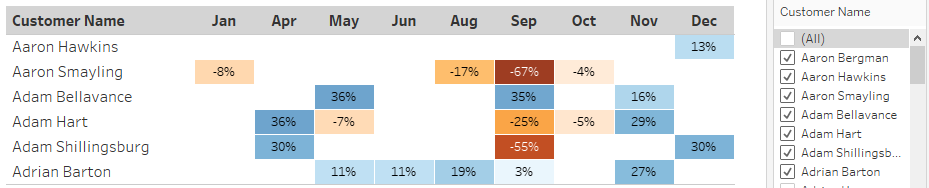
We can now see a couple of problems. First, because none of these customers have sales for February, March, and July, those months do not show at all. Second, because Aaron Bergman has no sales at all for this year, he is not listed. In some cases, this may be exactly what you want, but in many circumstances, you’ll want to show all of the months and all of the customers. This is where we’ll leverage a data scaffold. What we need here is to ensure that every customer has data for every date, so even if you filter down to just a single customer, you’re guaranteed to always show every month. But how do we do this in Tableau? I’ll show you how to do it in both Tableau Desktop and Tableau Prep.
Creating a Scaffold in Desktop
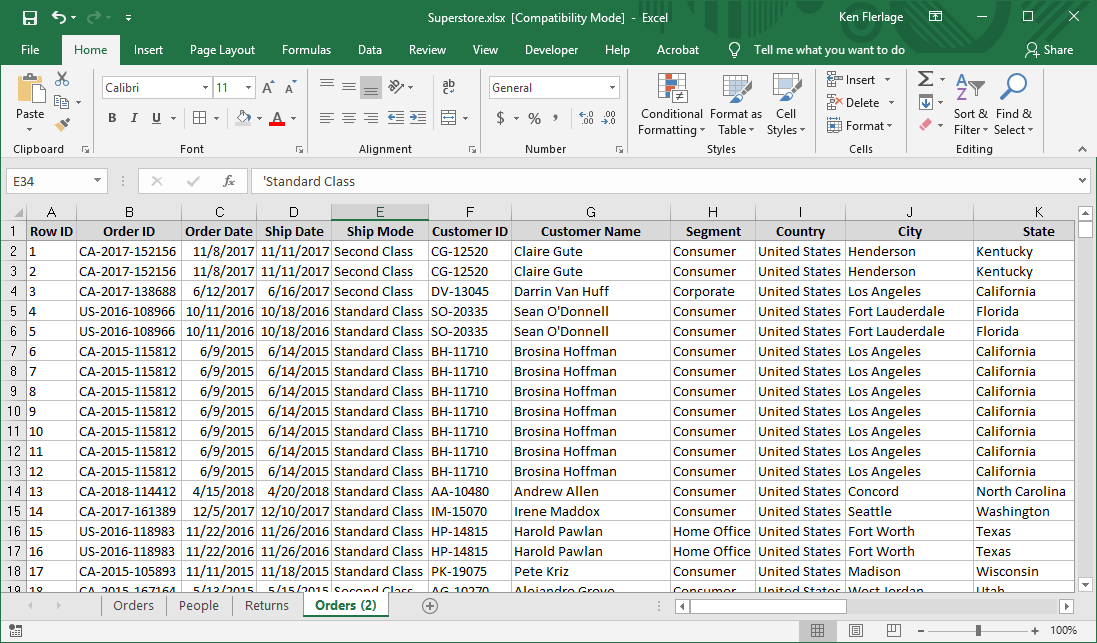
In order to create the scaffold, we’ll need a list of unique customers and a list of dates. If you’re working with a real database (i.e. not a spreadsheet), then it’s likely that your database will have a table with a list of all your customers. It’s also possible, particularly if you’re working with a data warehouse, that you have a table with a list of dates. If so, then you can use those. But since I’m working with Superstore, no such unique lists exist, so we’ll need to do some manual work to create them. Start by opening the spreadsheet in Excel (you can typically find the superstore spreadsheet in C:\Program Files\Tableau\Tableau <Version>\defaults\Datasources\). Then make a copy of the Orders tab:
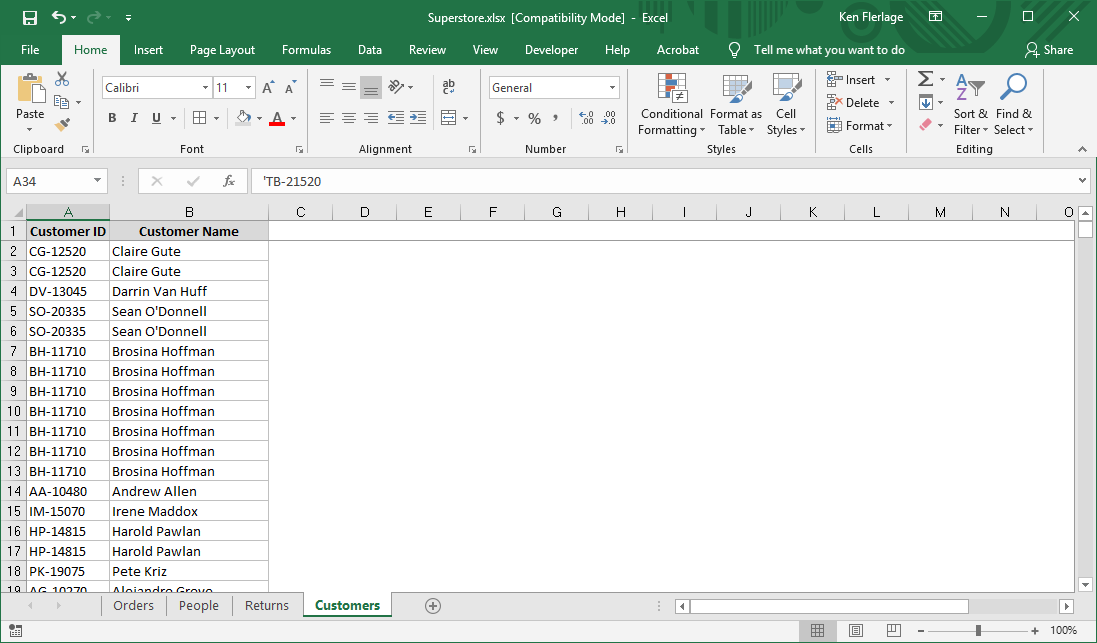
Next, rename the tab “Customers” and delete all columns except Customer ID and Customer Name.
Finally, select both of the columns, then go to the Data menu and click the handy “Remove Duplicates” button.
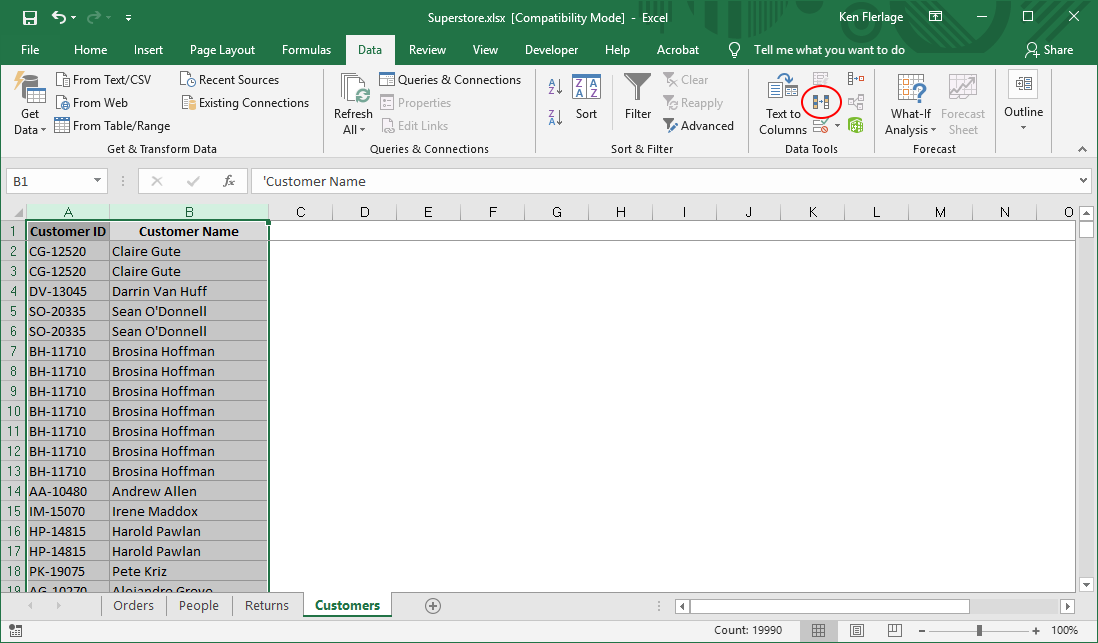
This will leave you with a list of the unique customers.
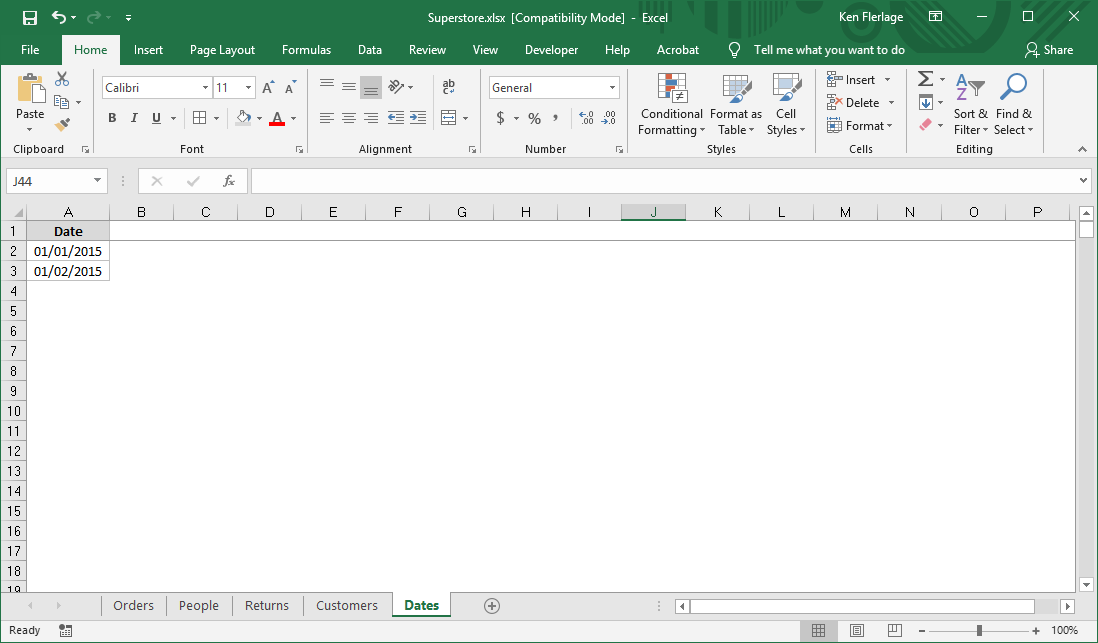
Next create a new tab and call it Dates. We’ll use this to create a list of all dates we wish to use in our scaffold. Since the Superstore data set has orders for 2015 – 2018, we’ll create dates from January 1, 2015 through December 31, 2018. Start out by creating a header row with a name for the column (“Date”) then fill in the first two rows with 01/01/2015 and 01/02/2015.
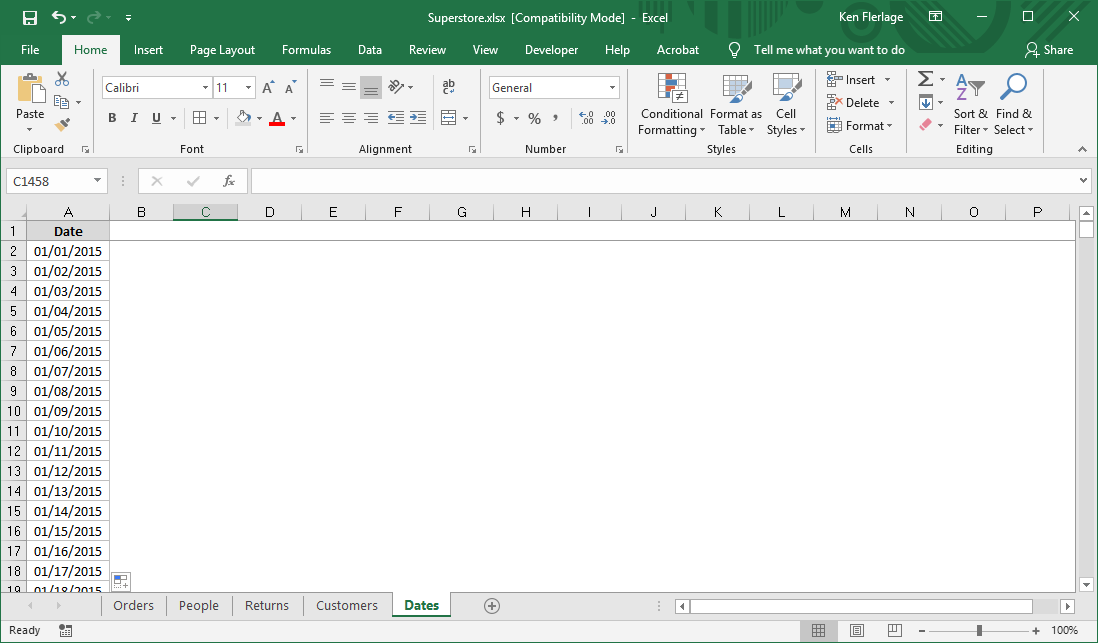
Now select these two cells, then grab the bottom right-hand corner and start dragging down. Excel is smart enough to realize that you want to add one day to each subsequent date. So keep dragging until you reach December 31, 2018.
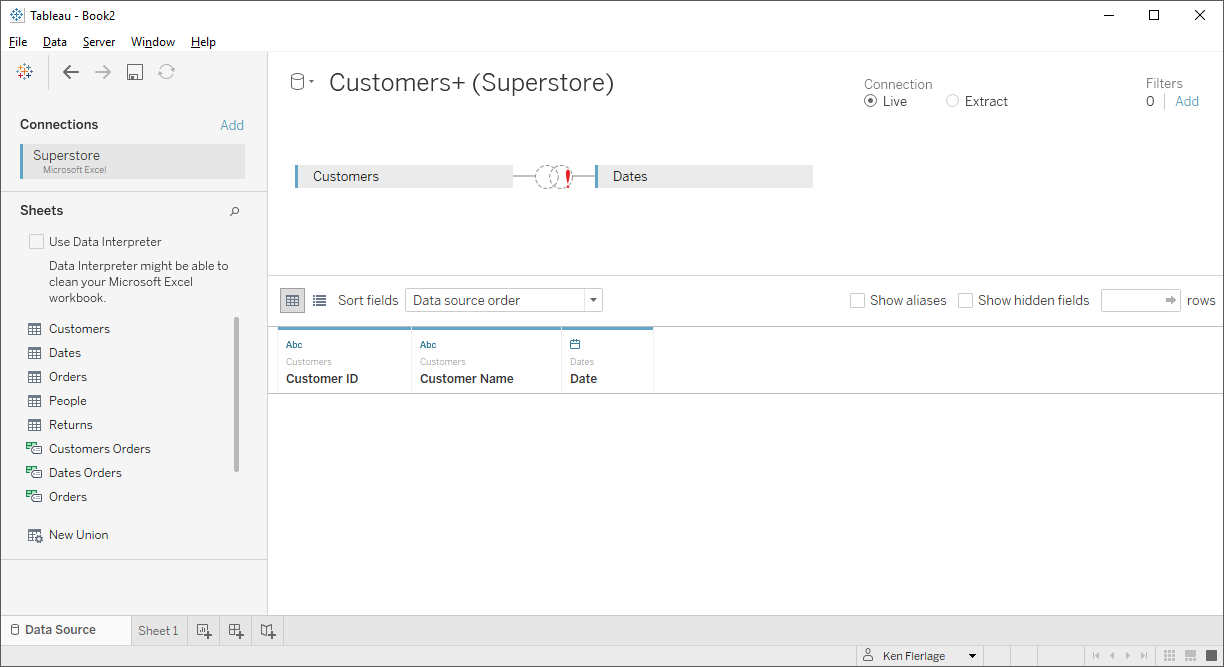
Okay, now let’s connect to this spreadsheet in Tableau. Remember that our first goal is to create a list of each customer with each date. To do that, we’ll need to use a cross-join. A cross-join matches every record from one table with every record from a second table. Tableau doesn’t have cross-joins out of the box, so we can use join calculations to mimic a cross-join. Start out by dragging Customers and Dates to the data pane.
Now, on the left side, choose the “Create Join Calculation” option:
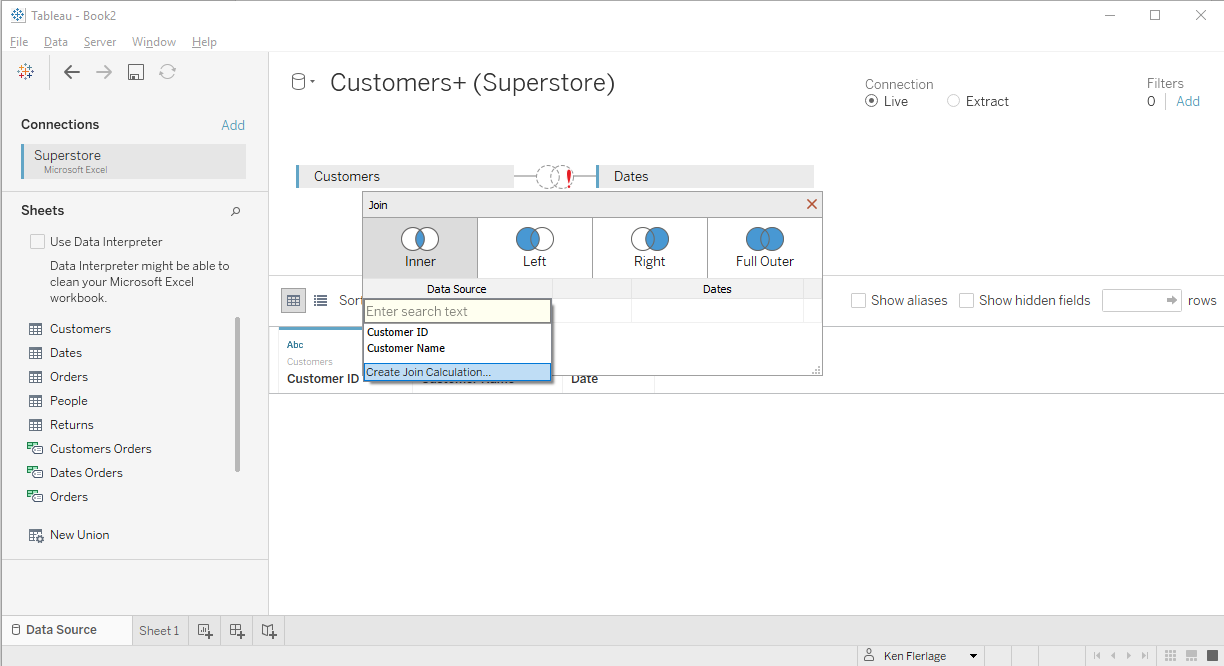
In the calculation editor, simply type the number 1. Then do the same on the right side of the join.
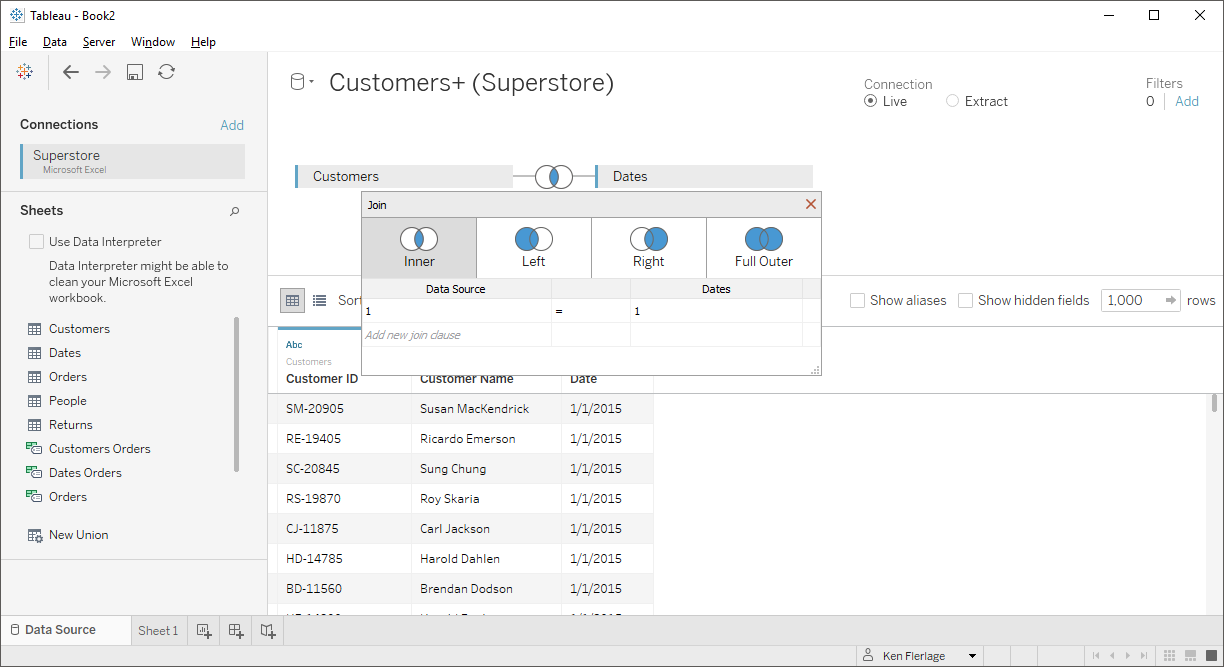
This is kind of like artificially creating a field in both tables and making all the values 1. Then, when you join on these, since all the records have the same values, every record in the left table will join to every record in the right table, which is, of course, exactly what we want (for more on cross-joins and database joins in general, see SQL for Tableau Part 2: Combining Data).
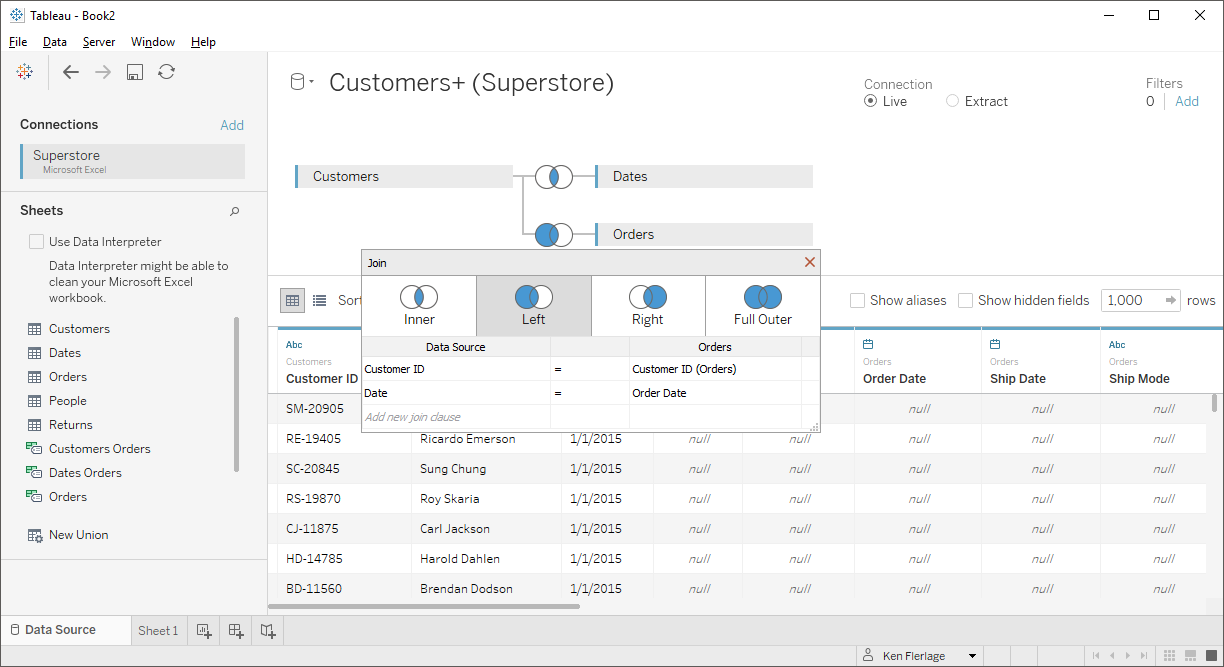
Next, we want to left outer-join this data back to the Orderstable. By left-joining, we’ll get every record from our scaffold plus any matching records from Orders. To do this, drag the Orders table over to the data pane. Then set up a left join where Customer ID = Customer ID and Date = Order Date (Note: the Customer ID on the left side actually comes from the Customers table, while the Date on the left side comes from the Dates table).
And that’s it for the data modeling. Next, jump over to Tableau and create a new highlight table exactly like the one I showed earlier.
Now, when we filter down to just those first 7 customers, we see something a bit different:

Notice that Aaron Bergman shows on the chart, despite not having any sales. This can be a very important insight because it’s an opportunity to sell to Aaron. If he weren’t visible, we’d probably miss this. Also notice that February, March, and July all show up in our chart, despite there not being any sales.
In addition, you could set this up to show zeros in each of those blank spaces. I personally like to make this an option for the user by first creating a parameter:
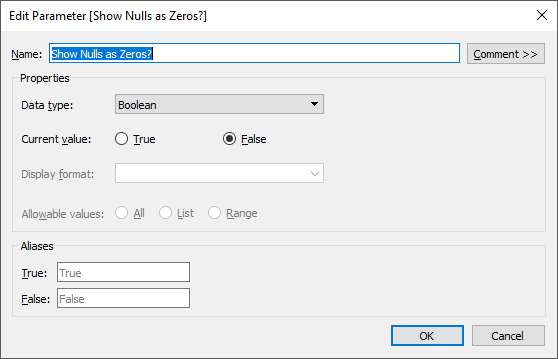
Then you can edit the Profit Ratio calculated field to make it convert NULLs to zeros if the option is selected:
// Calculate profit ratio.
// If parameter is set to show nulls as zero...
// ...then perform the conversion.
IF [Show Nulls as Zeros?] THEN
ZN(SUM([Profit])/SUM([Sales])
ELSE
SUM([Profit])/SUM([Sales])
END
Now, when the that option is selected, it will look like this:
Creating a Scaffold in Prep
Alright, we’ve done this in Desktop, so now lets take a look at how we can do this in Tableau Prep. In some ways, this is actually a bit easier as it won’t require us to perform any manual manipulation in Excel.
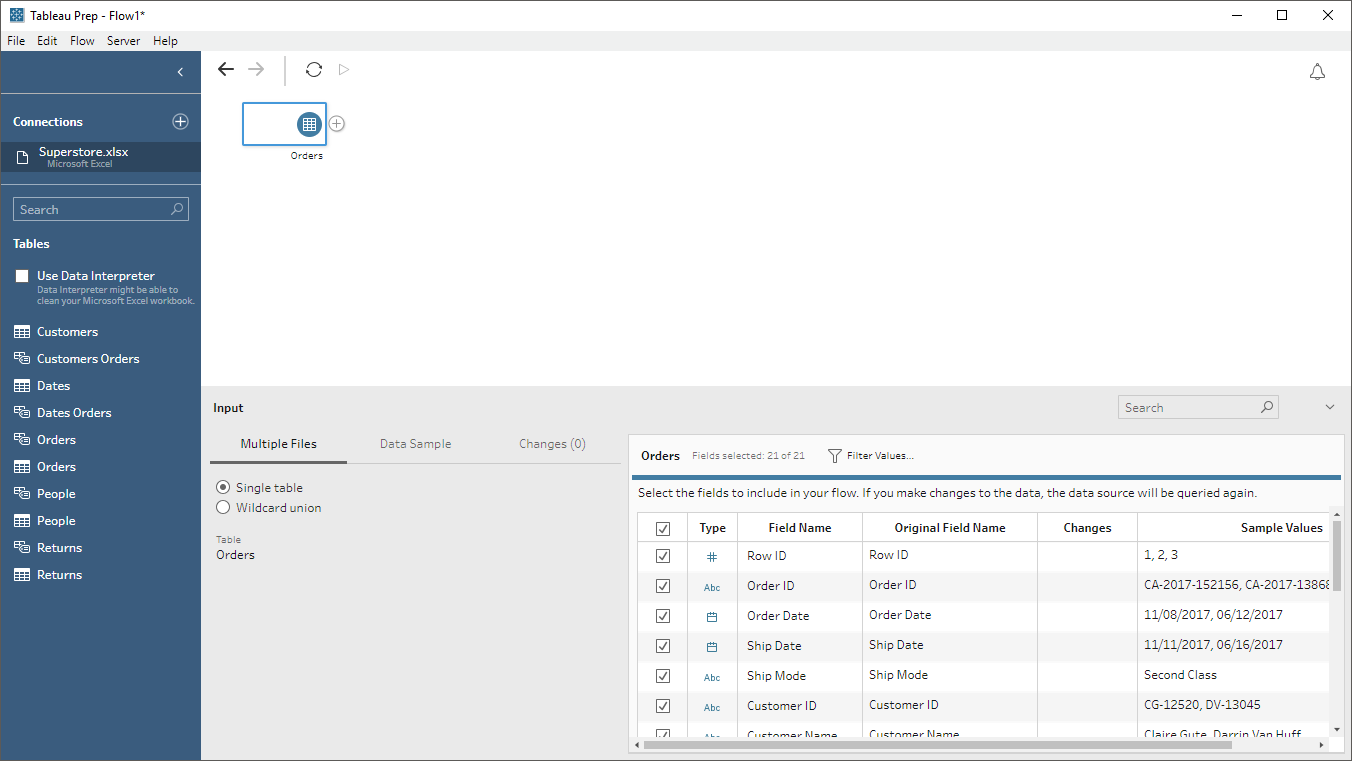
Start out by connecting to the data and dragging over Orders.
Now, just like in Desktop, we want to create a unique list of customers and a list of dates. Let’s start with customers. Create a new aggregate step and drag Customer ID and Customer Name to the Grouped Fields. You won’t need any Aggregate Fields.
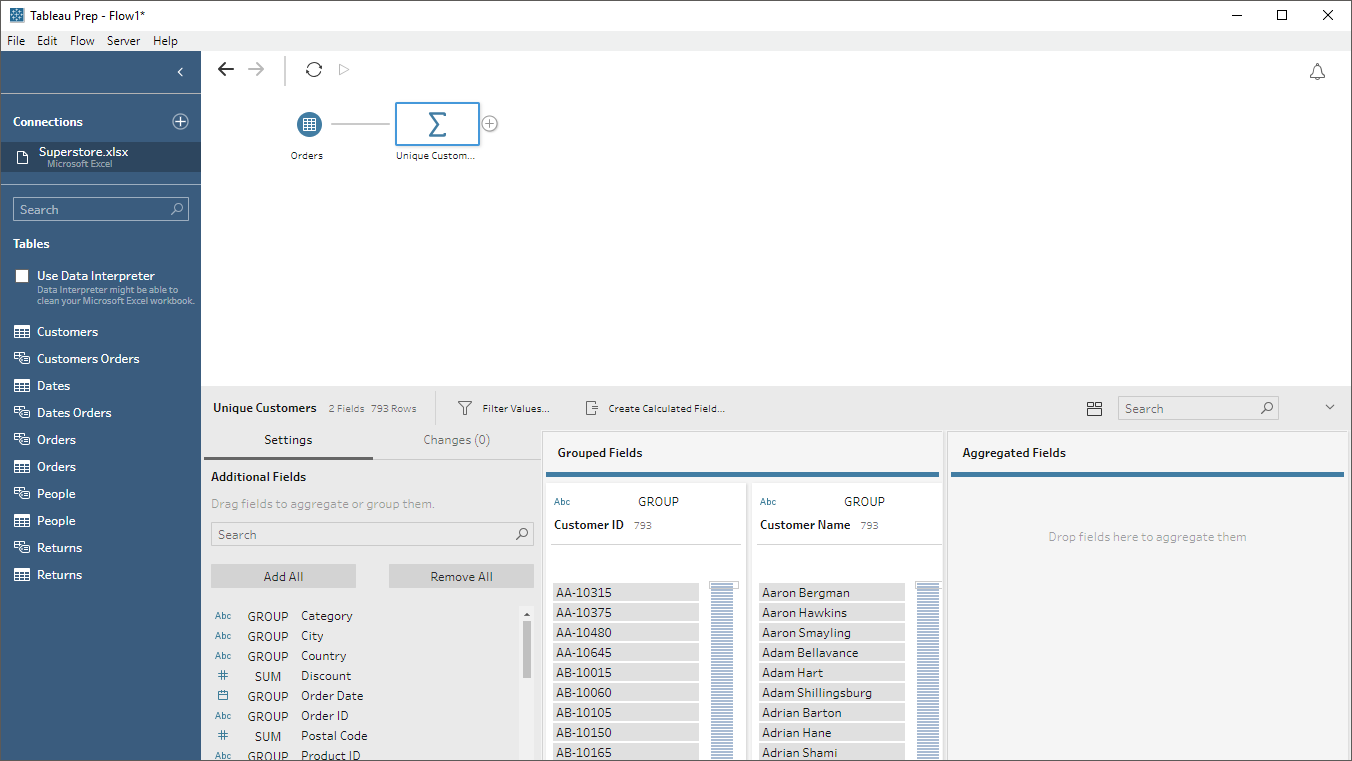
This simple step will result in a unique list of customers. Now let’s create our list of dates. Since we know our Orders table contains a comprehensive enough list of dates, we don’t actually have to create a list of every possible date like we did earlier—instead, we can use the unique list of dates from the Orders table and that should be good enough. So, create a new branch then create a new aggregate. Drag Order Date to the Grouped Fields.
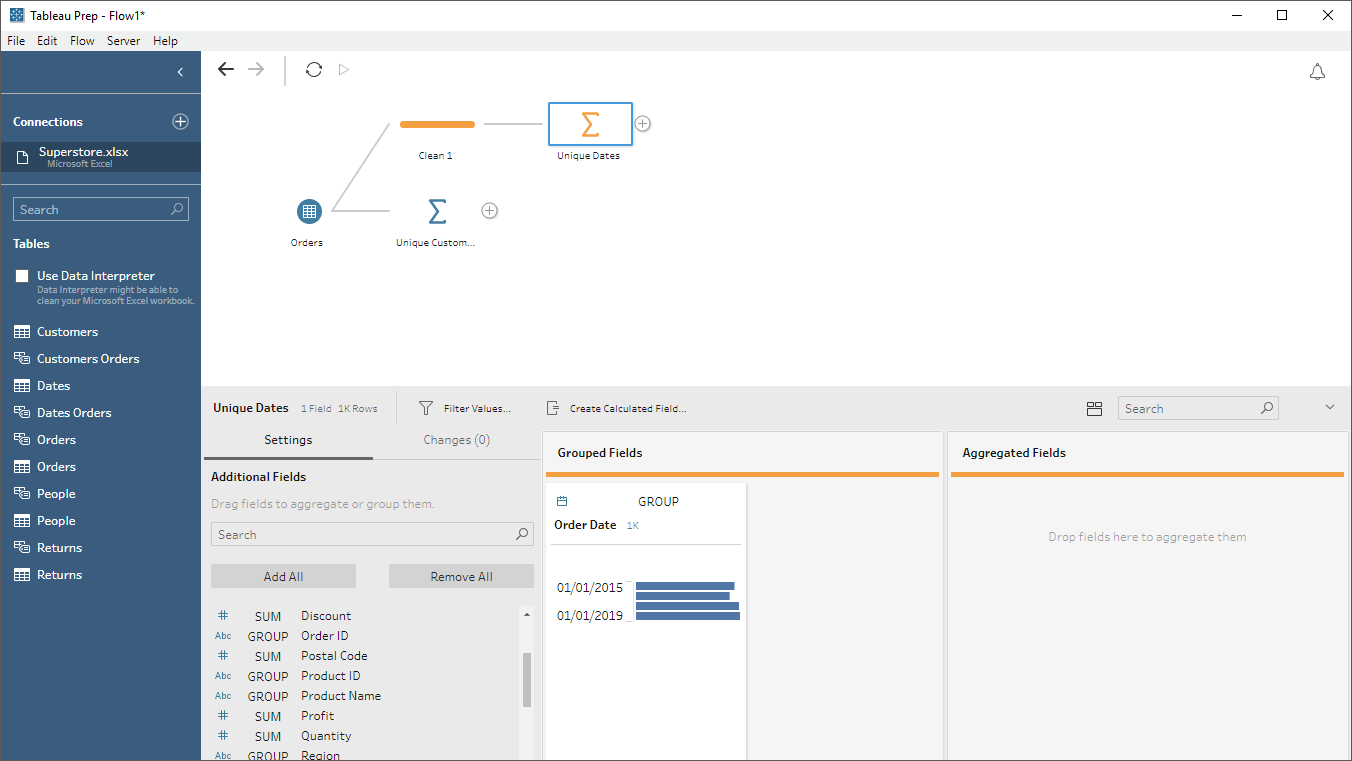
Note: When you create a new branch, Tableau Prep automatically inserts a clean step (Clean1 from above). As we’re not using that, you can delete it after creating your aggregate step.
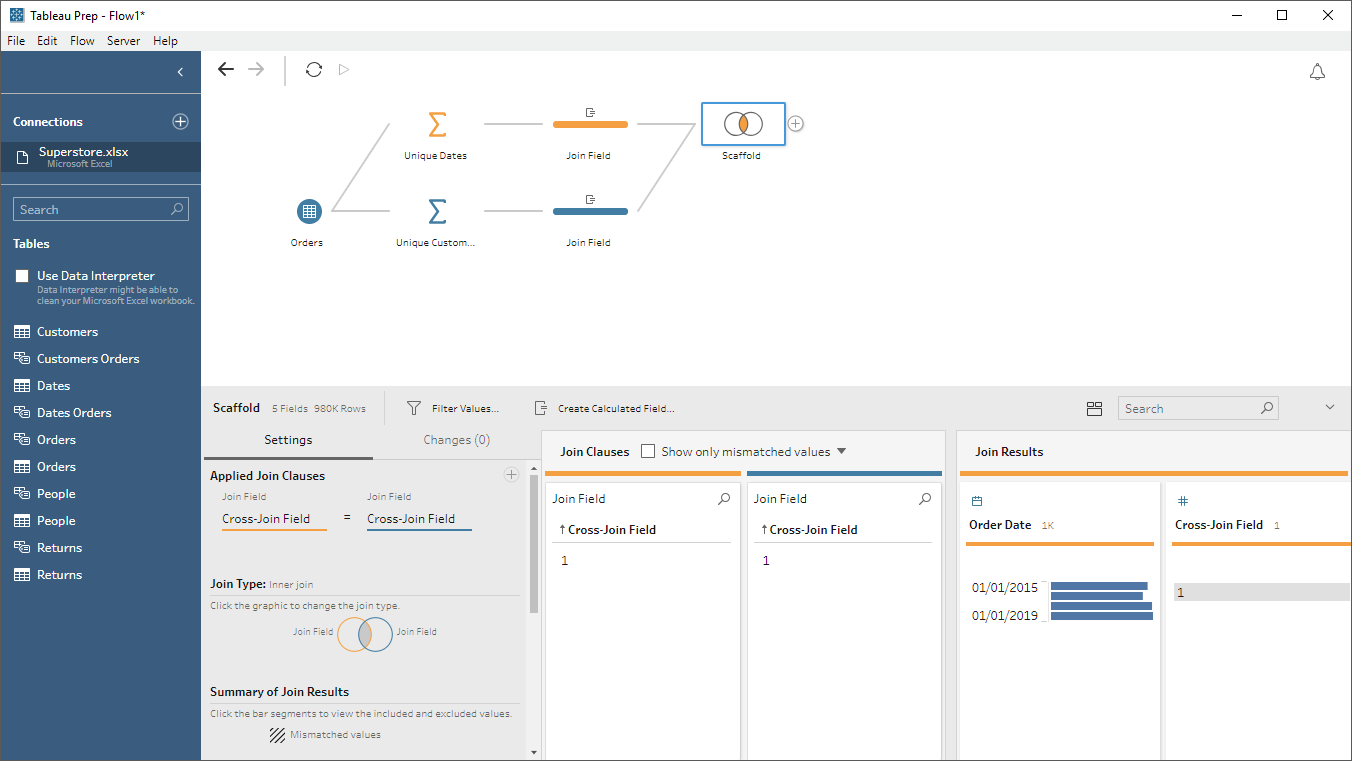
We now have our list of customers and dates, so we’ll need to cross join them together. Tableau Prep doesn’t allow join calculations, so I’m going to first create a clean step after each of the aggregates which will create a new field called Cross-Join Field with the value of 1.
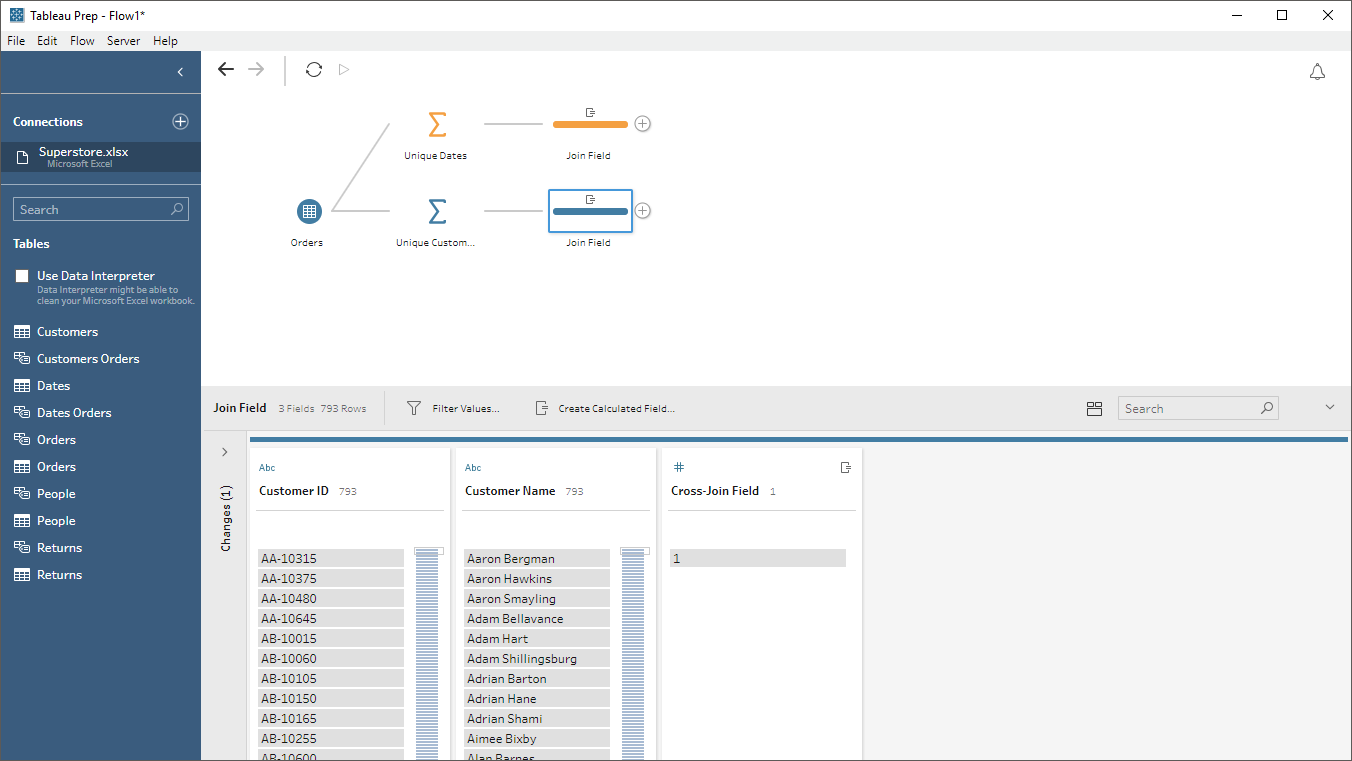
Now we’ll create a new join step and connect both of our branches as inputs to the join. We’ll then set up it up to join on the Cross-Join Fields. Again, since both are 1, this will match every customer in the customers list to every date in the dates list.
As we no longer need the Cross-Join Fields, I’ll create a clean step and remove them.
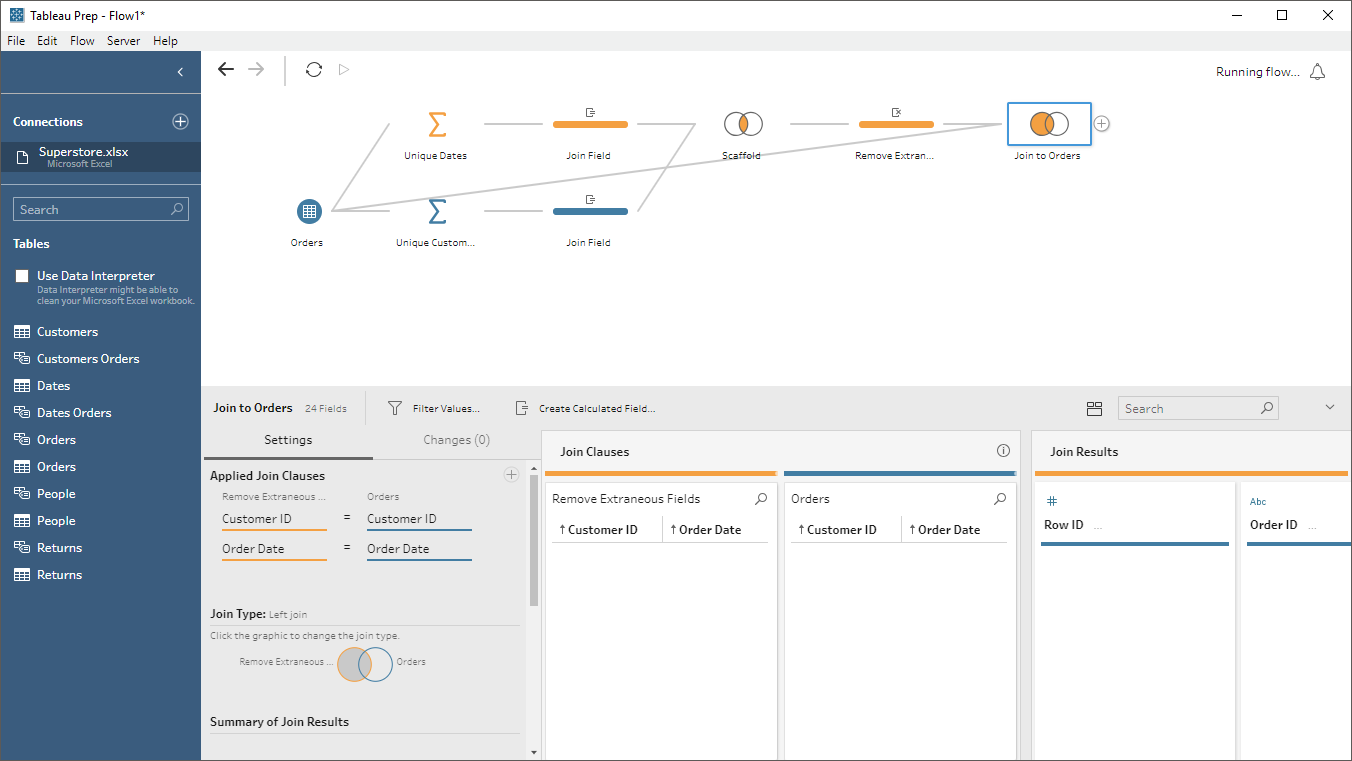
Our next step will be to left join this back to our original Orderstable, so create a new join step then drag the Orders object (all the way on the left) to act as a source to the join. Set up the join clause to perform a left join on Customer ID = Customer ID and Order Date = Order Date.
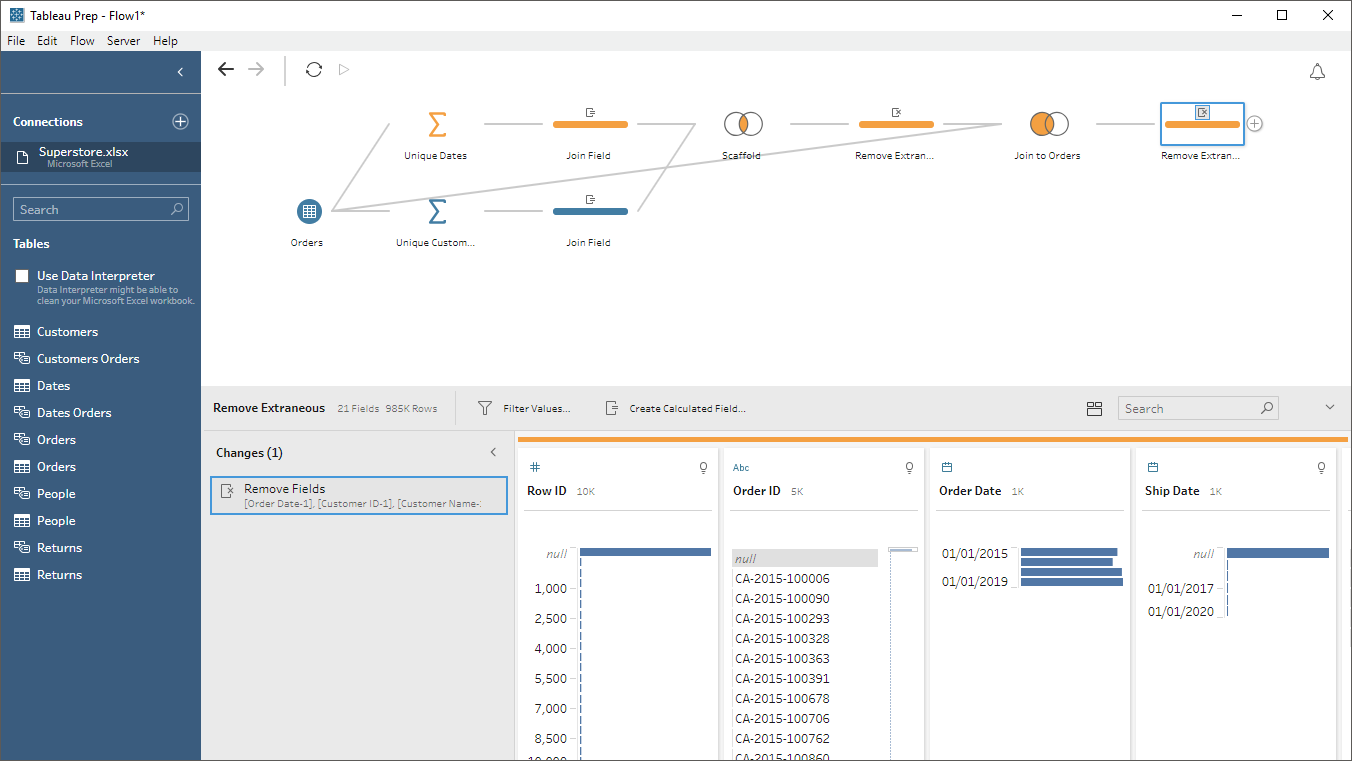
Since we’ll be using the Customer ID, Customer Name, and Order Date fields from the scaffold, we don’t need these fields from the Orderstable, so I’ll create a clean step to remove them.
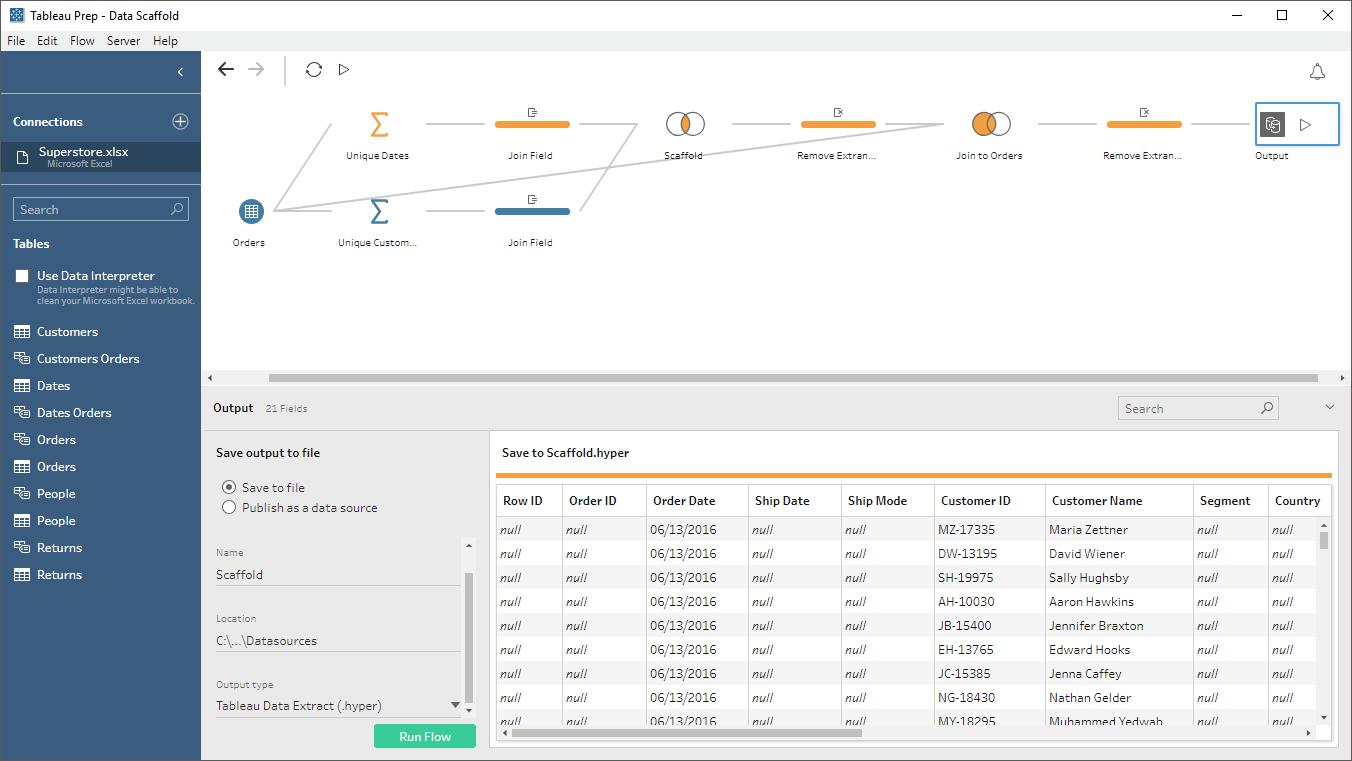
Finally, we can just add an output step. I’ll set it up to write to hyper.
The next step, of course, would be to bring this data source into Tableau and create our highlight table. As we’ve already done that, I won’t go through that process again, but I’ll just note that we’ll get the same exact results as the scaffold we created in Desktop.
Wrap-Up
While dates are one of the most common use cases for data scaffolds, there are lots of other interesting and creative use cases. Now that you understand the basic concept, hopefully you’ll be able to use it to address lots of different business challenges!
I’ve uploaded my final workbook to Tableau Public. It includes the highlight tables with no scaffold, with the Desktop scaffold, and with the Prep scaffold. I’ve also made my modified Superstore spreadsheet and my Tableau Prep workflow publicly available. You can find them both here.
Thanks for reading! If you have any questions, feel free to leave them in the comments section below or reach out to me directly.
Ken Flerlage, March 31, 2019


Awesome article! Very clear logic and clear description. This skill could be widely used in real project to resolve missing dates and IDs problem. Thanks, Ken!
ReplyDeleteThanks
ReplyDeleteHi, thank you !!
ReplyDeletejust one question: is there any difference between creating a field with value of 1 (on Customers and Dates) and setting it as an inner bleeding OR just making a "full outer" blending ??
There is definitely a difference between a cross join and a full outer join, but if you're doing a cross-join in tableau (using 1=1 join calculations) then I suppose you could do any of the different types of joins--they should all have the same result since all the values on which you're joining will be 1 (there will always be a match).
DeleteIs data scaffolding possible when a Tableau data source is involved? For the Tableau desktop example in your article, it seems like Microsoft Excel is just involved. Thoughts? Thanks!
ReplyDeleteTableau Published Data Sources have a fair number of limitations that would make this difficult. Are you able to get access to the source of that published data source? If so, you could build the scaffold based on that, then publish as a separate published data source. Not ideal, of course.
DeleteThanks for the feedback Ken! Historically I have been unable to access the source of the data source because the source is protected by the team that owns it. A Tableau data source was setup as the acceptable solution and it refreshes automatically whereas an Excel spreadsheet has manual upkeep (not desirable). If I can't get access to the source of the data source, it sounds like data scaffolding isn't feasible for what we want to do. The good news is that a logical data ecosystem is in the works and the Tableau data source may not be needed in a year or so. Thank you for your help!
DeleteHmmm. That's too bad. There may be some alternative solutions to this problem, but we'd need to know more. Sounds like it might be a great question to post on the Tableau Community Forums.
DeleteNice article it looks like the solution I need but I think I need an extra step.
ReplyDeleteI have a table with station information (customers in your example) and failure data per station (Datetime begin failure, Datetime end failure, failure type). I need to visualize the availability of the stations per day, if there is no error availability for that day is 100%. Since there are no datapoints when there are no failures, I think I need scafolding for these 100% moments. The problem is I can't get the join to work for failure data and the date list. Do you have any recommendations how to approach this problem? Thanks a lot!
Hi Ken,
ReplyDeleteNewbie question so please forgive me if I am wrong but while this seems to be a great solution to handle data for missing periods. Dont you think that if we scale this up to tens of thousands of customers over a period of several years, the data will grow exponentially which could cause performance issues due to the large scale? And is there any other way to handle such a scenario other than scaffolding?
This depends largely on your situation. But, I'd suggest checking out the following which provides you some options: https://www.dataplusscience.com/DataDensification.html
DeleteIf that doesn't work, then this could be a great question to as on the Tableau Community Forums!
very well explained, thank you for the great job.
ReplyDeleteI used to have this problem with the publish data source , we even try to make extract (but it was big data source and we could not do it). long story short we end up to use different data source which was smaller.
thanks- POUYA
Is there an issue using this method in 2020.3? Upgraded the workbook from 2019 to 2020.3 and the extract is not refreshing. Thanks!
ReplyDeleteYes, it should work. Are you getting any errors? Feel free to email me. flerlagekr@gmail.com
DeleteHi Ken,
ReplyDeleteGreat article, super helpful. One problem I am having though, is how to handle a scenario where you have 2 date fields. For instance, in 1 chart I am using the date that I would have created per above (and left joined on), but in another I am using a different date field that only appears for the rows the join.
What happens when I use the "different" date field as the column is that I get a bunch of nulls (since it sees all of the other records). Do you have any thoughts on this?
My only thought right now is just using a un-scaffolded data source for the "different" date field. Appreciate any thoughts.
I'd probably need to see some data. Any chance you could email me at flerlagekr@gmail.com.
DeleteHi Ken, this is exactly what I needed and thank you so much for explaining it so well. I do have a question when I am supposed to use 11 filters and 2 date parameters (From Date and To Date) as per our customer needs + I use 6 fields for calculations in my dashboard, so I am creating unique values for each of those and doing a join? I could email you the file to the above gmail account if you ever get a chance to take a look at this issue. So in my mockup example I have added 7 filters and when a user chooses one or the other we always want to see the two rows .
ReplyDeleteHello Ken,
ReplyDeleteIs this method still advisable when you have thousands of yearly records with start and end date ranging from 1 year to 10 year. I am dealing with membership data and a person can have a membership asset of any duration (in years). And I am to create a report showing monthly active members each month, every year.
Is it still an optimized solution in this case?
Thank you!
Pooja
I could see you potentially doing a scaffold with just the first (or last) day of each month. I don't think that would duplicate your data too much to cause significant performance issues. You definitely would not need a scaffold for each day as you don't need that level of granularity.
DeleteHello,
ReplyDeleteThank you so much for sharing this, it was really helpful and easy to follow. Although, I have a issue trying to populate on the highlight. I want to obtain as outcome the Profit Ratio by Month (0% or whichever the % is) and "N/A" for the months the sales person did not work for the business (i.e. a salesperson joined the business in the middle of our fiscal year). I am not being able to populate "N/A's"... Any suggestion/advise?
Thank you again !
I'd need to see a sample workbook. Can you email me? flerlagekr@gmail.com
DeleteSure! Thank you so much
DeleteHi Ken,
ReplyDeleteI really appreciate your tutorials, and your willingness to give back to the community, so cheers!!
I have a published data source that is a relationship between two logical data tables - one looking at test results, and one looking at vaccinations (they're related on a unique identifier).
Is it possible to create a data scaffold in an existing relationship such as this one? I'm looking for an overall date field that can count the # of tests on a certain date and the number of vaccinations on that same date (I'm simplifying the description slightly).
Thanks in advance for any advice or thoughts you can share!
Cheers,
Jim
Are you able to edit the published data source? If so, then a scaffold would work.
DeleteCan you please help me how append data of 5 files in Tableau prep
ReplyDeleteFeel free to email me. flerlagekr@gmail.com
DeleteI have a similar use case for many sheets are involved. I tried this method but not working :(
ReplyDeleteCan you email me? flerlagekr@gmail.com
Deletehi following ur steps i am able to view my individual category (based on selecting filter) on a calendar style. However when i filter to all categories the calendar is not showing. Any other ways i can do so that both all category and individual category can display on calendar whenever i filter? i am using my own data source.
ReplyDeleteThanks!
I'd need to see a sample workbook. Would you be able to message me? flerlagekr@gmail.com
Deletehi ken, i have msg u via email. Cheers!
Deletehi there! was curious if you've done any Tableau work on multiple date scaffolds? I have multiple data sources with different date fields and want to be able to view the measures from each source on the same timeline. I started with a 1=1 scaffold of hourly date data and the common fields (employee data in this instance) and then connected data sources in with date fields and the unique identifiers, but either the data replicates for each hour across the sources or I can't combine them together!
ReplyDeleteI've done some things similar to this. I'm sure we could find a solution, but I'd need to know more about your data. Could you email me? flerlagekr@gmail.com
Delete