
Travel/Drive-Time Maps in Tableau by Marc Schønwandt
Today I'm honored to be hosting a guest post by Marc Schonwandt. Marc has been doing some really cool work in Tableau recently, so if you haven’t already done so, go follow him right away. Marc is a Tableau and Alteryx Lead consultant and Tableau Certified trainer with Inviso by Devoteam, located in Copenhagen, Denmark. When Marc saw Tableau for the first time in 2015 he fell in love with the tool instantly and Tableau has helped him grow professionally and creatively every single day since then. You can follow him on Twitter @MarcSchonwandt, on LinkedIn or on Tableau Public.
I’ve always felt
there was something mesmerising about maps. Don’t you feel the same? Not just
because they are relatively easy to interpret and often beautiful nor because
they allow us (data practitioners) to play with things such as shadows,
excessive layers of data and other features that are usually not “recommended”
when working with data visualisations where simplicity is key. Rather, I think
the reason I love maps is because they are so “real”—the closest to something
physical and tangible that we have in the data viz world. They hold the truest
and most honest representation of data of any type of data visualisation. And I
do love a good and honest viz!
Recently, a
colleague of mine asked for input for a spatial analysis in Tableau. The
questions he needed to solve were things like “how many schools are within a 15 minute drive from X location?” and
“how many supermarkets are within a 30
minute drive from Y location?” I’ve previously seen some awesome drive
time/distance maps online, but never had a good use case to dive into it
myself. Until now that is, so let's get going! First, we’ll look at how the
drive time data was collected and then we pop into Tableau to finish things in
a blast.
Getting
Drive Time Data
To get my hands
on the drive time data I used the free HERE
Isoline Routing API. To use the API, you first need to
sign-up to their Freemium plan (no credit card required) and get an API key.
This part is simple and can be done in just a few minutes.
The API’s only required parameters are an origin and a
destination
(given by two pairs of WGS84
coordinates in the form <latitude>,<longitude>), a drive time in seconds, and a transportation mode,
which can be any of bicycle, bus, car, pedestrian, scooter, taxi, or truck. Lastly, you
can define the routing mode as either fastest or shortest, which
specifies the optimization that is applied during isoline calculation.
In my case, I
used my hometown, Copenhagen (55.671247,12.523785) and requested the isolines for the
drive durations from 1 to 90 minutes by car. In other words, I asked the API to
draw a line showing how far I could go in 1 minute, 2 minutes, 3 minutes ect.
all the way to 90 minutes. Luckily the API lets me bulk all these requests into
a single call. As the HERE API allows you to ask for driving distance all the
way down to the second level, I had to convert minutes into seconds. The final
request looks something like this. All the numbers at the end of the URL (which
make it a bit lengthy) are basically asking for 60 seconds, 120 seconds, etc.
https://isoline.route.ls.hereapi.com/routing/7.2/calculateisoline.json?apiKey=<APIKEY>&mode=fastest;car;traffic:enabled&rangetype=time&start=geo!55.671247,12.523785&range=60,120,180,240,300,360,420,480,540,600,660,720,780,840,900,960,1020,1080,1140,1200,1260,1320,1380,1440,1500,1560,1620,1680,1740,1800,1860,1920,1980,2040,2100,2160,2220,2280,2340,2400,2460,2520,2580,2640,2700,2760,2820,2880,2940,3000,3060,3120,3180,3240,3300,3360,3420,3480,3540,3600,3660,3720,3780,3840,3900,3960,4020,4080,4140,4200,4260,4320,4380,4440,4500,4560,4620,4680,4740,4800,4860,4920,4980,5040,5100,5160,5220,5280,5340,5400
As an avid
Alteryx user I naturally popped open Alteryx and used it to fetch the data from
using the call above. You can also download
the workflow here. But you don’t need Alteryx to make
this work. You can simply drop the URL into a browser window and it will return
the JSON. Then save the output as a JSON file which we will use in Tableau.
The
Tableau Magic
Once we are in
Tableau, the steps to generate an expanded animated map are relatively simple.
My Alteryx workflow generates a spatial file but you may also be using the JSON
method, so I’ll show you how to create the map using both options.
Spatial
File from Alteryx
If you’re using
the output from the Alteryx workflow, then follow these steps:
1) Connect to the
spatial file in Tableau.
2) Drop SpatialObj Built on the detail card.
This will add generated Latitude and Longitude pills onto the rows/columns
shelves.
3) Add TimeMinutes to the colour card, choose
your colour palette, remove the border (this helps to soften the appearance of
the map), and adjust the opacity to your liking.

JSON
File
The JSON output
has a few extra steps.
1) Use the JSON
connector to connect to your file. When prompted, click the “Select All” option
to select all schemas in the file.
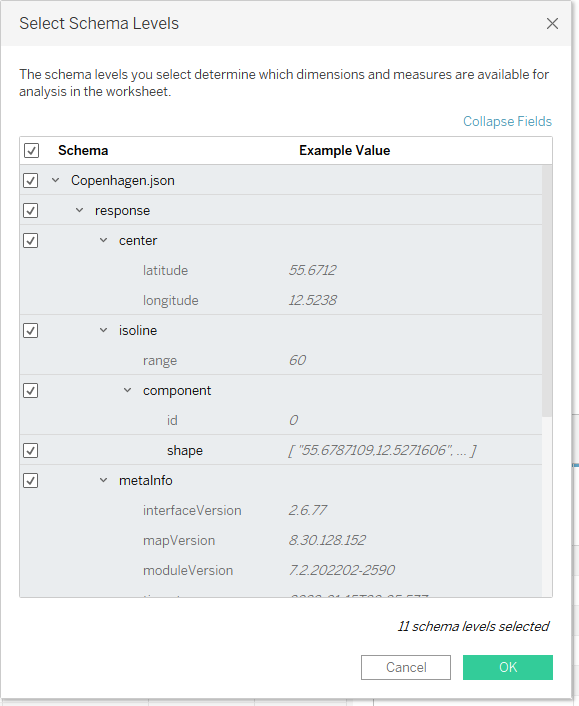
Note:
You don’t technically need all of the schemas, but it’s easier to just select
all of them.
2) The Shape field contains a comma-separated
Latitude/Longitude pair. In order to create the map, we need separate fields
for each, so create calculated fields to parse them out.
Latitude
// Parse Latitude from the shape.
FLOAT(SPLIT([Shape],
',', 1))
Longitude
// Parse Longitude from the shape.
FLOAT(SPLIT([Shape],
',', 2))
3) Set the
geographic role of the Latitude and Longitude fields.
4) Drag Latitude to the rows shelf and Longitude to the column shelf, then
right click each of the pills and change them to dimensions.
5) Create a
calculated field to convert seconds to minutes:
Minutes
// Convert range to minutes
[Range]/60
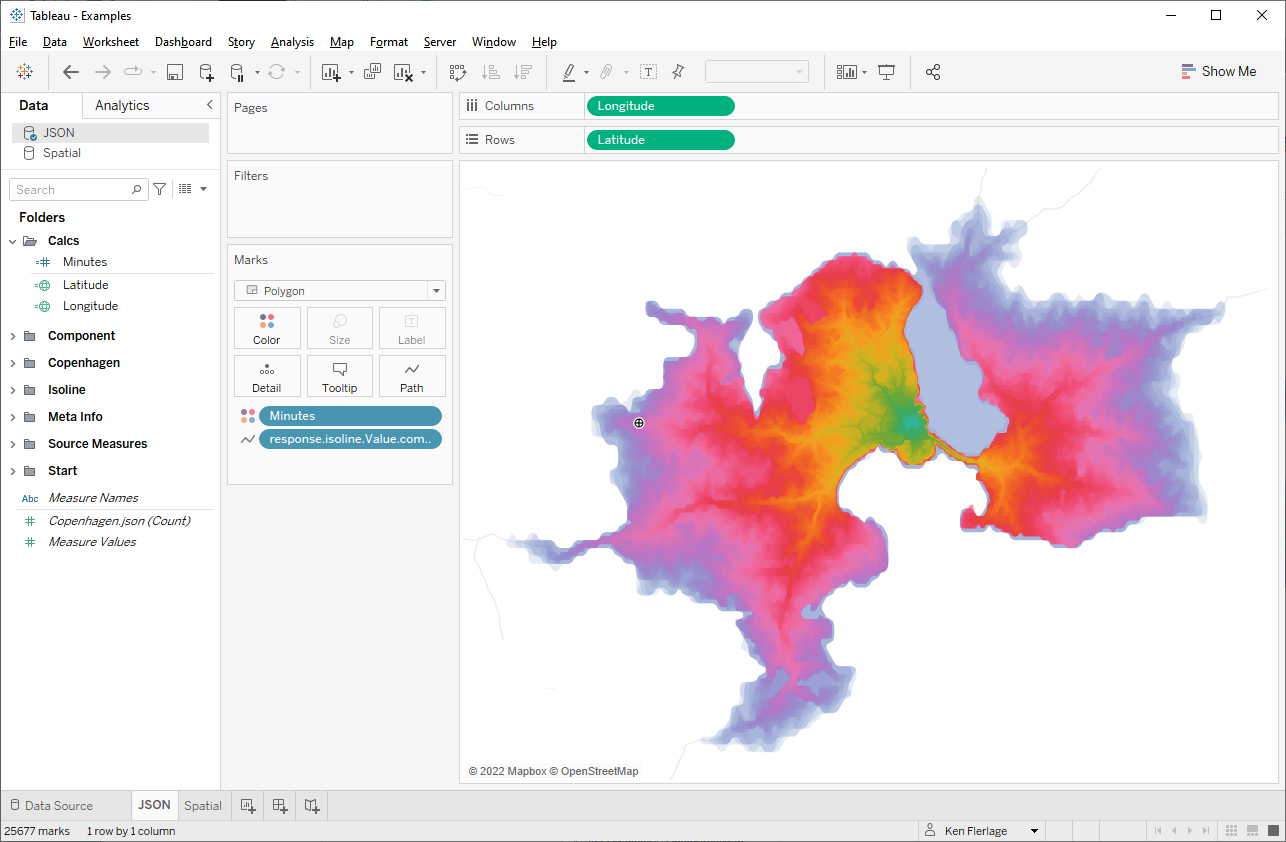
7) Drag Minutes to the colour card, choose your
colour palette, remove the border, and adjust the opacity to your liking. Note: You could also use the Range field here, but using Minutes allows you to create a legend
or tooltips showing minutes rather than seconds.
8) Change the
mark type to “Polygon” then drag response.isoline.Value.component.Value.shape.
Index (generated) to the path card.
And, of course,
with both options, you can add the appropriate field to Pages if you’d like to animate the map.
More
Examples
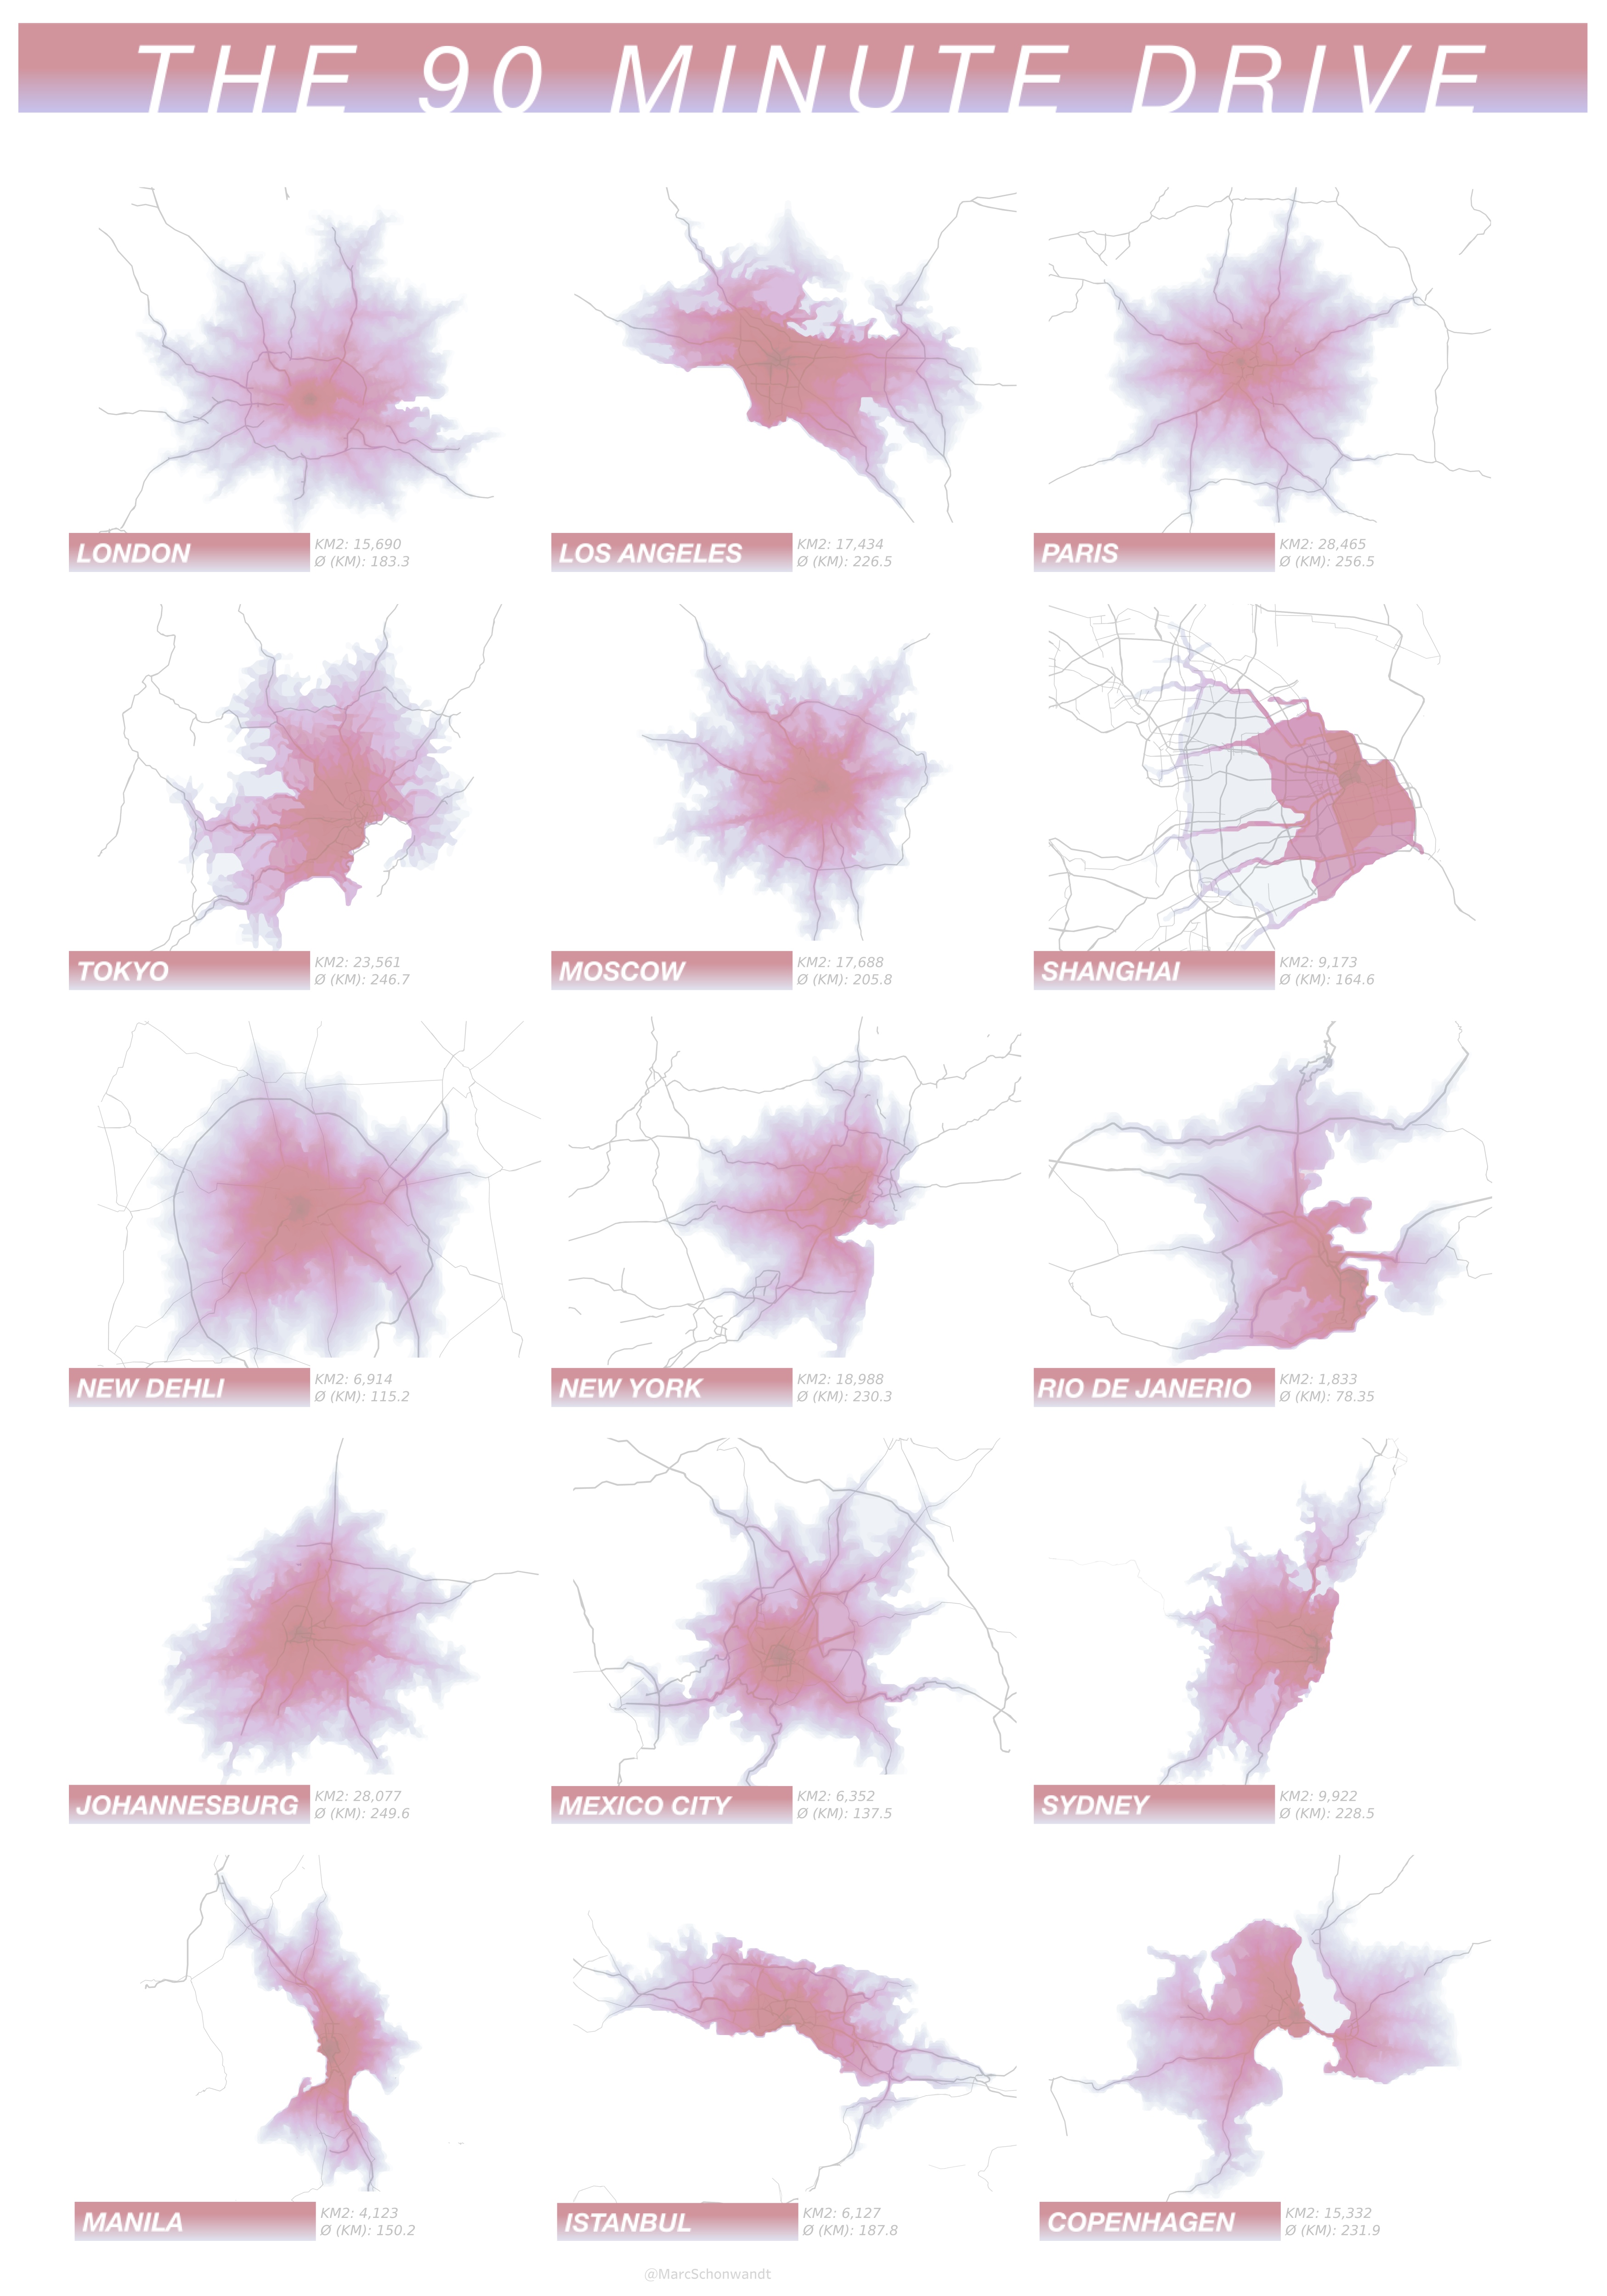
I was having a
lot of fun with this so I created drive-time maps for 15 major cities around
the globe. Click the image to see and interact with the full viz.
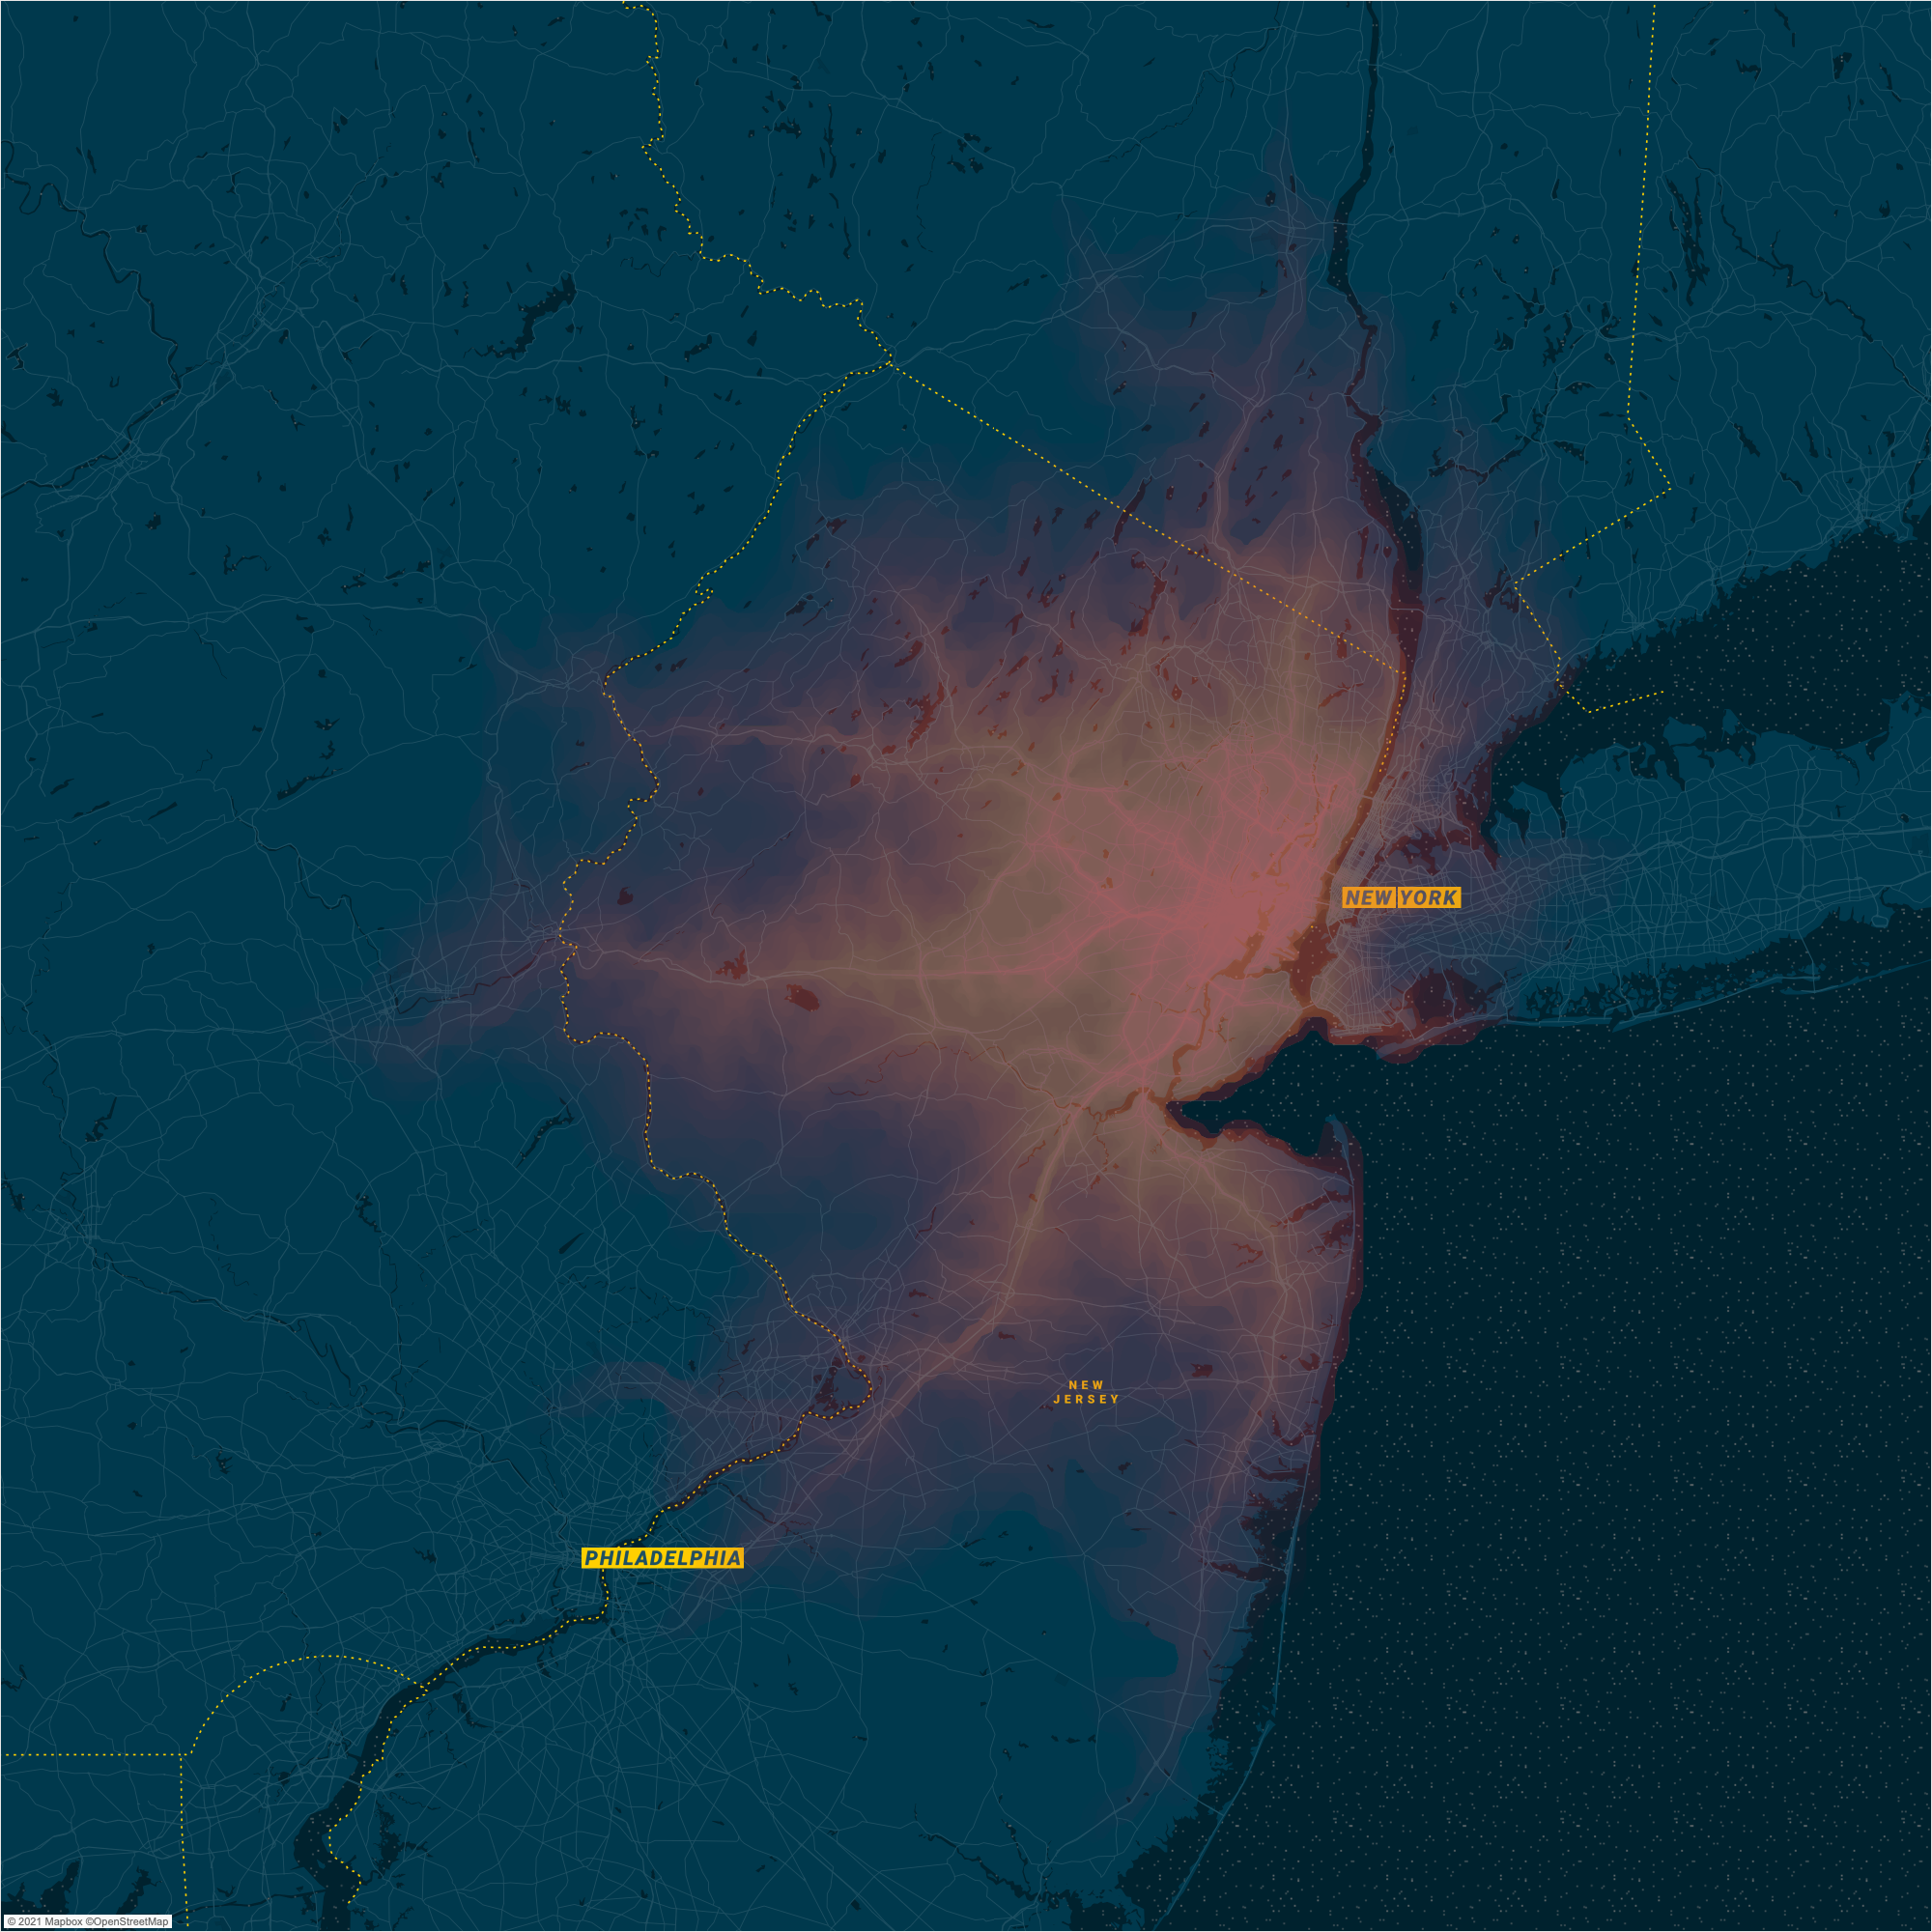
And here are a
couple of other examples, including an animation of London drive-times and a
more styled map of New York, using the free MapBox style, Labelmaker.
Recap
And there you
have it! Using this technique, you should be able to create your own drive-time
analysis, whether it be for creating a beautiful map of your own home town or
for something more practical for your place of business. Feel free to download
my workbook and experiment as desired, such as
using different Mapbox background maps to give it some extra flavour. And, if
you have any questions, feel free to drop them in the comments or reach out on
Twitter or LinkedIn. Thanks for reading!
Marc Schønwandt
February 21, 2022


man i wish the animations and/or pages in tableau worked like the gif animations...wonder if it's planned at all, or if we shouldn't get our hopes up
ReplyDeleteIt does. Check this out. https://datavis.blog/2020/01/21/tableau-animated-transitions/amp/
DeleteIs there a way to dynamically switch the Lat/Long in the URL based on the selection from Tableau dashboard that refreshes the JSON file? For example, if you had a cluster of stores and you wanted to know how much of the cluster fell within a distance or time of the selected store, it would swap out the Copenhagen coordinates in example above with the selected store's coordinates. Then the output would be saved and dashboard refreshed.
ReplyDeleteThat's a great question. I think there are a couple of potential solutions. First, if you know all the potential locations, you could generate the JSON data for all of them, combine that data, then bring it into Tableau. Then, when someone clicks a location, you could trigger an action to essentially "select" that location and show the drive time information. Another option might be to use the R or Python integration to call the APIs in real-time. That could get really tricky though and I'm not entirely sure it would work.
DeleteHow do you combine JSON data? Very new to JSON data and I am having trouble finding out online.
DeleteYou can actually just union them in Tableau: https://help.tableau.com/current/pro/desktop/en-us/examples_json.htm
Deleteafter I import the json to tableau, I don't see this field
ReplyDeleteresponse.isoline.Value.component.Value.shape. Index (generated)
I have a shape index (generated) that I can use but that is def not correct...
Sorry for the delay in responding. Did you figure this out? If not, can you email me and share the URL of the API call you made and the json file you dowloaded?
DeleteThanks for the awesome tutorial! I've successfully created a drive time map using the json file method. I went a step further and tried to use the INTERSECTS function to determine how much of a certain population was located within each drive time polygon. However, I'm having issues with the INTERSECTS function. Is this because Tableau doesn't recognize "response.isoline.Value.component.Value.shape. Index (generated)" as a geometry variable? Do you know how I can get around this?
ReplyDeleteresponse.isoline.Value.component.Value.shape. Index (generated) is not a geometry, so that won't work. Try using MAKELINE to create line geometries using latitude and longitude.
Delete