
Isolate a Map Component for Tableau

We’re once again excited to
have Sarah Battersby, our honorary sister, joining us for the sixth post in her
series about QGIS for Tableau users. Sarah has been a member of Tableau
Research since 2014. Her primary area of focus is cartography, with an emphasis
on cognition. Her work is focused on helping everyone to visualize and use
spatial information more effectively—without the need for an advanced degree in
geospatial. Sarah holds a PhD in GIScience from the University of California at
Santa Barbara. She is a member of the International Cartographic Association
Commission on Map Projections, and is a past President of the Cartography and
Geographic Information Society (CaGIS). Sarah can be contacted at sbattersby@tableau.com or on Twitter @mapsOverlord.
I’ve loved all of Sarah’s posts on QGIS and was excited to put
them into use for my recent whisky/ey maps vizzes. But I think I may be most
excited about this one because it’s so useful and it’s something I’ve always wanted
to do! I first saw this technique used by Jonni Walker to isolate a very
specific portion of a map (and hide everything else), so when Sarah suggested a
blog post to share the technique, I agreed right away! Okay, so enough of me,
let’s pass this off to Sarah!
Tableau provides a great set of global base maps to give context to your
maps. But sometimes you just want a portion of the base map to be visible so
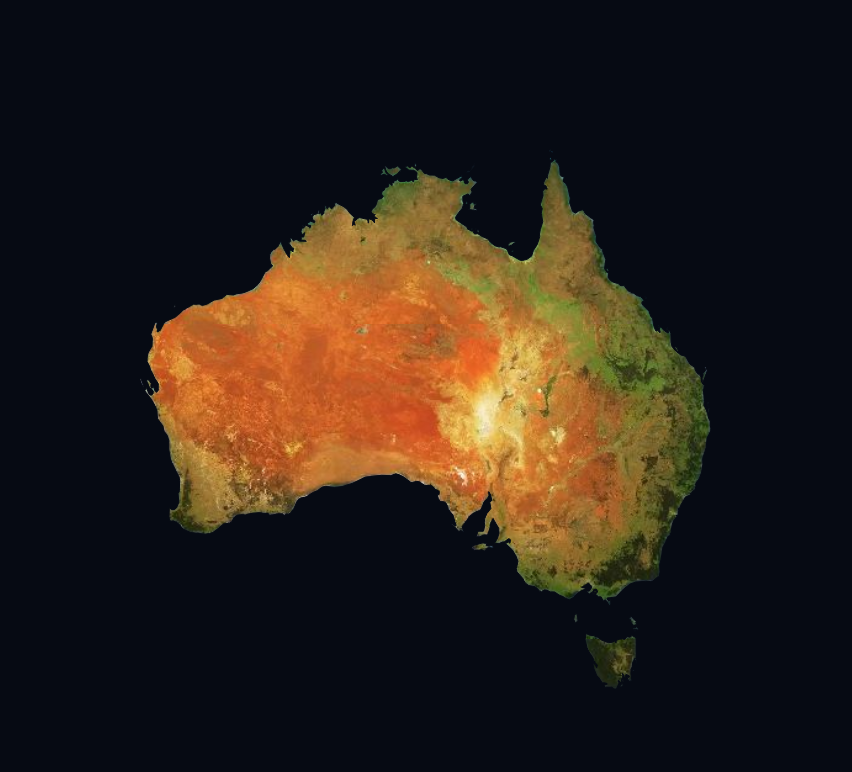
that you can highlight a specific area of interest. For example, let’s say you’re
building a map of Australia and want to use the satellite base map (I don’t
blame you—it’s lovely!!)

But you only want to show
Australia, removing all the stuff around it.
How would you do this? This is a
real example as Ken told me he wanted to do this exact same thing years ago and
could never figure it out, so he just created an image and edited it. But,
there’s an easier way! In this blog post, I’ll walk through a method to make
“clipping masks” using QGIS to mask the
parts of the base map that you want to hide. I like to call it “creating cookie
cutters”!
Note: While this
blog does not require any prior QGIS experience, it certainly doesn’t hurt. To
learn more about the basics of QGIS, please check out my prior posts on the
Flerlage Twins site—you can find them here: QGIS for Tableau
Overview
Here’s
a high-level overview of the steps we’ll take to make this happen.
1) Start with a spatial file that
has the boundary of the region we want to highlight in our map (this is,
essentially, our cookie cutter).

2) Use that cookie cutter on a
big rectangle that covers the rest of the base map
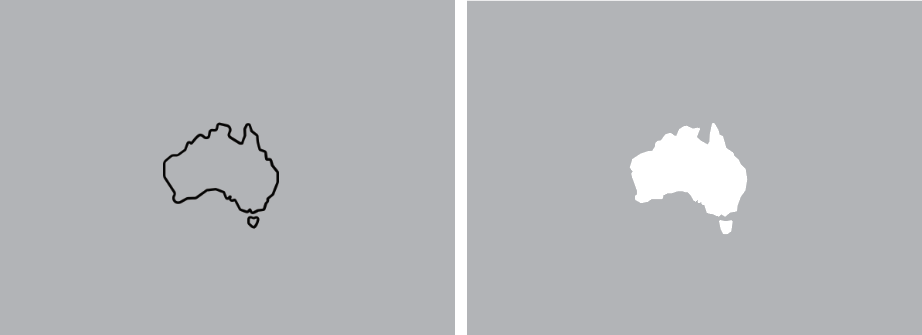
3) Export a spatial file with the
rectangle and the map-shaped hole.
4) Bring that spatial file into Tableau
and set it to match your dashboard background. The spatial file will cover everything
except for the cutout, allowing you to nicely isolate just that piece of the
map.
Sounds easy, doesn’t it? Well, I
have good news for you—it is easy!!
Collect
the Data
First you need some data for the
region that you want to use as your cookie cutter. If you don’t already have a
file with the boundary of the region you want to clip out, you can make a file
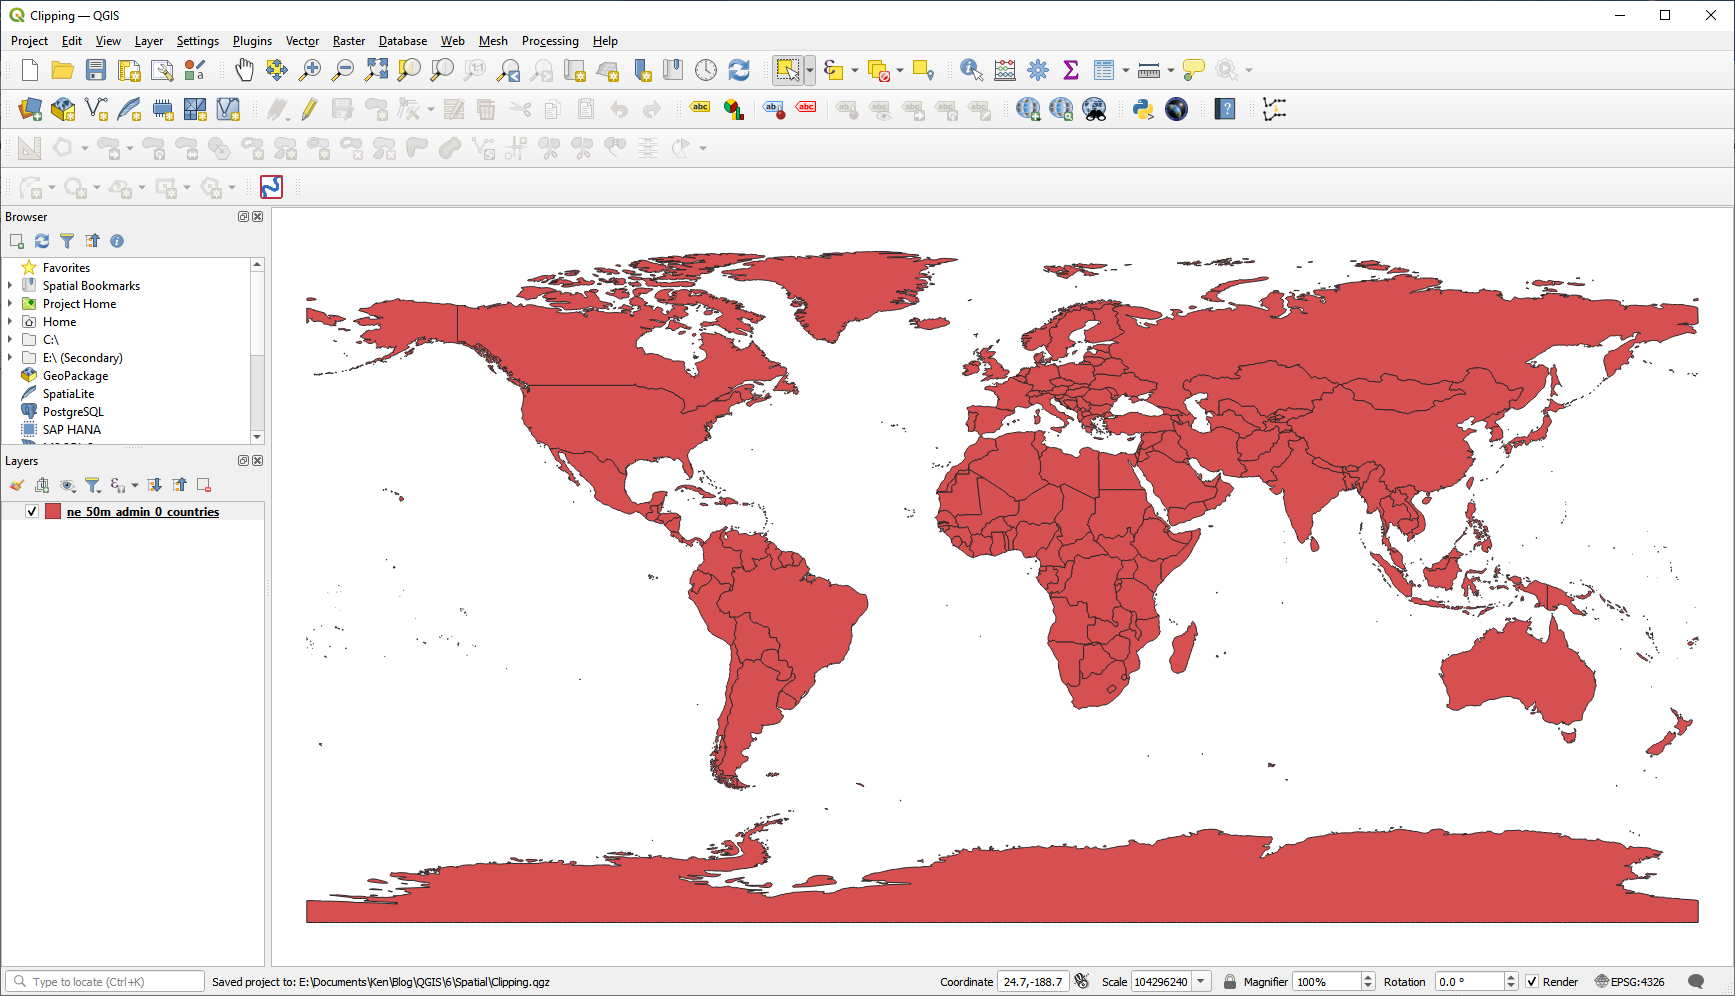
with those geographies using datasets like those provided in the Natural
Earth datasets. I will use the Admin 0 - Countries at their “medium scale”
(moderately detailed boundaries) for the example in this blog post since I am
going to clip out an Australia-shaped hole for masking the Tableau base map. We’ll
start by opening this as a vector layer in QGIS.
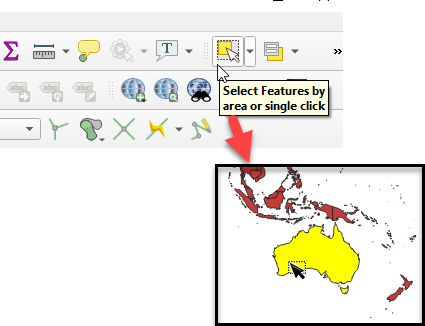
Since this file has all of the countries and I just want to
use Australia, I need to select Australia and save that as a new file. This is
done easily with the Select Features tool, and then clicking on the
polygon for Australia.
Once the polygon has been
selected, I just have to right click on the country dataset in the list of
layers, and Export -> Save Selected Features As…
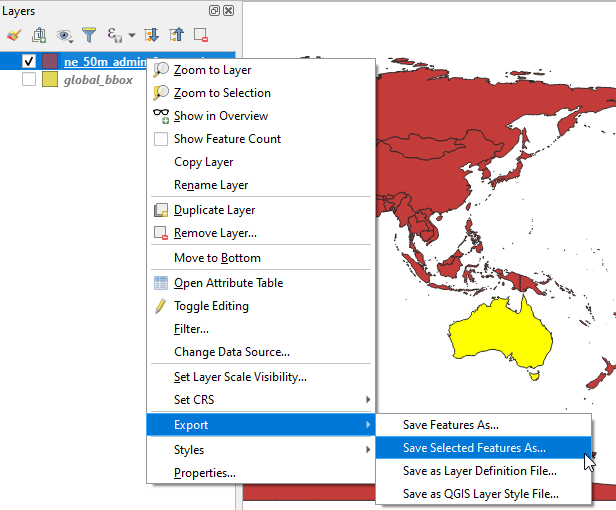
Save the selected features
somewhere that you will remember…
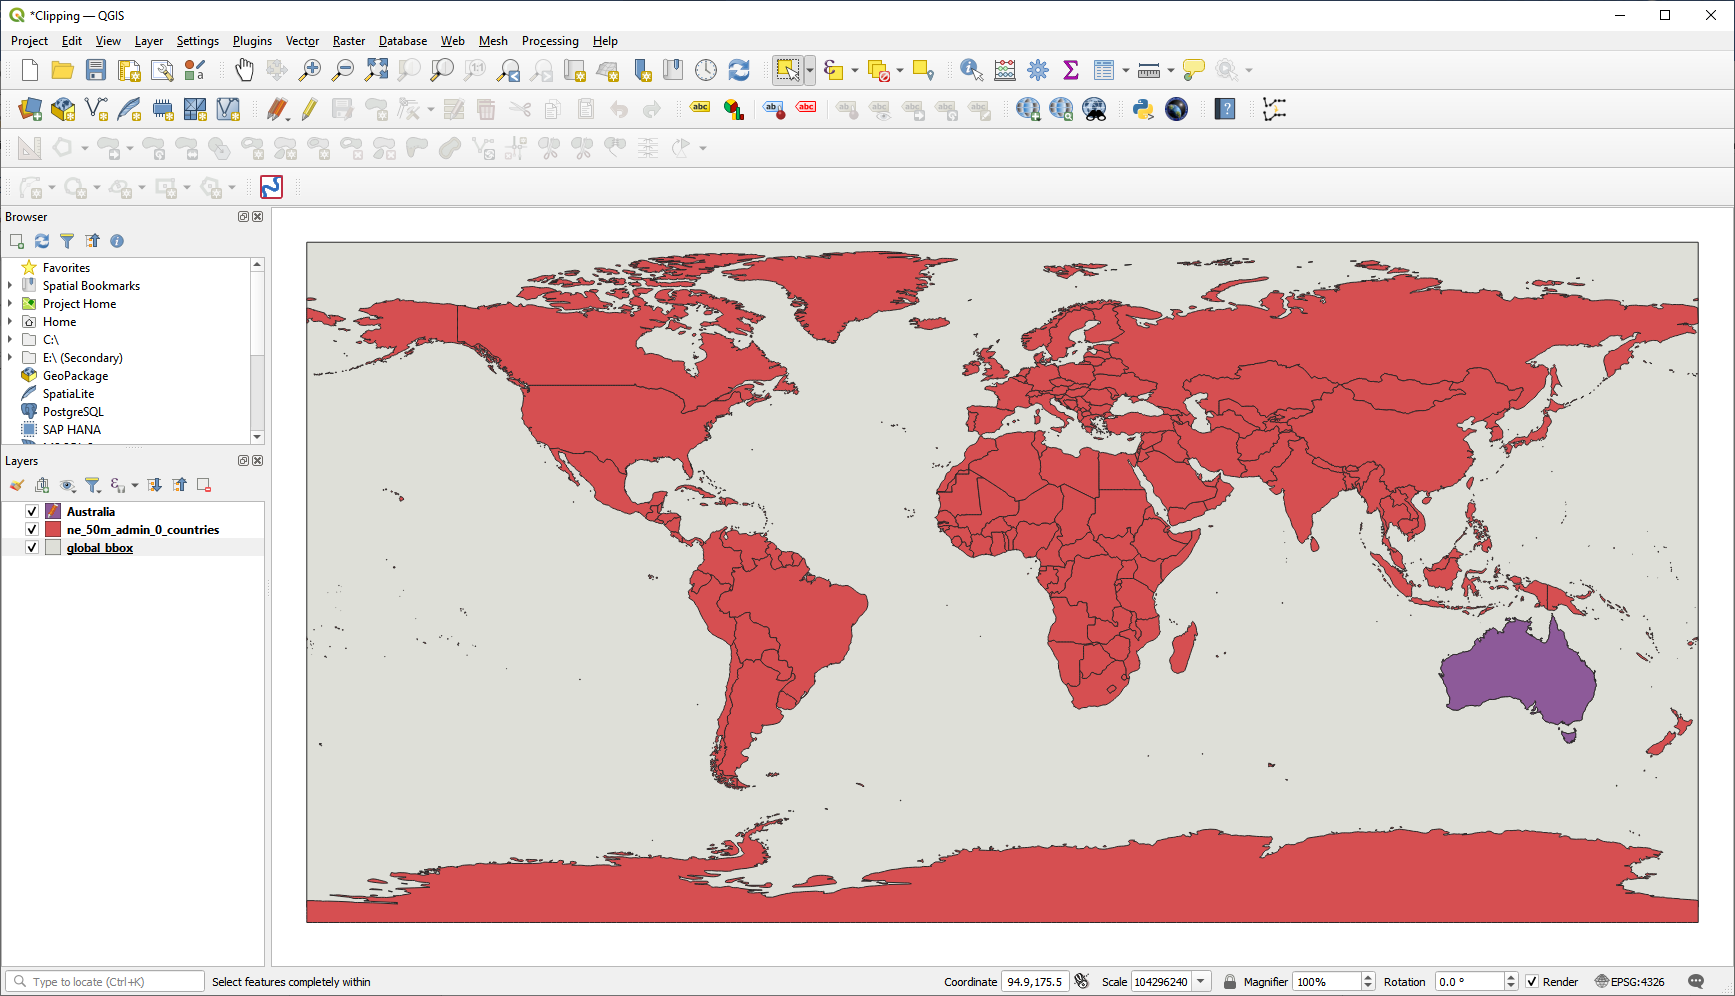
Next, you need a big rectangle that will cover up the entire base map. I’ve made a spatial file with this
boundary for you to use. You can find it here: Boundary Box Files
Cookie
Cutting Time
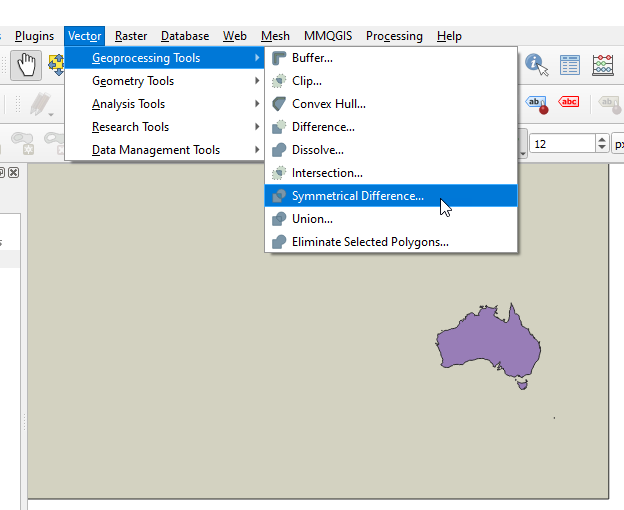
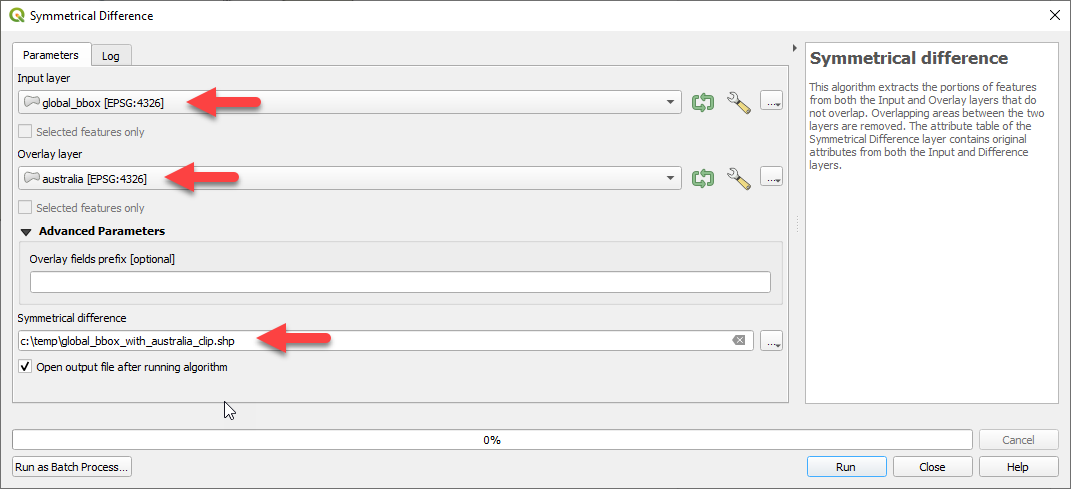
Now comes the fun part—we’re
going to use our Australia polygon to clip a hole in the global bounding box. We
can do this with the Vector -> Geoprocessing -> Symmetrical
Difference tool:
Use your global bounding box
spatial file, the Australia spatial file (or whatever region you saved), and
name the output… and click Run.
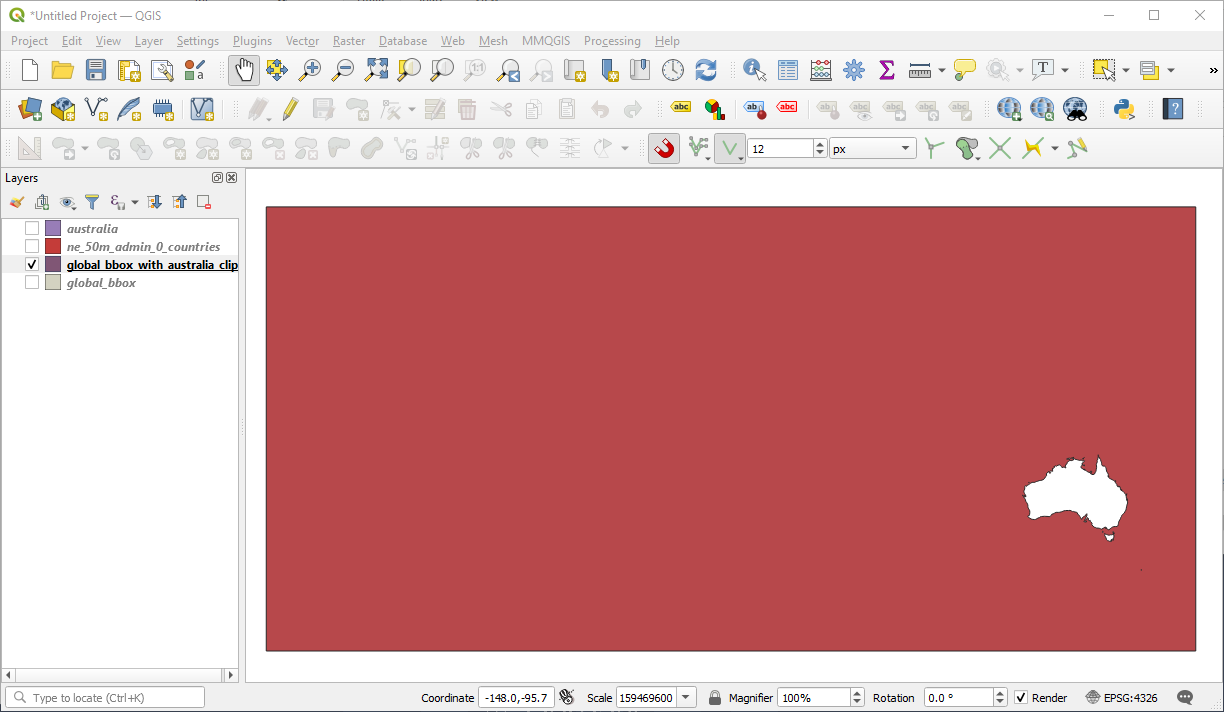
And, there you have it! One large rectangle with a little hole cut
out of it.
Onto
Tableau
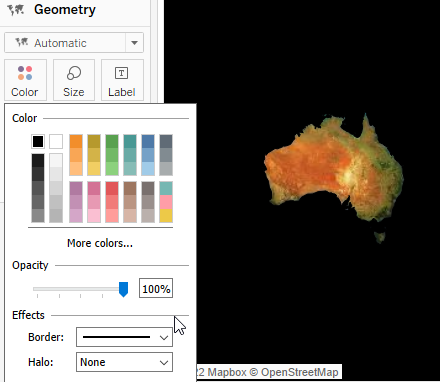
Now you can get to work in
Tableau. Create a data source using the spatial file we generated in the last
step above. Then drop Geometry onto the detail card to create your map. Change
the layer color so that it matches your dashboard background, bump the opacity
to 100%, make the outline color the same as the fill (or turn it off
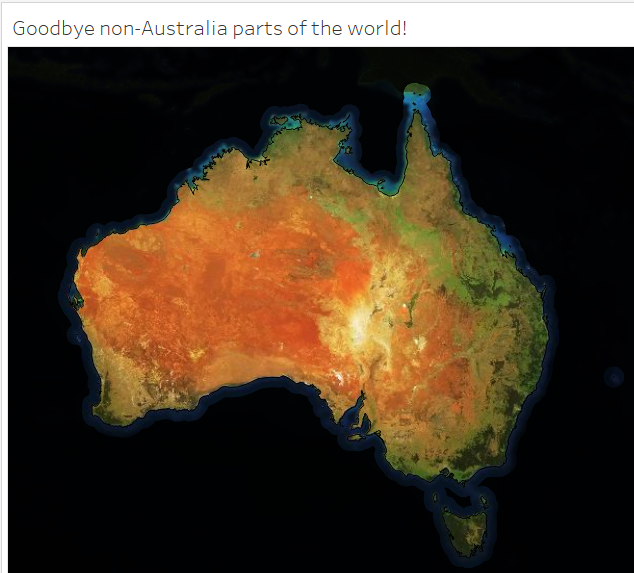
altogether), and turn off the halo. Goodbye rest of the world!
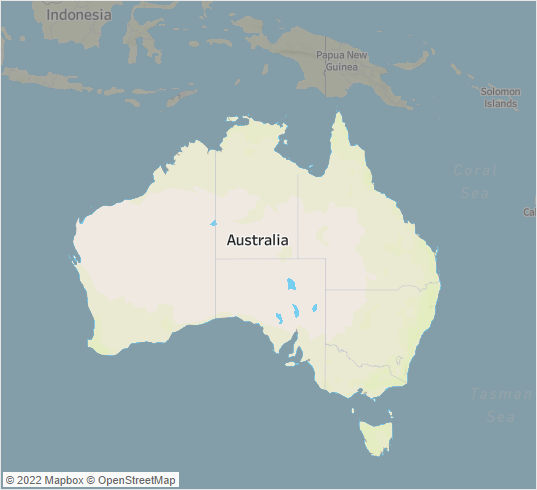
If you want some of the base map
to show through—maybe you don’t want everything to completely disappear, but
you just want to de-emphasize it, just adjust the color and opacity of your
mask polygon. For example, here is a nice, bright Australia (using the
‘Streets’ base map) with the surrounding regions pushed a bit farther back in
the visual hierarchy with a semi-transparent mask:
I hope this helps you get a little
bit creative with your map designs in Tableau! Enjoy and please be share what
you make—you can find us all on Twitter… Kevin (@flerlageKev), Ken
(@flerlagekr), and I (@mapsOverlord) would all love to see what you make!
Sarah Battersby
September 20, 2022


No comments: