
New Viz - Street Fighter Matchups

In speaking with Jennifer Dawes about a project she was working on, I got the itch to go do some trigonometry and create a radial chart in Tableau. (I know...I'm a nerd, but I think I'm kind of a cool nerd.) I went back and revisited some data related to Street Fighter V (I created a viz on it a couple years back). I'm not much of a gamer, but used to love the original Street Fighter games from 30 years ago.
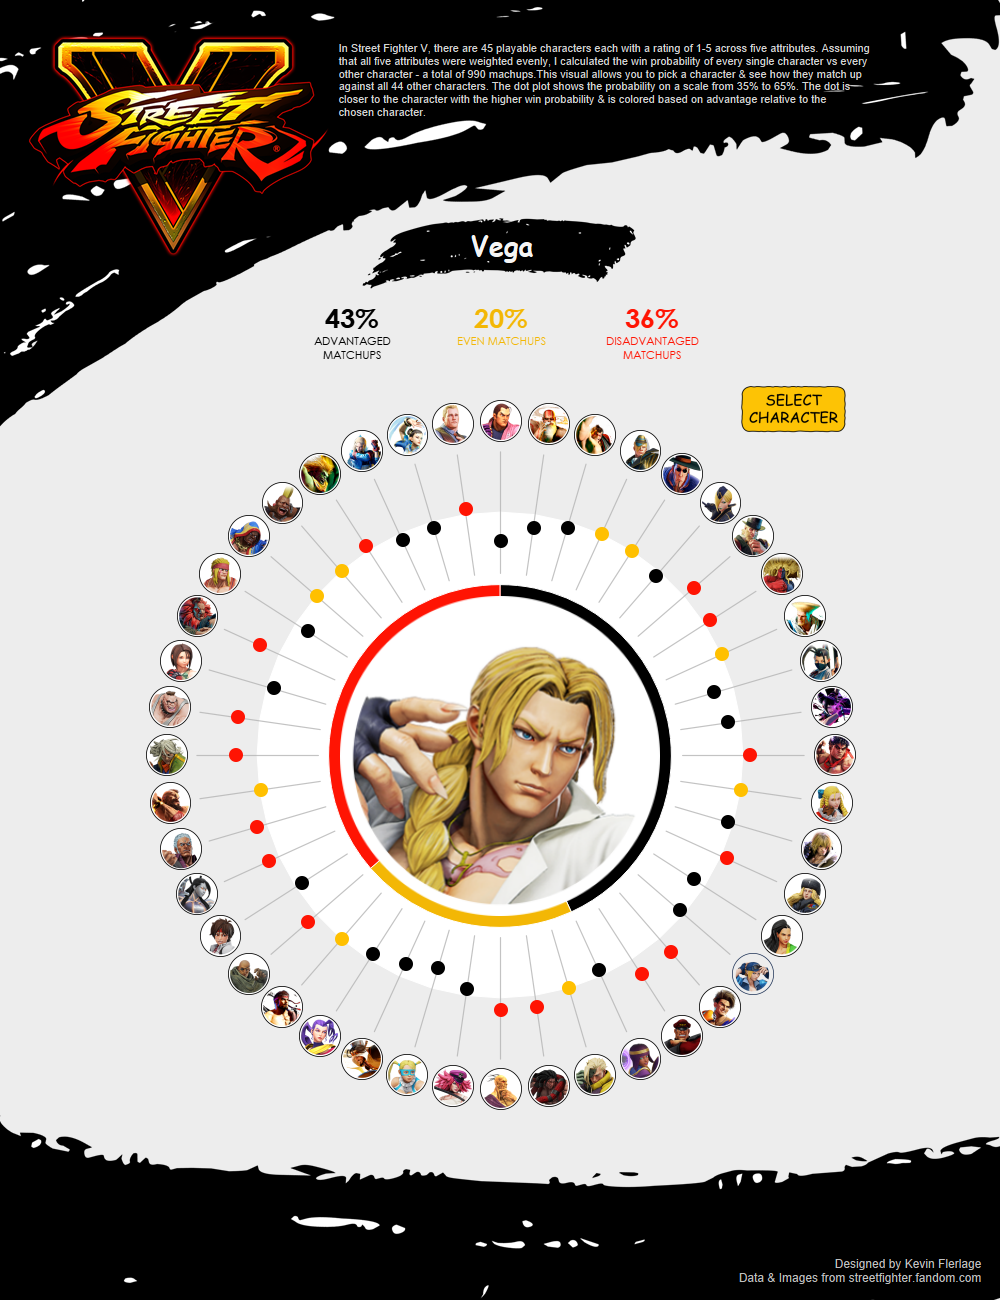
The data includes gameplay stats - ratings of 1-5 for 5 different attributes. So you can easily tell who's better than the others. However, I wanted to look at matchups, namely how each character matches up against every other character in the game. There are 45 characters, so that's 990 unique matchups! I pulled in the data, did a cross join on itself and started playing.
Ultimately, I designed a radial Cleveland dot plot. And I have to admit, I think it works quite well. If we were to do this vertically, because there are so many characters, I think it would require a scrollbar and I just think there is so much value to seeing everything on one screen. Truthfully, doing it vertically is probably the best, but this sure was fun and I think it came out great. You can check out the interactive version here or click on the image below.
Thanks!


No comments: