
20 Uses for Tableau Level of Detail Calculations (LODs)

Tableau Level-of-Detail
(LOD) calculations are incredibly powerful. In my opinion, every Tableau user
should know the basics of how (and when) to use them. Aside from the most
common use cases, such as eliminating the impact of duplicate records, they can
be leveraged in so many other scenarios. In this blog, I’ll share 20 different
use cases I’ve come across.
This blog is going
to be focusing on use cases, so I won’t be explaining level-of-detail
calculations or how they work. I’m assuming some upfront familiarity with the concept.
However, if you have not worked with LODs or would like a refresher, then here
are a few worthwhile articles:
Before getting
started, a few quick notes. First of all, I’ve published a workbook on Tableau Public which includes all of the examples shown below. I’ll also be referencing additional
examples from the Tableau Community Forums. All of my examples will be using FIXED LODs, which tend to be the most
heavily used, but the concepts are generally applicable to both INCLUDE and
EXCLUDE LODs as well. Depending on your data, the dimensions on your view, and
a few other factors, INCLUDE or EXCLUDE may be a better option. Finally, it’s worth
noting that some of these examples could be accomplished using table
calculations (in fact, Alexander Mou did exactly this in the his workbook, 20 Use Cases for Table Calculations). In some cases, these might provide a better solution, but I’m going
to focus on the use of LODs to address these problems.
1. Deal with Duplicate Records
Perhaps the most common use case for
LODs is dealing with duplicate records. These duplicates are generally caused
by one-to-many table relationships. For example, let’s say our Superstore People
table had 2 salespeople for each region. When you join Orders to People,
each order will then be duplicated (in our case, each order will have two
records instead of one). If you aggregate a measure, that result will then be
twice the value you actually want.

With the new data modeling capabilities Tableau is developing, this issue should be much easier to deal with, but
today the best solution is to leverage an LOD calculation. To deal with the
situation above, we could create the following LOD:
Sales LOD
// Eliminate the impact of duplicate salespeople.
{FIXED [Row ID]: MAX([Sales])}
In this case, we’re fixing on Row ID
as we know it’s unique to each row in our Orders table, then we take the
MAX of Sales. When we aggregate, we get this:

One question you may be asking yourself
right now is why doesn’t Tableau aggregate the value? For example, for Row ID
1, the LOD returns 262. But, since there are two records, shouldn’t summing it
(as I’ve done in the view above) cause it to be aggregated twice—once for each
record? The mystery of this lies in the coarseness of the LOD. Tableau
has a great discussion of this in the online help, so I won’t spend any more
time on it. However, I strongly recommend that you read the “Aggregation and
Level of Detail Expressions” section of How Level of Detail Expressions Work in Tableau.
2. Get a Single Aggregate
There are many scenarios where you may
want to get an overall min or max value. Let’s say you want to find the maximum
sales amount for any order. We can create the following LOD to do that:
Max Customer Sales
// Highest sales value for any given record.
{FIXED : MAX([Sales])}
We want to get the overall max across all
orders, so we’re not fixing on any specific dimension.
From here, we could use this value in
any calculated field without any real concern for what dimensions are/are not
included in the view.
3. Isolate a Specific Value
Sometimes you want to get an overall
aggregate so you can do some comparisons, as detailed above. But sometimes you
might want to get some very specific value then make that available for other
purposes. For example, let’s say you have the following data and wish to get
the last date upon which a customer purchased “Technology”

We can create the following LOD using
IF or IIF to isolate those values.
Last Technology
Order Date IF
// Get last date on which customers purchased
technology.
{FIXED [Customer Name]: MAX(
IF [Category]="Technology" THEN
[Order Date]
END
)}
Or, written using an IIF:
Last Technology
Order Date IF
// Get last date on which customers purchased
technology.
{FIXED [Customer Name]: MAX(IIF( [Category]="Technology", [Order Date], NULL))}
It’s worth noting here that, as shown
above, LOD calculations can be used for more than measure values. While
measures tend to be the most common usage, we can use them to return dimension
values as well.
4. Synchronize Chart Axes
Let’s say you have four charts on your
dashboard—one showing sales for the West region and one showing sales for the
East.
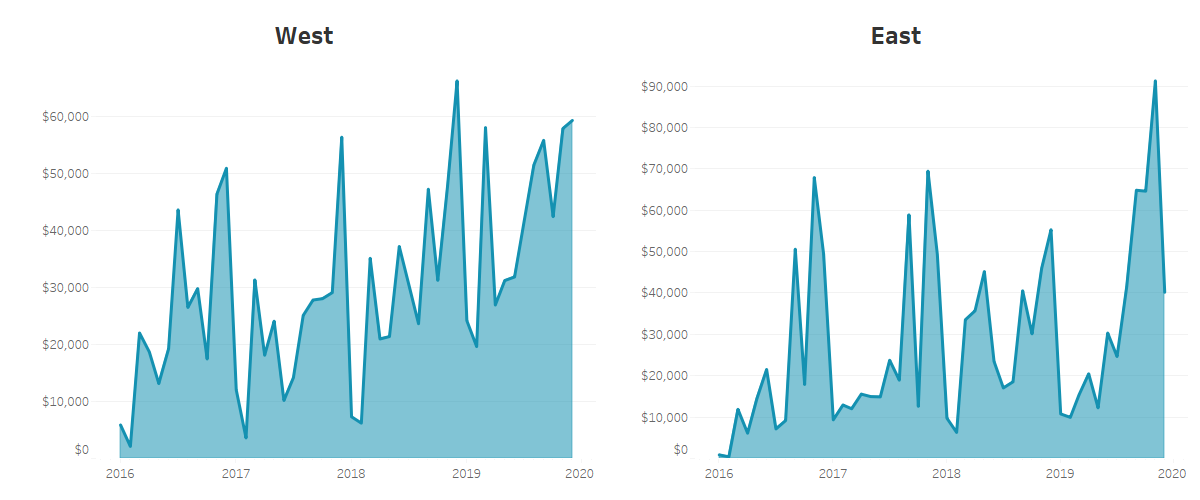
This looks pretty good, but there’s one
problem—the axes are not synchronized. In some situations, this might be okay,
but in many situations, it can lead to misinterpretation by your users. In the
above case, I believe it is absolutely best to synchronize the axes so that you
can perform a fair comparison between the two. You could fix the axes to a
specific maximum, but that could fall apart eventually as the sales amount
might eventually exceed the maximum you’ve set.
This is where we can leverage one of my
favorite tricks—using a reference line to create an adjusting fixed axis. We’ll
start out by creating an LOD to get the sum of sales, by month for each region.
The above shows monthly sales, so we’ll want to fix on the month.
Region Month Sales
// Sales by region and month.
{FIXED [Region], DATETRUNC('month', [Order Date]): SUM([Sales])}
Note: It’s critical that you don’t
simply fix on the month (i.e. MONTH([Order Date]) as that will give you a
discrete value from 1 to 12. You need to ensure that you include the year,
either by fixing on both year and month or by using DATETRUNC.
Then we can find the max of these for
the given regions:
Max Regional
Monthly Sales
// Maximum regional
monthly sales
{FIXED : MAX([Region Month Sales])}
We now have a single calculated field that
gives us the maximum monthly sales value across all regions. Now we drop Max
Regional Monthly Sales on the detail card and create a reference line that
looks like this.
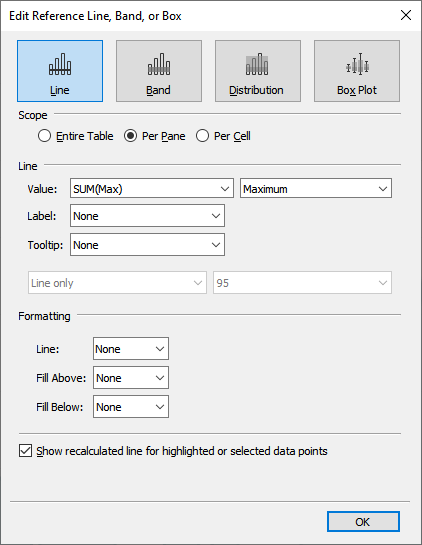
Note: Be sure to turn off labels,
tooltips, and the line so it’s invisible.
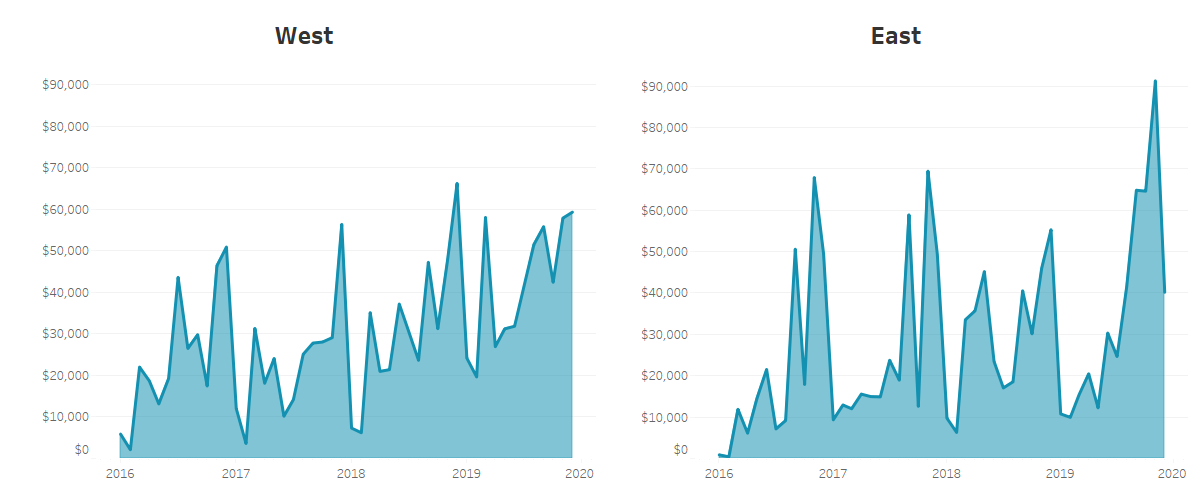
Once you’ve added the reference line to
all sheets, the reference line will keep all the charts’ axes synchronized. And
this is much better than fixing the axes because the calculated field will update
as the data changes.
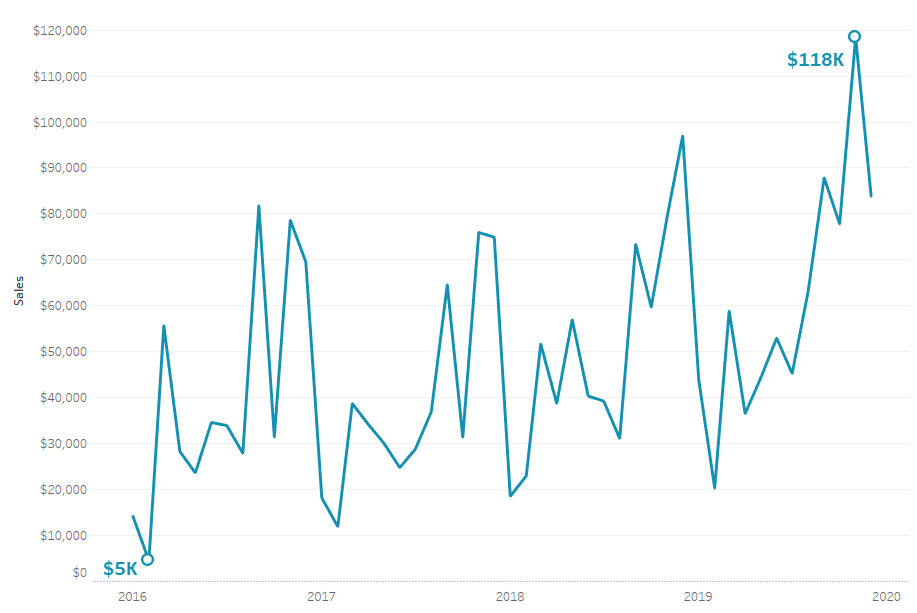
5. Find Min/Max in a Time Series
There are times when you may want to
find the min or max value in a time series. For example, perhaps you have the
following chart and would like to highlight the min and max values.

We can create the following LODs:
Min Value
// Minimum total sales for a given month
{FIXED : MIN({FIXED
DATETRUNC('month', [Order Date]) : SUM([Sales])})}
Max Value
// Maximum total sales for a given month
{FIXED : MAX({FIXED
DATETRUNC('month', [Order Date]) : SUM([Sales])})}
We could use these to do any number of
things, such as draw reference lines or bands. Or, with another calculated field, we
could plot points on the highest and lowest values.
Min or Max Sales
// Find a point for the min and max sales.
IF SUM([Sales]) = MIN([Min Value]) OR SUM([Sales]) = MAX([Max Value]) THEN
SUM([Sales])
END
Then, using a dual axis, we can plot
the points.
6. Get Related Data
LODs can be leveraged to find data
related to a parameter or a dimension in your data. For example, perhaps you
have a list of customer sales and wish to compare those customers’ sales to a
specific customer in the data set. You’ll likely create a parameter for selecting
the customer (we’ll call it Selected Customer). We can then use an LOD
to get that customer’s sales:
Selected Customer
Sales
// Sales for the customer selected in the
parameter.
{FIXED : SUM(
IF [Customer Name]=[Selected Customer] THEN
[Sales]
END
)}
Note: This is really just a variant of
example # 3.
You could then use that value to find a
variance between each customer and the selected customer.

Like other examples in this blog, I also
used this approach on my blog on Creating Zoomable Charts in Tableau.
7. Turn Row Values into Measures
Tableau generally works best when your data is “tall and skinny” so whenever I can put my data in that format, I try
to. However, sometimes math is just easier when it can be performed on the same
row. For example, let’s look at Superstore data where the Sales and Profit
measures are pivoted such that we have two columns, Measure (“Sales” or “Profit”) and Value.

In some cases, this may very well be the best structure for the visualization
you are trying to create. However, some calculations can be really tricky
because the values are on different rows. For example, how do you calculate
Profit Ratio (Profit divided by Sales)? In this case, a wider data structure
would be better because we could perform row-level calculations. So why not
have it both ways! We can use LODs to create measures for our Sales and Profit
values:
Sales
// Isolate sales.
{FIXED [Region]: SUM(
IF [Measure]= "Sales" THEN
[Value]
END
)}
Profit
// Isolate profit.
{FIXED [Region]: SUM(
IF [Measure]= "Profit" THEN
[Value]
END
)}

Now that we have these measures on the same row, the math is relatively
simple as we can just divide Profit by Sales.

For another example of this technique, see the following forums post: How to Divide Calculated Fields
8. Get Point-in-Time Data
Sean Miller is my favorite customer in
Superstore—his data contains so many interesting stories and I always use him
when teaching Tableau. So, let’s use him as an example here. What if we wished
to find the profit of Sean’s last order

We’d create an LOD like this:
Customer Last Order
Sales
// Get the sales for
the customer's last order.
IF [Order Date] = {FIXED [Customer
Name]: MAX([Order Date])} THEN
[Sales]
END
In some cases, you may want this value
to be available for other calculations. For example, let’s say you want to
compare each sales amount to the last order’s sales amount. To do this, we’d
need to wrap another LOD around this LOD:
Customer Last Order
Sales (For Comparison)
// Get the sales for
the customer's last order and make available for comparisons to other sales
orders.
{FIXED [Customer Name]: SUM(
IF [Order Date] = {FIXED [Customer Name]: MAX([Order Date])} THEN
[Sales]
END
)}
We could then create a simple
calculated field to get the difference as shown below.

For another example, see LOD to Perform Lookup by Maximum Date
9. Calculate the Mode
The mode of a set of numbers is the one
that appears most frequently. For example, if you have values 1, 2, 2, 2, 4, 5,
5, 6, 7, then the mode is 2 because it appears more frequently than all the
other numbers. A set of numbers can also have multiple modes. For example, if
the above set had another 5, then this would also be a mode. However, mode is
not as commonly used as mean (average) and median, with which it’s often grouped
in discussions of statistics. And there is no function in Tableau for
calculating the mode. Fortunately, we can use LODs for this.
For this example, let’s try to
determine the most common quantity of copiers purchased. I’ll start by
filtering my view by the “Copiers” sub-category. I’ll also add this filter to
context so that it computes before my LOD (see the tips section at the end for
more details on the Tableau Order of Operations). Then we can create the
following nested LOD calculation which will sum the number of records for each
quantity, then get the maximum of those sums.
Max Appearances
// Get the max
appearances of a given quantity.
{FIXED : MAX({FIXED [Quantity]: SUM([Number of Records])})}
Note: One interesting aspect of this
LOD is that we’re using Quantity, which is typically a measure, as a dimension.
In this case, because we’re fixing on it, Tableau will use it as a dimension
even though its default state is a measure.
We have the max number of occurrences,
so we just need to compare the number of occurrences of each number to the max.
Since there can be multiple modes, I’ll just create a calculated field that
returns TRUE if the number is a mode.
Is Mode?
// Is this number
the mode?
// Note: Could be
multiple modes.
IF {FIXED [Quantity]: SUM([Number of Records])} = [Max Appearances] THEN
TRUE
ELSE
FALSE
END
In this case, the most common quantity
of copiers purchased is 2, with 21 purchases of that quantity.

10. Get Value from a Set
Set actions resulted in some of the
most exciting innovation I’ve seen in Tableau since I started using it. But set
actions (and sets in general) can be hard to get your head around. When using
set actions (particularly before parameter actions were available), I commonly
used them to interact with a chart and save the value I interacted with for
later use. For example, in my blog on Creating Zoomable Charts in Tableau (yeah, I know I keep
mentioning this blog), I created a set on a date. When you hover over a given
date on an area chart, it triggers a set action and adds that date to the set.
But, typically, you’ll need to inspect the set to determine which values are
included. In the case above, I needed to get that date so I could then use it
in some calculated fields. Unfortunately, getting a value from a set isn’t
straightforward. The set itself just results in an IN or OUT value. But, that’s
where we can leverage an LOD:
Value from Set
// Get the
value selected in the set.
{FIXED : MAX(IIF([Your Set],[Field Upon
Which the Set is Built], NULL))}
The IIF above will look at each row in
your data and if the value is in the set, it will return that value. By using
an LOD with MAX, we can isolate that one specific value from the set and use it
in other calculated fields.
For more details on how this is used,
please take a look at the zoomable charts blog referenced above. I’d also
highly recommend that you check out the set actions work by Lindsey Poulter.
11. Use Aggregate as a Non-Aggregate
This is one of my all-time favorite tricks.
You’ve spent a ton of time building a calculated field, complete with
aggregations, to give you just the right output. But then you run into problems
because you try to mix that calculated field with non-aggregates or you try to
add totals to your view and find that the calculated field doesn’t sum as you
expect. In these situations, you can sometimes use an LOD to trick an aggregate
into acting like it’s not an aggregate. Because LODs always result in a
non-aggregate, you can then use that field just like any other non-aggregate
field. But be careful with this as it can be dangerous to aggregate what is
essentially already an aggregated value. Always make sure that what you’re
doing results in a statistically valid result.
I’ve used this trick a few times on the
forums and it’s pretty difficult to come up with a good example with Superstore,
so I’m just going to point you to those examples.
12. Compare Current & Previous Year
One of the most common questions I see
on the forums is how to perform year over year comparisons. Depending on the
person’s goal and the structure of their data, this question can have numerous
answers. One of those, of course, is LODs.
Let’s say that we want to plot a line
chart showing the 2019/2018 variance month. We can create a calculated field
like this:
Difference 2018 to
2019
// Difference in
2018 to 2019 sales by month.
{FIXED MONTH([Order Date]): SUM(IIF(YEAR([Order Date])=2019, [Sales], NULL))}
-
{FIXED MONTH([Order Date]): SUM(IIF(YEAR([Order Date])=2018, [Sales], NULL))}
Note: Generally, I try to avoid hard-coding
years into calculations like this as those will require updates when the next
year rolls around. Whenever possible, I use a calculation to get the correct year.
When that’s not possible, I’ll use a parameter. But for this example, I’m just
hard coding in order to keep it simple.
We can then plot this on a line or area
chart.

OK, I did it again. This is another one that does not require an LOD (Thanks Mina!!), but again, there are some situations where an LOD may be required to do such a calculation, so just be aware when you encounter it.
13. Find Occurrences of a Measure
13. Find Occurrences of a Measure
We can use LODs to find occurrences of
a specific measure value. For instance, what if we wanted to count the number
of orders over $5,000 (for this example, I’ll use a parameter called Order
Threshold). We could build a view like this:

But what if we just want to get count
of the orders? The above has a viz level of detail of Order ID. It then checks
if SUM(Sales) is more than the threshold. If we want an overall count,
we’ll need to remove Order ID
from the view, which will cause the normal aggregation of sales to be performed
at the new level of detail (the entire data set). So, we’ll need an LOD to force
our calculation to look at the sales for each order.
Orders Above
Threshold
// Return 1 for
orders above the threshold.
IF {FIXED [Order ID]: SUM([Sales])} > [Order Threshold] THEN
1
ELSE
0
END
We can then aggregate this using SUM to get the total number of sales
above the threshold.
14. Compare a Ratio to the Max
Comparing some value or ratio to a max
is a fairly common requirement. You may need to do it, for example, when normalizing
values for a parallel coordinates chart. An example I recently encountered on the forums required the user to color bar charts in
the context of a given category. For example, he had something like this,
plotted for a few sub-categories.

Each bar was colored by the total sales
amount. The problem was that some sub-categories, such as Appliances, have much
lower sales than others. So the color is never dark. Instead, he wanted to use
color to show the magnitude of the sales within the context of each sub-category.
In that case, the bar for Appliance sales in August, 2019 would be dark because
it is the highest month for that particular sub-category. To do this, we need to
find the sales for each month then compare that to the sales for the highest
month’s sales (for the given sub-category).
Month Sales % of
Max
// For each
sub-category, get the % of the max.
// Use this to color
each sub-category on its own scale.
SUM([Sales])/ATTR({FIXED [Sub-Category]: MAX({FIXED [Sub-Category], DATETRUNC('month', [Order Date]): SUM([Sales])})})
We can then use this on the color card,
setting the color range to go from 0 to 1 (0% to 100%).

15. Compare Subset to Superset
This example is similar to some of the
other examples shown here, but slightly different. There are many times when
you may wish to compare a subset of your data to a superset. For instance, let’s
compare the average sale amount for each state to the national average. Because
we’ll have a viz level of detail that includes State, we’ll need an LOD
to calculate the national average.
National Average
Sales
// Average sales
amount for the entire country.
{FIXED [Country/Region]: AVG([Sales])}
We can then do the math to compare each
state’s average to the national average.

For another example of this use case
see Comparing Per Capitato National Average
16. Get First Occurrence of an Event
Sometimes, you may need to get the
first occurrence of some event. For example, perhaps you wish to find the first
time that someone purchased more than 10 packs of “Staples” (seriously, why
would you need so many staples??)

We can clearly see that April 13, 2016
was the first time. But how would we create a calculated field to get this
value? The following LOD should do it.
First Purchase Over
10
// First purchase of
a quantity more than 10.
{FIXED [Product Name]: MIN(
IF [Quantity]>10 THEN
[Order Date]
END
)}
For another example, see Find the Year a Value First Occurs.
17. Find Record Meeting Some Criteria
Do you know how many Superstore
customers have purchased only one product category? We could easily get a list
of these customers by dragging Customer Name to our view then filtering
on COUNTD(Segment).

But what if you just wanted a count of
the customers? For this, we’ll need an
LOD that counts the number of categories each customer purchased.
Bought One Category
// Did the customer buy only one category.
IF {FIXED [Customer Name]: COUNTD([Category])}=1 THEN
1
ELSE
0
END
We can then simply sum this measure to
get our total.
Here are a couple of additional examples
of this technique from the forums:
18. Count Items Selected in a Filter
Have you ever wanted to count the
number of items selected in a filter? You may want to do this to simply show
the user how many items they’ve selected or you may wish to take some other action
based on this number. In any case, it’s LODs to the rescue!
Let’s say we have a bar chart showing
sales by Sub-Category and we have a filter on Sub-Category.

We can create the following to count
the number of sub-categories selected.
Filter Selection
Count
// Count the number of values selected in the
filter
{FIXED : COUNTD([Sub-Category])}
I’ll then insert that into the title
text.

For this to work properly, you will
need to make sure that the filter is added to context. You also need to be
careful when using this method as other filters can have an impact on the
accuracy of your count.
19. Rank Numbers (Kind of)
Wouldn’t it be great if you could use
LODs for ranking and avoid those nasty table calcs! Well you can…kind of. This
method is really only applicable for very small sets of data and still has a
lot of flaws. But, in some very specific scenarios, it may come in handy. Let’s
say we have sales by Segment and wish to rank the values.

We can rank these using the following
calculated field:
Rank
// Rank the sales by Segment.
IF SUM([Sales]) = ATTR({FIXED : MAX({FIXED [Segment]: SUM([Sales])})}) THEN
//
Sales matches the maximum sales for a segment
1
ELSEIF SUM([Sales]) = ATTR({FIXED : MIN({FIXED [Segment]: SUM([Sales])})}) THEN
//
Sales matches the minimum sales for a segment
3
ELSE
2
END

You can already see the limitations of this approach. If you had more than
3 segments, then the comparisons would get increasingly complex as you’d have
to not only compare to the highest value, but the second highest, etc. This
method also does not account for ties. But, it could be useful in some very
specific scenarios. For an example of one such scenario, see Text Showing Greater/Less Than Comparison
20. Using Filters, Show an “Other”
Value
This is a fun one so I’ve saved it for
last. Let’s say we have a pie chart like this:

The pie chart shows sub-categories, but
we obviously do not want to show every sub-category at once (that would be a
poor use of a pie chart). But, it’s also not a great use of a pie chart to show
just three of the sub-categories as a pie chart’s strength is its ability to
show part-to-whole relationships. So, we want our pie chart to show 2 or 3
sub-categories separately, then show all other categories in an “Other” slice.
But we want it to be flexible so that the user can choose those 2-3
sub-categories from the filter.
We’ll need to start by unioning the
data to itself. We’ll then use one table for the 2-3 sub-categories and the
second for “Other”:
Sub-Category New
// Sub-Category adjusted to include “Other”
IF [Table Name]= "Orders" THEN
[Sub-Category]
ELSE
"Other"
END
Then we use an LOD to get the overall
sales amount.
Total Amount
// Get the total overall amount.
// Dividing by 2 to account for data
duplication from the union.
{FIXED : SUM([Sales])}/2
Then we create an adjusted sales
measure:
Sales Adjusted
// Sales depending on if it is a regular sub-category
or "Other"
IF ATTR([Sub-Category New]) = "Other" THEN
MAX([Total Amount]) - SUM([Sales])
ELSE
SUM([Sales])
END
Now we’ll build our pie chart. We place
Sub-Category New on the color card and Sales Adjusted on the angle
card. Then we create a filter on Sub-Category. You’ll now have a pie
chart that lumps all unselected items into “Other”

LOD Tips
Before wrapping up
this blog, I wanted to share a few general tips for using LODs. For starters, I
often use the following set of questions to determine if an LOD might be
necessary:
1. Do you have tables with one-to-many relationships, which causes record
duplication?
2. Do you need an aggregate outside of the viz level of detail
(could require a subset or superset of the data)?
3. Do you need an aggregate to act as a
static value for which to perform comparisons?
4. Do you wish to isolate some value or set of values from records outside
of the viz level of detail?
5. Do you need to aggregate something outside of the filters that are applied?
If your answer to any of these
questions is yes, then an LOD may be required.
There are a few other things that are
helpful when using LODs. Perhaps the most important is Tableau’s Order of
Operations. See the visual below from the online help.
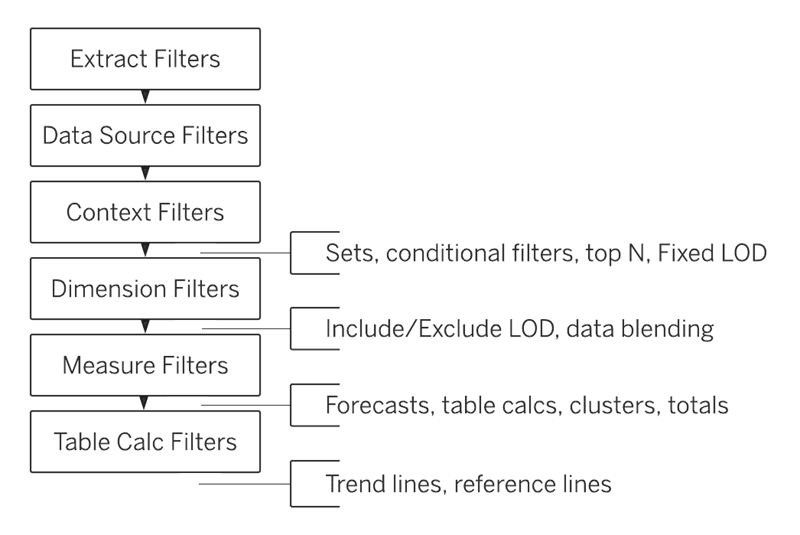
One of the most common problems people
encounter with LODs is that their LOD is not respecting their filters. This is
typically because the are using dimension filters (blue pills). But,
as shown above, FIXED LOD calculations compute before dimension filters.
This means that that a FIXED LOD’s return value is not impacted by changes to
the values selected in the filter. In some cases, this is exactly what you want
(see question # 5 above), but in others, you want your filter to compute before
the FIXED LOD. In that scenario, you need to make that filter a context
filter (grey pill). As shown above, these compute before FIXED LODs. (Note:
To add a filter to context, simply right-click the filter and choose “Add to
Context.”) If you have not read the online help about the Order of Operations, stop what you’re doing and read it now as understanding the
OOO is critical to understanding how Tableau works. You can also check out my blog on the Order of Operations.
One final tip I’ll provide is something
I generally apply to any calculation that has a bit of complexity, including table
calculations, LODs, etc. I personally always start by building a table before
jumping into building a chart. This may be fairly obvious already, considering
the fact that most of the examples in this blog used tables. I just feel that
data organized in rows and columns makes it much easier to validate and
troubleshoot the calculations. So my recommendation is to start with a table,
ensure the calculations are correct (and, in the case of table calcs, ensure that you have them set up
to compute properly) then apply them to your chart.
Wrap-Up
That was fun! As you might be able to
tell, I absolutely love LODs—they are so powerful and allow you to do some
really tricky things with Tableau. I hope you’ve enjoyed my examples and find
it to be a useful reference in the future. Thanks for reading!
Ken Flerlage, February 19, 2020


This is a great piece of work guys however, may I add another caveat to your list of tips: Consider your use case and (I know div tags won't work btw) the size of your datasource and pipeline. Looking at the execution plans, LODx usually result in exponentially larger executions and more than one (usually two or more) table scans (or index scan/seeks if your table is optimised), far more than when the same result is sought for window calcs (I know, lacks flexibility) or additive calcs (fixed grain calcs). But with careful planning, and at least a basic SQL knowledge (when using an SQL/NOSQL source), developers can ensure that LODx are used appropiately, and not just wastefully where other methods may prevail.
ReplyDeleteSteve
Thanks Steve! Are you aware of any research studies that dive into these performance implications? I'd love to read about the differences in execution plans between table calcs and LODs. If you know of anything, please let me know.
DeleteHi Ken, as both an analyst/BI dev and a datawarehouse engineer, I regularly optimise both front and back-ends such, that back in late 2015, I began to notice a correlation between the uptake and use if the then newly released LODx, and the upwards use (and sometimes spikes) in server load, data-stream impacts and pipeline blockages.
ReplyDeleteThese initial observations on the enterprise environment prompted my investigations which I have documented as an introduction to the LODx architecture article on my site. I would be happy if you were to take a read: https://datawonders.atlassian.net/wiki/spaces/TABLEAU/pages/108429406
Steve
Great. I've been looking for something like this and had been considering doing some of my own research on the topic.
DeleteI'd be happy to help if you need it (not that I expect you will), and you can certainly reference my work all the same.
DeleteHi Sir. Thanks for the great post. I have a question. You said that "FIXED LODs, which tend to be the most heavily used...". My question is Can we literally use FIXED LOD for every problem in general? I mean can we use FIXED LODs instead of INCLUDE/EXCLUDE?
ReplyDeleteThat's an interesting question. I can't think of many situations where an INCLUDE or EXCLUDE LOD could not be replaced with a FIXED LOD. There may be such situations, but I can't think of an example off-hand. That said, just because you can does't mean you should. There are cases where an INCLUDE or EXCLUDE LOD simply makes more sense and adds flexibility. So, I think it's important to use the right tool for the job.
DeleteI'd like to add in a great exception to this having only happened across this today. Your excellent example of the bee-swarm plot from November 2020 requires an Exclude LOD that I'm not so sure could be created using a Fixed LOD: https://www.flerlagetwins.com/2020/11/beeswarm.html
Delete(apologies if this post appears three times, I was trying to use my Google account it didn't seem to work)
I got it. Thanks for your comment, Sir.
ReplyDelete@Ken - Can you detail or share a link to Mina's solution without the use of LOD's for #12 Compare Current & Previous Year? I'm curious.
ReplyDeleteGreat overview and set of use cases, thanks for the hard work!
See the following which shows alternative solutions: http://vizdiff.blogspot.com/2020/02/20-calculation-use-cases-lod-vs-non-lod.html
DeleteLOD for specific row groups
ReplyDeletei export multi period detailed financial statements, All the amounts export as absolute numbers (neither positive or negative) . Expense rows do not export as negative values.
How can i convert, for example, just the expense rows into negative numbers?
Seems like i could use LOD fixed for only accounts grouped as expenses? thanks
This would be a great question to post on the Tableau Community Forums. Could you do that? If so, provide some sample data (even if it's fake). And feel free to tag/mention me.
DeleteThanks done: https://community.tableau.com/s/question/0D54T00000Gf9gASAR/lod-for-specific-row-groups
ReplyDeleteLooks like Jim was able to address your question!
Deleteexcellent post!
ReplyDeleteExcellent post! I have a question, am unsure how to approach this. I have a dimension called "Brand" which lists a number of brands ---Brand A,B, C etc. My measure is Sales, Profit etc....As far as LODs go, I'd like to return Brand A's specific sales/profit by month and compare it with Brand B's sales/profit by month in the same viz. I went about creating two parameters Brand 1 and Brand 2 and added separated table calculations for each - The calculation is valid ---but, not returning what it should....CASE [Brand 1] WHEN "Brand A" THEN {FIXED [Brand],"A": SUM([Sales])} END; similarly for Brand 2....Any suggestions?
ReplyDeleteAny chance you could email me at flerlagekr@gmail.com? It's difficult to answer these questions in this comments section.
DeleteHey ken great help thanks a lot. I need solution for the same problem, can you forward that mail to me too..? on apuroopmahadev18@gmail.com. I know its difficult to search in you mails, if possible @unknown user can you send me solution that ken sent..!
DeleteProblem Statement - I need my measures to get aggregated in LOD calculations based on values in dimensions...
For ex - Brands- A,B,C,D and we have sales and profit.
My LOD calculation looks like {Fixed [Brand],[Month]:Avg(sales)}.
I tried - {Fixed [Brand]="A",[Month]:Avg(sales)} but it didnt work. I'm not getting avg sales of A's.
My linkedin Prof - https://www.linkedin.com/in/apuroopmahadev/
Mail - apuroopmahadev18@gmail.com
Please email me.
DeleteLet's see if you can help me with this:
ReplyDeleteI have a dimension "period" with dates of the last 2 years with format 00/00/0000
I have a parameter called "How many months to show"
I have a calculated field called "Show N months".
Whose formula is
DATEDIFF('month', datetrunc('month',[Period]),
{max(datetrunc('month',[Period]))})<[How many months to show]
The question is: How can I have N previous months displayed by choosing a certain period?
Might be easier if you could email me. flerlagekr@gmail.com
Deletethanks ken, I sent it with the title "How can I have N previous months displayed by choosing a certain period" from my e-mail
ReplyDeleteThank YOU so much Ken! Absolutely helpful!!
ReplyDeleteI am wondering if you can help me on this.
I am trying to describe the case and hope that you could help me.
I created a calculated field that measures the customer level value. Then I used this field as one of dimensions. It works if I add the customerID to the detail pane. the view is a bar. everything works except the bar label won't show because it contains many individual values . Is there any way to show bar value as total not individual value?
I'd need to see the workbook. Any chance you could either email to me (flerlagekr@gmail.com) or post the question on the Community Forums?
Deletewhere is the data set? how can i practice?
ReplyDeleteThis is mostly just Superstore. Feel free to download the workbook here: https://public.tableau.com/profile/ken.flerlage#!/vizhome/20UseCasesforLODCalculations/00
DeleteDo you have any tips for handling this when your datasource does not contain raw numbers and has multiple layers? I work in education, so we often want to look at various different subcategories. Our datasources currently create totals using COUNTD of a unique ID for each person.
ReplyDeleteI have noticed difficulty in reproducing certain calculations using COUNTD([ID]) as opposed to a raw [Sales] number, for example. Should we continue counting the unique IDs in Desktop or is it better practice to aggregate it all in Prep before generating the datasource?
I'd probably need to know a bit more about your situation. Any chance you can email me? flerlagekr@gmail.com
Deletecan we fixed measures with running sum total i.e { fixed New Caller :Running_sum(sum(AMT))}
ReplyDeleteNo. You can't include table calcs within an LOD.
DeleteThank you so much for this post! I used it to try and troubleshoot this issue, but I'm still stuck. I wanted to share it here in case it helps others in the future. Thank you!
ReplyDeletehttps://trailhead.salesforce.com/trailblazer-community/feed/0D5KX00000jA5vS0AS