
How to Perform Multiple Pivots in Tableau Desktop

A question I see fairly frequently on the Tableau Community
Forums is how to perform multiple pivots in Tableau Desktop. Historically, my
standard reply has been that this isn’t really possible and you’d be best
leveraging a data prep tool such as Tableau Prep or Alteryx to perform this
transformation prior to bringing your data into Desktop. However, things have
changed now that Tableau has introduced the new data model/relationships in
2020.2 (Note: If you’re not yet familiar with the new data model, I’d suggest
reading my blog on the topic, Tableau's New Data Model, before you proceed).
This new functionality opens some doors that will allow us to perform multiple
pivots.
Take, for example, the data set shared on this forums post from
2019: How to create multiple pivots in Tableau. For brevity, I’ve condensed the
spreadsheet to two tabs, Population and GDP Growth. Each tab includes a column
for Country, followed by 19 columns showing its measure—population or GDP
growth—by year.

Our goal would be to pivot both sets of year columns separately,
resulting in a column for the year and a column for each of the measures. Let’s
try this in Tableau 2020.1. We start out by joining the two tables together.
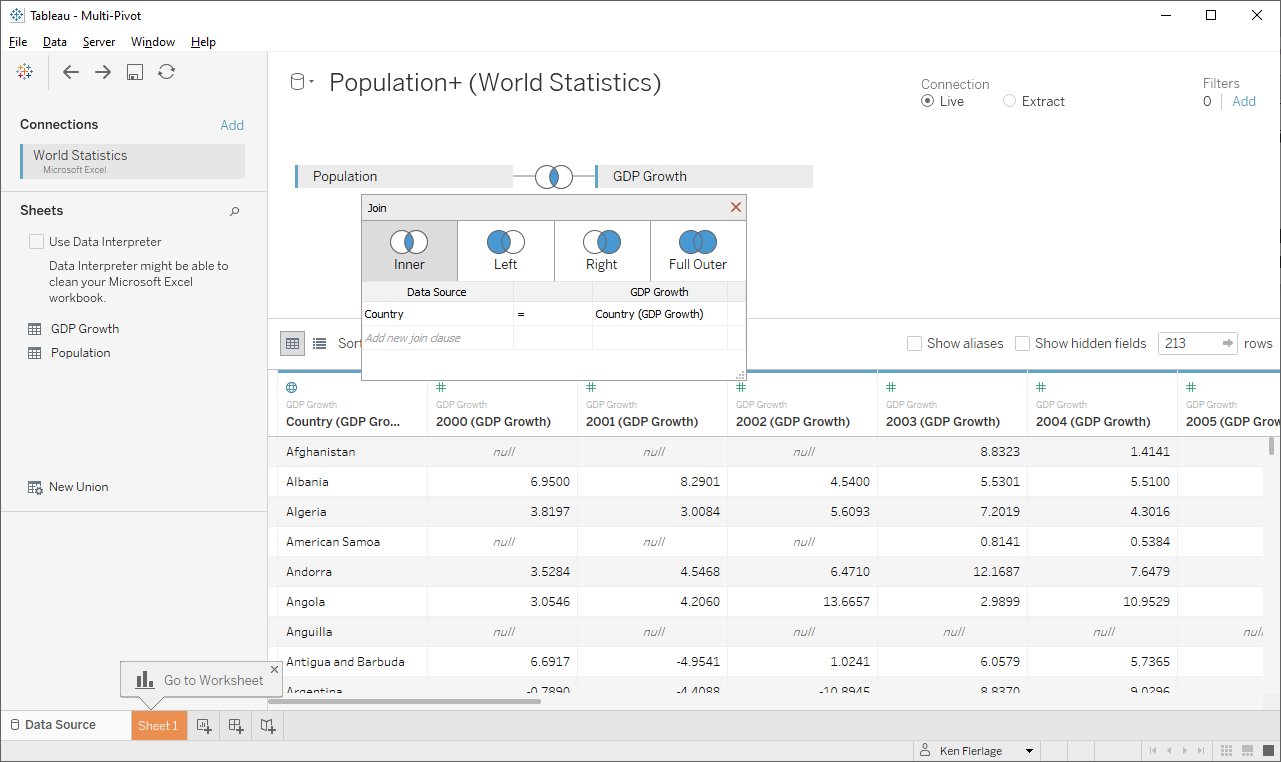
We’d then pivot one set of our year columns—I’ll pivot the GDP
Growth columns.
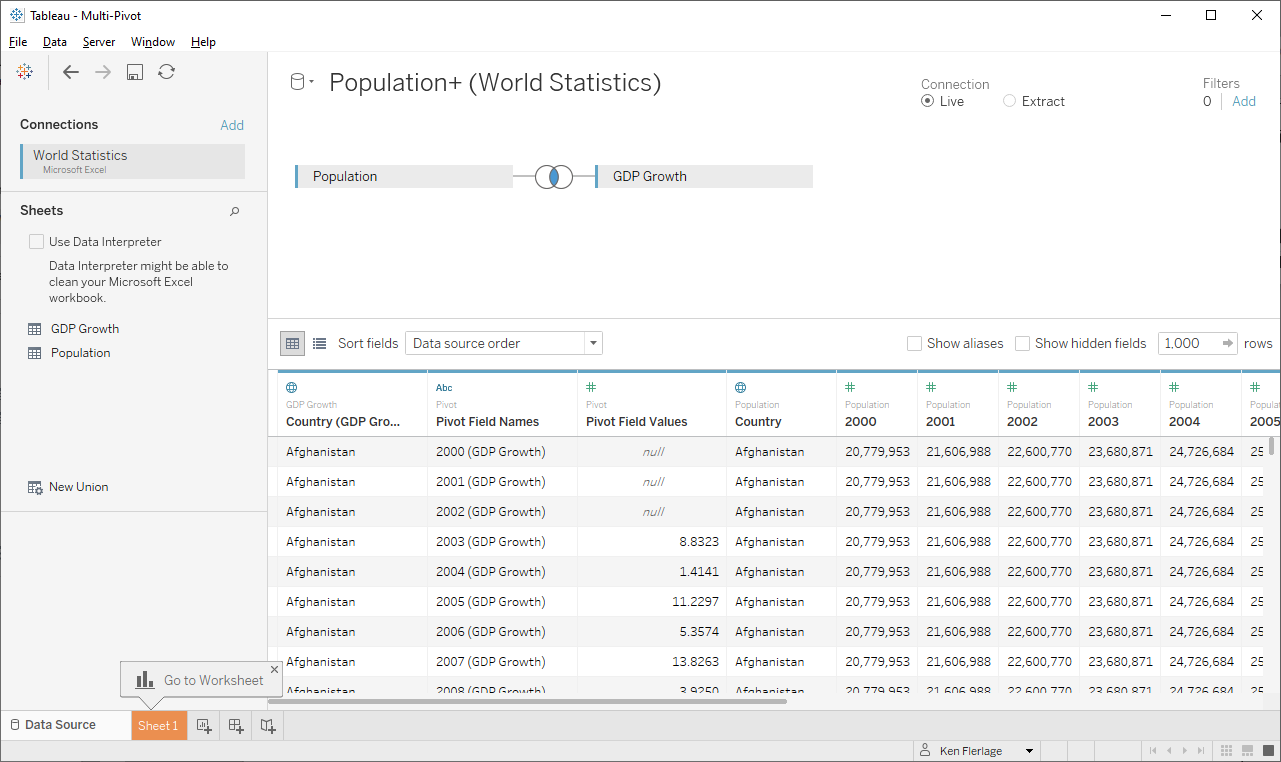
We now have a column for Year and a column for the GDP Growth
measure. Next, we’d try to pivot the Population columns. The problem is, when
we do this, the only pivot option we have is to add to the existing pivot. We
cannot create an entirely new pivot. There are, of course, a variety of
different options in this case. We could use a data prep tool to perform the
multiple pivots—this can be done quite easily in Tableau Prep, for example. Other
Desktop-only solutions might include adding the columns to the pivot and
creating calculated fields and aggregations to adjust from there; or we could
even union the two tables together, then pivot them. While these are all
workable solutions—and in the case of using Tableau Prep to prepare the data
upfront, potentially even preferable solutions—it would still be nice to be
able to perform multiple pivots from right within Tableau Desktop.
Multiple Pivots in 2020.2
As noted earlier, 2020.2 provides some new functionality that
will allow us to perform multiple pivots. The trick is that each “logical”
table in the new data model is sort of its own separate entity, each with its
own “physical” model made up of joins, unions, etc. This means that we can perform
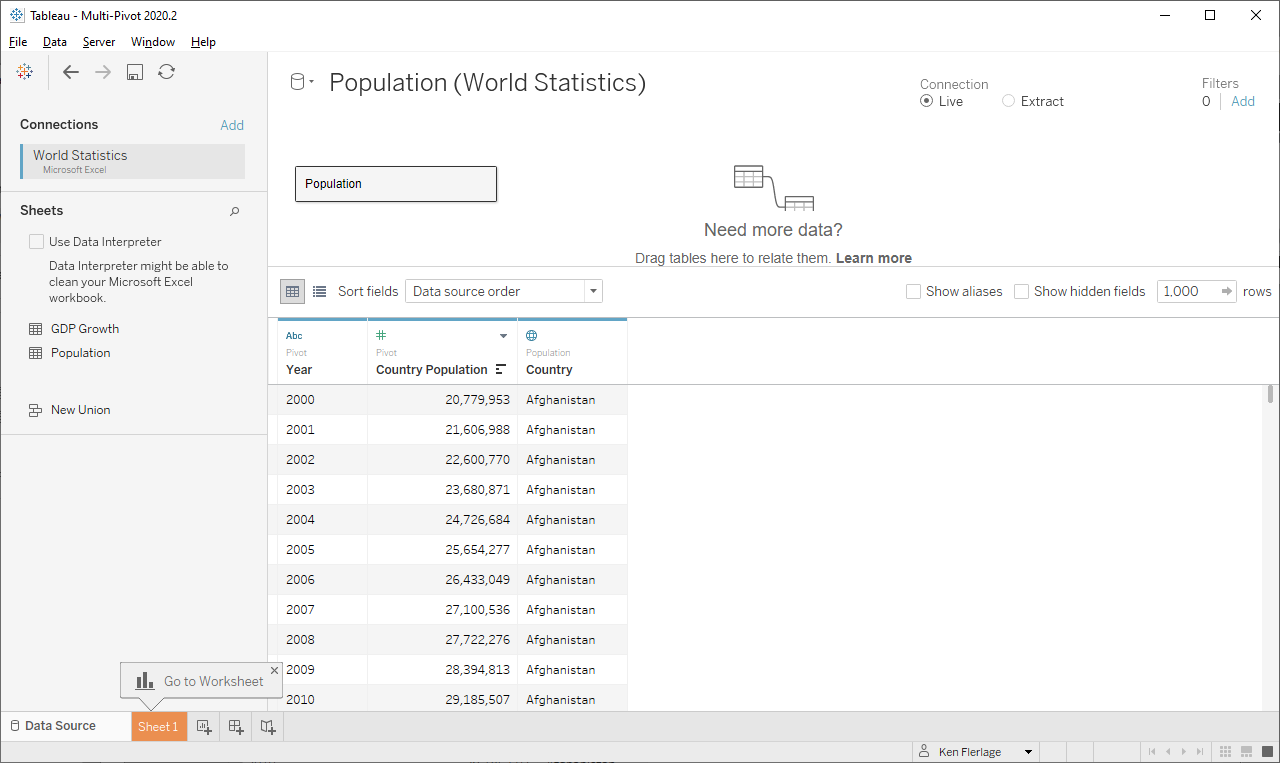
one pivot in each logical table. So, using 2020.2, we’ll first connect to one
of our tables.
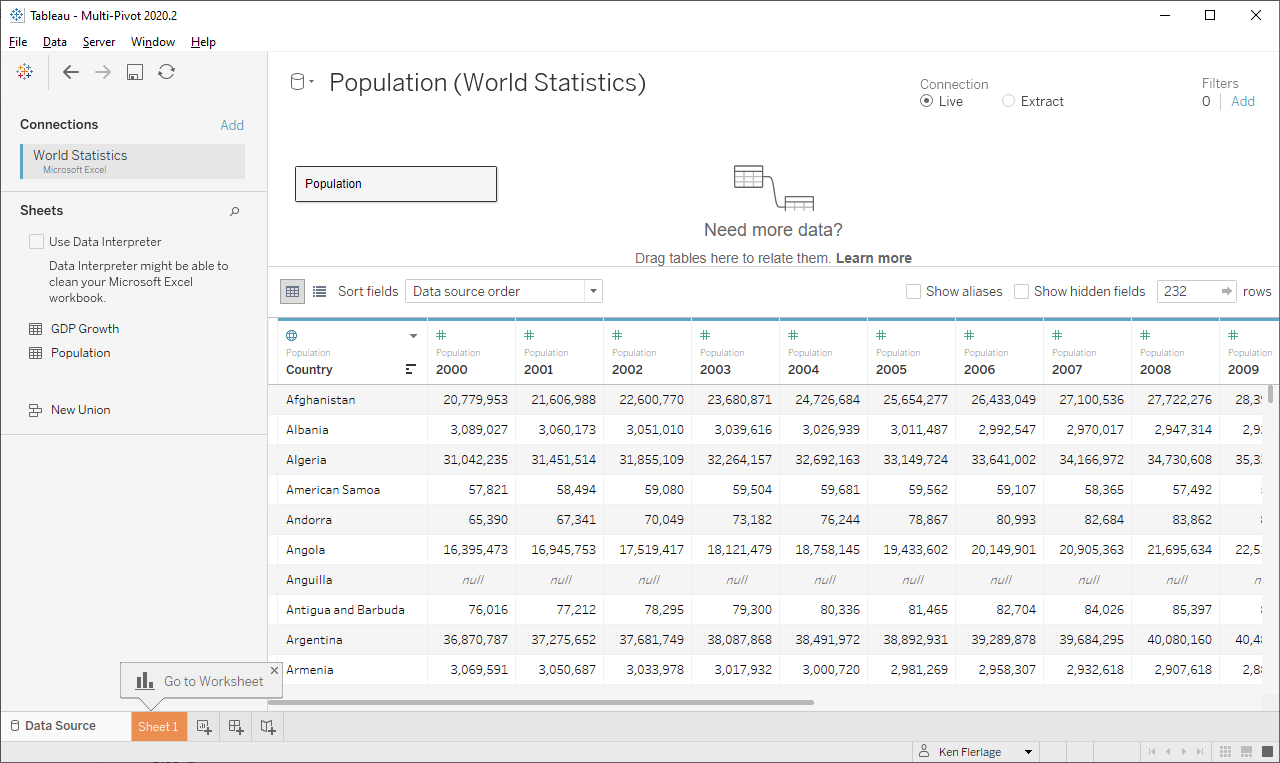
Next, we pivot the year columns.
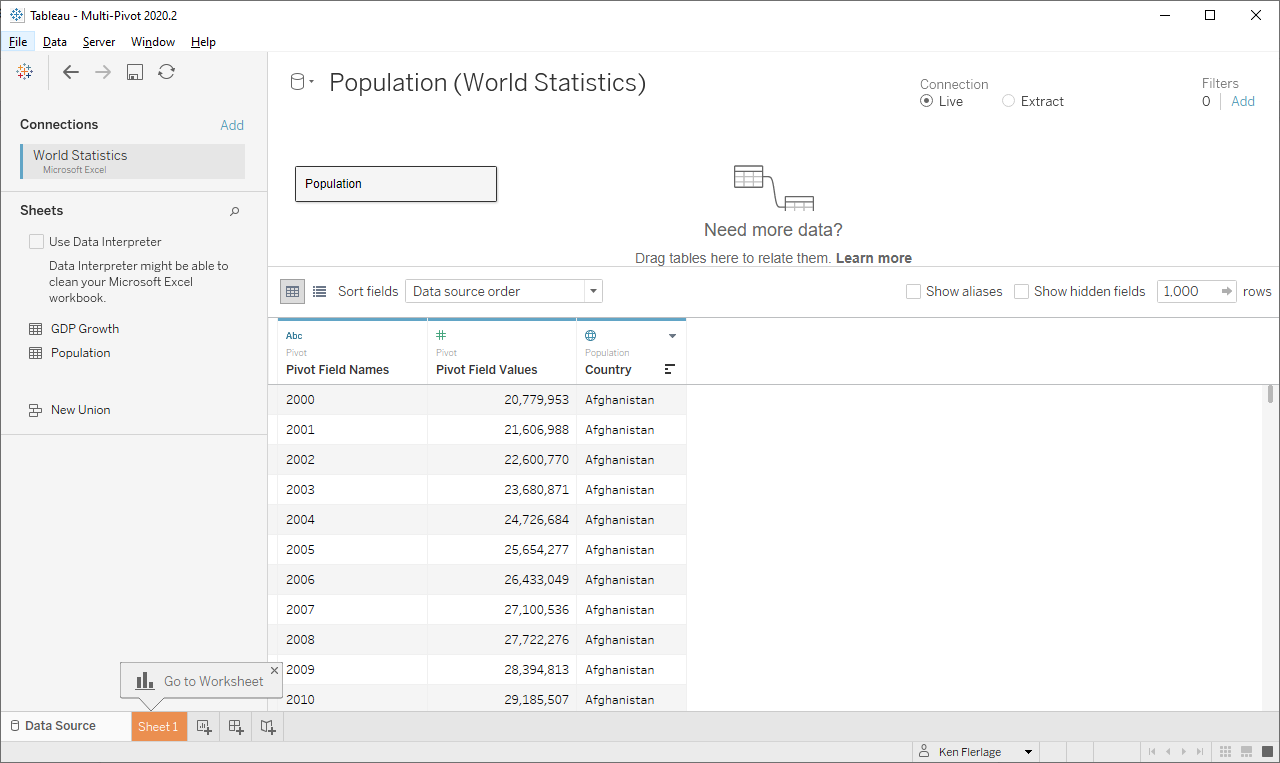
And we’ll rename the fields to something more logical, Year and
Country Population.
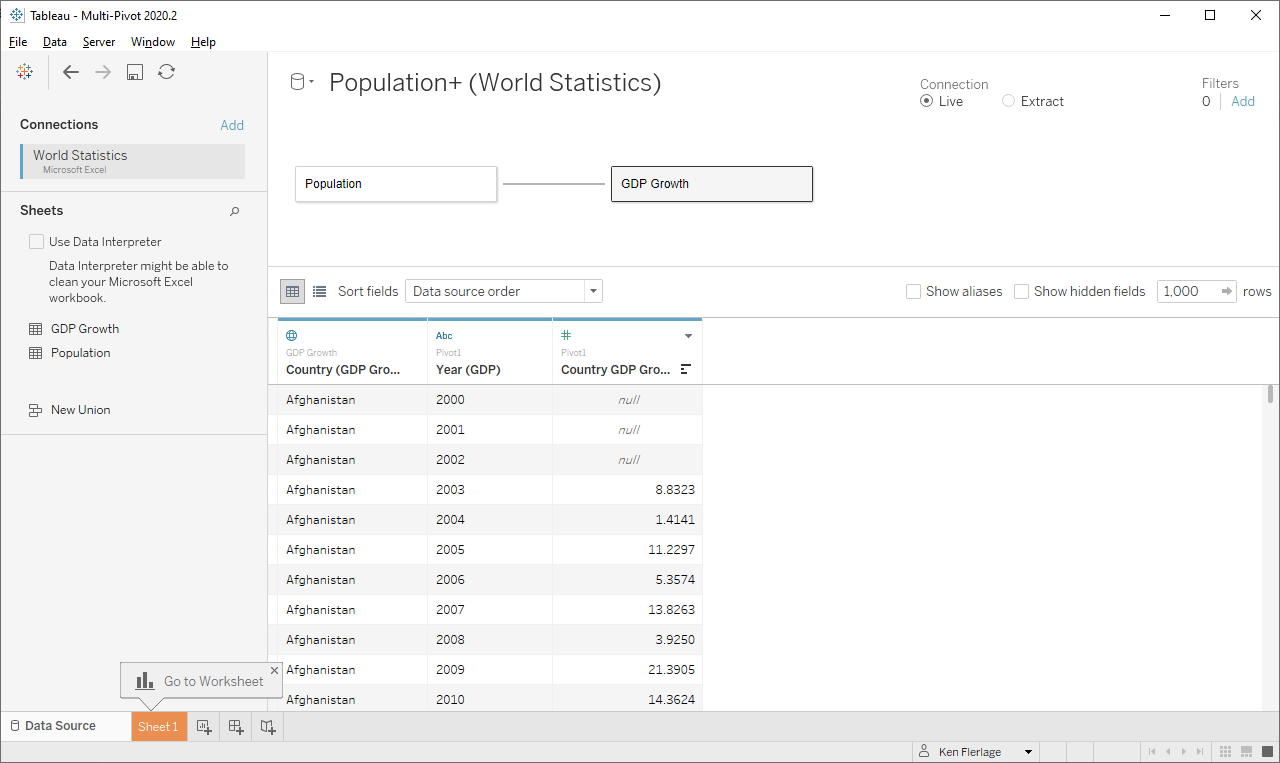
Now we’ll add our GDP Growth table. The “Edit Relationship”
dialog box will appear. We need some relationship set, so accept the default
link on Country, then close the dialog. Next, pivot the year columns for this
table and rename the fields.
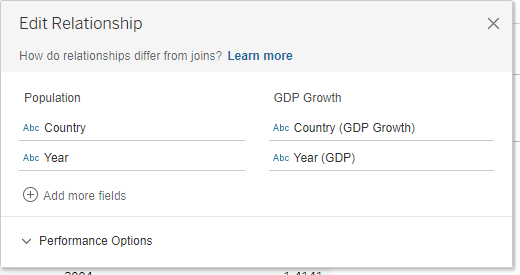
Now click on the noodle to edit your relationship. Add a new
relationship between the Year fields (in addition to the existing relationship
on Country).
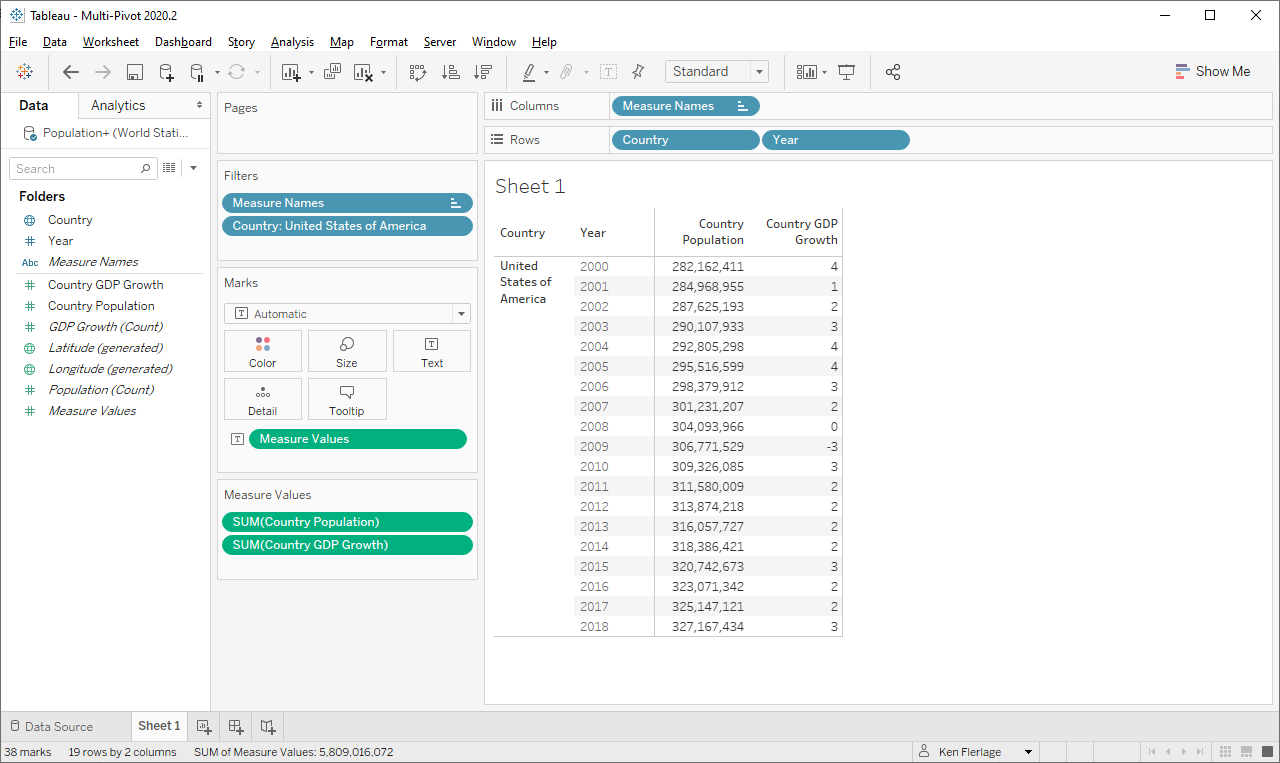
And voila, we’ve performed two pivots in a single data source!
We can now easily work with the resulting clean data set.
Single Table
OK, so that works great, but what if all of our data is in a
single table? Unfortunately, this is not quite possible…yet. Let’s walk through
it to see why.
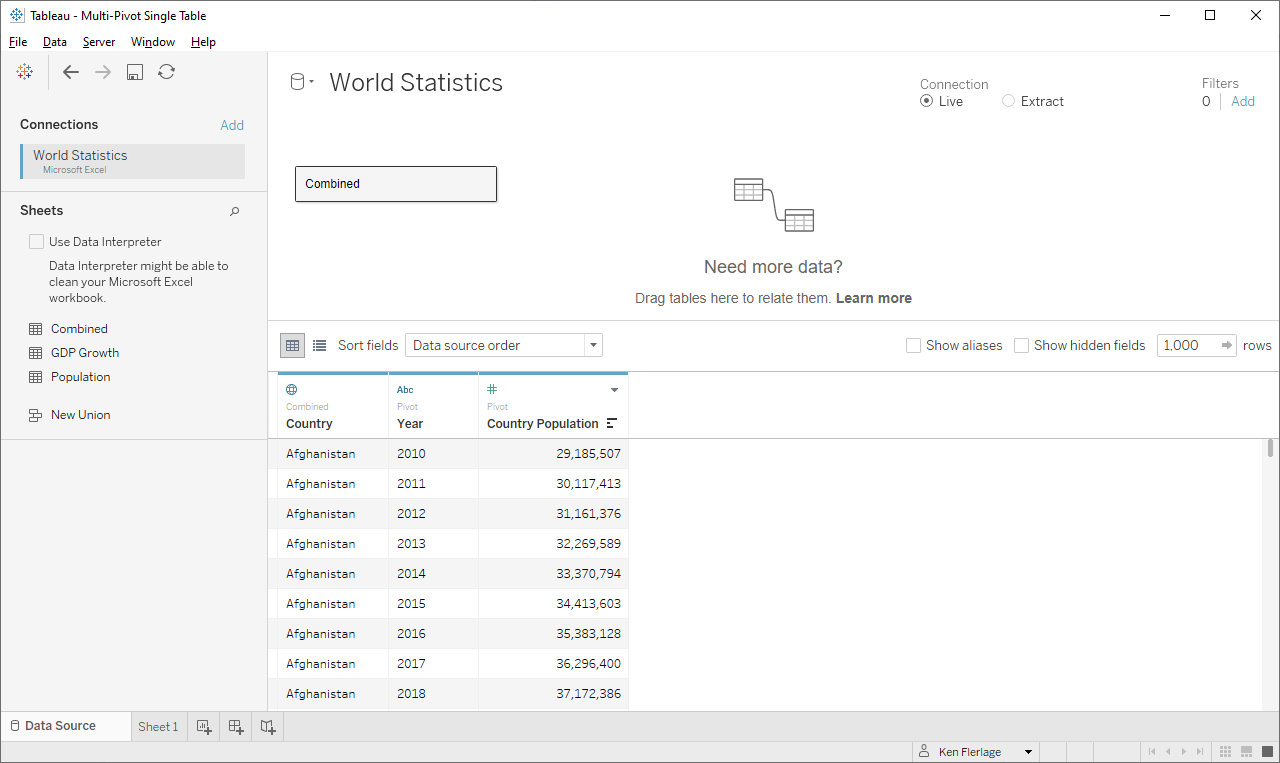
We’ll first connect to the table, then perform a pivot of one
set of the fields—say the Population columns—and rename the pivot fields. Then
hide the other set of fields as we will not be using them.
Then add the table again, pivot the GDP Growth fields, and
rename the pivot fields.
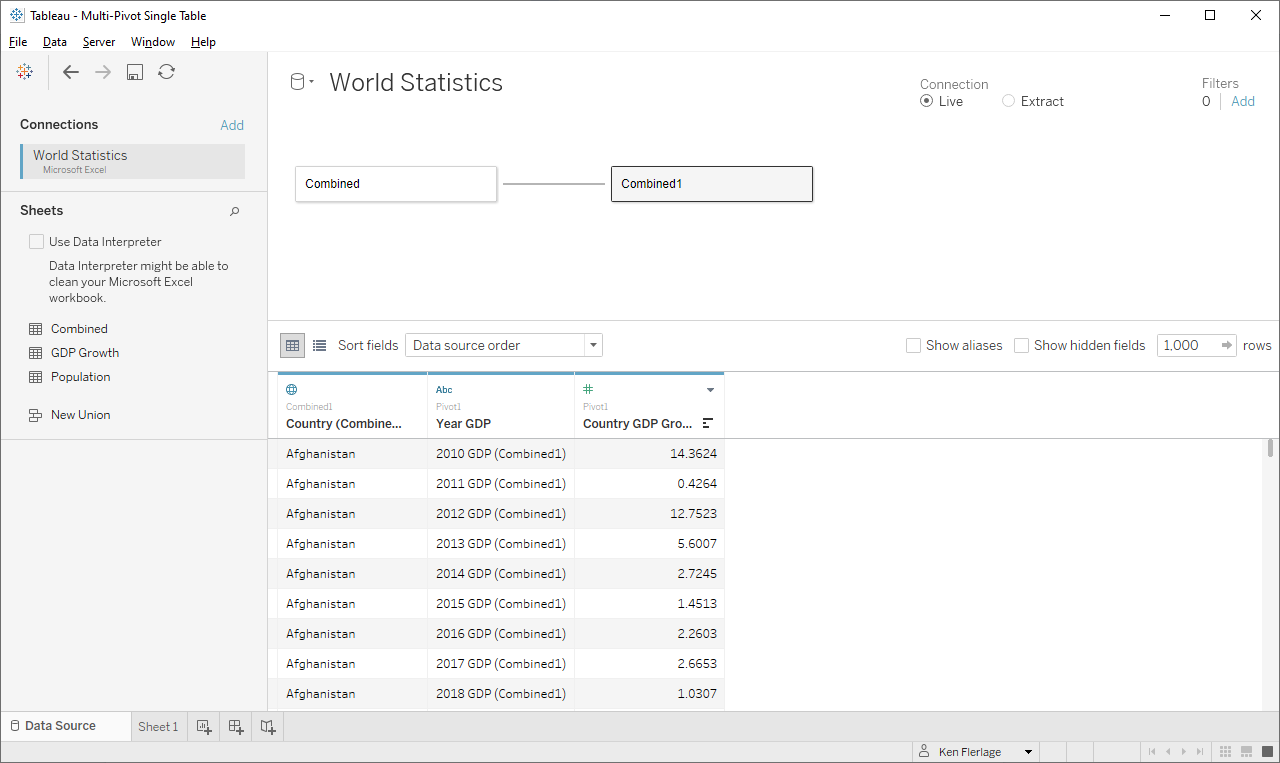
At this point, we’d just need to relate the two Year fields. The
problem, however, is that our left table has just numbers—2010, 2011, etc.—in
the Year column. But the right table has numbers followed by text—2010 GDP
(Combined 1), etc. This is because the fields were all in the same table and,
therefore, had to be unique. Thus, we've hit a dead end because we cannot
use calculations within relationships. However, the 2020.3 beta, which was
recently announced by Tableau, includes the ability to use calculations in
relationships. So, let's use 2020.3 to address this problem.
Note: Though it's included in the beta, there is no guarantee that relationship calculations will be in the final release, but let's cross our fingers!!
When we click on the noodle and add a new relationship, we'll select Year on the left side, then click the new "Create Relationship Calculation" option on the right and enter the following calc:
This will trim off the suffix, " GDP (Combined1)", leaving us with a number that matches the table on the left. And, with this new relationship in place, we have now successfully performed two pivots on the same table, bringing the data together into a single set of records!
Note: Though it's included in the beta, there is no guarantee that relationship calculations will be in the final release, but let's cross our fingers!!
When we click on the noodle and add a new relationship, we'll select Year on the left side, then click the new "Create Relationship Calculation" option on the right and enter the following calc:
REPLACE([Year (GDP)] , ' GDP (Combined1)', '')
This will trim off the suffix, " GDP (Combined1)", leaving us with a number that matches the table on the left. And, with this new relationship in place, we have now successfully performed two pivots on the same table, bringing the data together into a single set of records!
……………….
As always, I hope that you found this useful. If you have any
questions or comments, feel free to leave them in the comments section below.
Thanks for reading!!
Ken Flerlage, August 3, 2020


Very helpful tip, thanks for sharing. I think for relationships really to take off, 2020.3 is needed. Without join calcs it is not so helpful.
ReplyDeleteI agree that relationship calculations and inequality will definitely help make it more viable.
DeleteBefore 2020.2 and even before Prep, I would
ReplyDelete(1) concatenate the two fields Population and GDP Growth -
( change the datatype to string - concat with '|' inbetween the two fields)
(2) pivot (hiding the original two fields of course) and
(3) split and change the data type back to numeric.
Life is much easier now.
That's a nice trick!!
DeleteThank you Ken! However the pivot is not available if our source is a query from a database such as AWS redshift, SQL server etc. Am I correct? In such case, we are better off using Prep/Alteryx or is there a way to tap into relationships?
ReplyDeleteThat is exactly correct. If Prep or Alteryx is available, I'd suggest using always using those. However, if you're in a bind or don't have those tools available, then this hack is available.
DeleteThank you Ken! But is it possible to do multiple pivots if we have only one table or only on excel in Tableau Desktop
ReplyDeleteYes, that's what this blog shows.
DeleteSee the "Single Table" section at the end.
DeleteThanks for the tip.
Deleteone question pls!
My two pivots are not connected to each other. Meaning I want to put one pivot in filter and want to analyse data in 2nd pivot but it is not working. It might be because the two pivots are not linked
How can we solve this?
Thanks
Ankit
I'd need to see the workbook. Can you email me? flerlagekr@gmail.com
DeleteDo you know if the pivot option within Desktop is still available in 2023.3.3?
ReplyDeleteYes
Delete