
QGIS for Tableau Users # 1: Getting Started
Kevin and I are
incredibly excited to, once again, have Sarah Battersby join us for a guest
blog. This post is the first in a multi-part series about QGIS, a free, open
source Geographic Information System (GIS) that you can use in
conjunction with Tableau. In my introduction for her last guest post,
The Power of Place: Unleashing Census Data
in Your Tableau Analytics, I
joked that we were going to have to make her an honorary Flerlage Twin. With
this series, I think she’s definitely earned her place as an honorary Flerlage
Twin (or Triplet??).
Sarah has been a
member of Tableau Research since 2014. Her primary area of focus is
cartography, with an emphasis on cognition. Her work is focused on helping
everyone to visualize and use spatial information more effectively—without the
need for an advanced degree in geospatial. Sarah holds a PhD in GIScience
from the University of California at Santa Barbara. She is a member of the International
Cartographic Association Commission on Map Projections, and is a past President
of the Cartography and Geographic Information Society (CaGIS). Sarah can be
contacted at sbattersby@tableau.com or on Twitter @mapsOverlord.
Tableau
is great for maps and spatial analysis, but it doesn’t do
everything. Sometimes you need a spatial helper for your data. When I
need that helper for my work, I generally reach to QGIS, a free and open source
GIS. In this series of blog posts, we’re going to explore how QGIS can be used as part of your Tableau
workflow. This first post will cover basics of QGIS—from downloading to
the basics of working with data in the software: opening files, updating
properties, exporting spatial and text files, etc. The next posts in the series
will each tackle different use cases for QGIS and where it fits into your
Tableau workflow.
What is QGIS?
QGIS
is a free and open source geographic
information system (GIS). It runs on Windows, Mac, Linux, BSD, and
mobile/tablet! You can do amazing and complex things with your spatial
data using QGIS—and, more importantly, you can do some really simple, but
valuable, things quickly to enhance your Tableau spatial workflow. In this
series, I will walk through some of the basics that I use frequently in my own
work and for answering questions that come up regularly in the Tableau Community Forums (perhaps,
it’ll even keep Ken from constantly tagging me on spatial questions ;).
This
post will be a bit longer than the others in the series because it’s all of the
‘getting started’ stuff. I’m assuming you’re starting from never having
used QGIS before so this is intended to be a reference that you can return to
in order to remember the basics. If you already have it installed and know
the basics of working with data, you can just skip to the more targeted how-to posts
as they are posted over the next few months.
How Can QGIS Help You with Tableau?
Tableau
supports a ton of spatial analyses—with more being added in each new
release. But, it isn’t a geographic information system (GIS) and there are
specialized functions that GIS support that are super useful when working with
spatial data...but that we may not see in the Tableau product soon. Most
of the work that I do with QGIS is for data
preparation—the types of things that you do once to get your data in the
right shape...and then you’re good to go with your Tableau analysis. Those
are the types of functionality that I’m going to highlight here. Since
this is just the start of the series, here is a highlight of topics I plan to
hit later on (or relevant topics that I’ve covered in other posts elsewhere...)
Conversions /
Making New Data
• Going between projections / coordinate
systems—hey, it’s in this first post! Look for the bit on exporting your
data!
• Well known text to geometry & other
manipulations of text into spatial!
• Converting lists of points into lines,
polygons
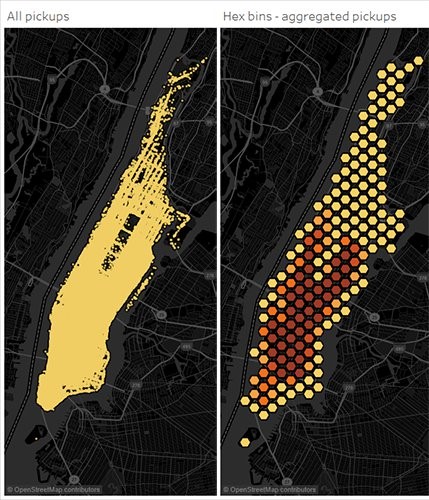
• Making
spatial bins - for instance, if you want to show your point data
aggregated to square or hexagonal shaped bins
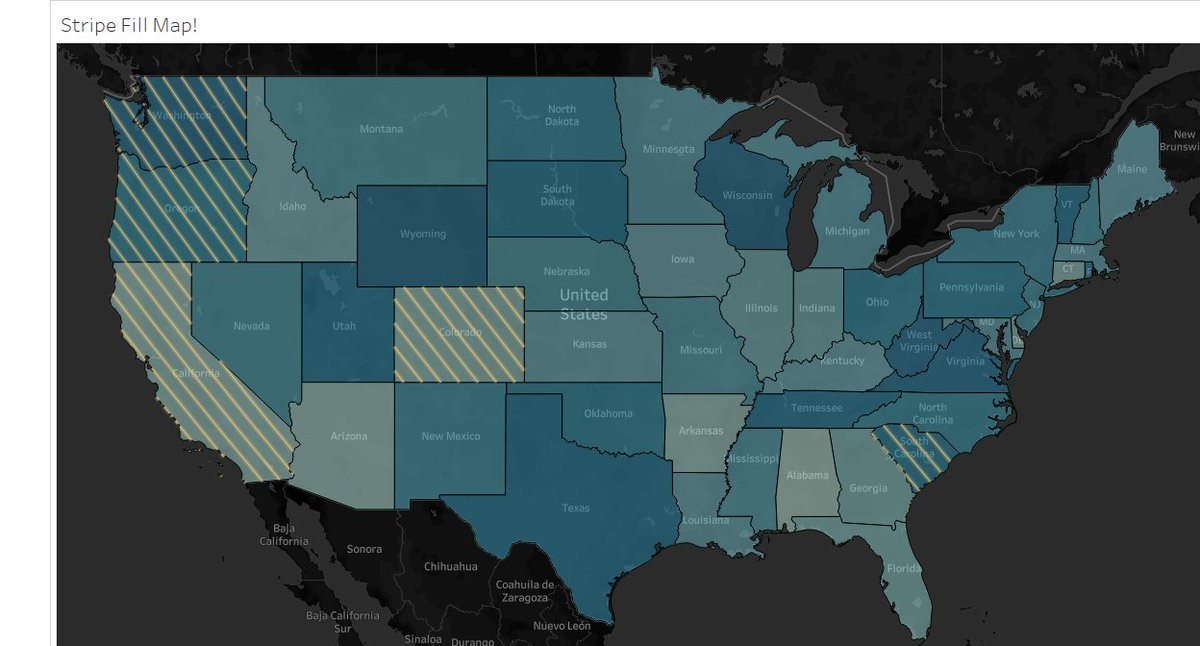
• Generating
special polygon fills like stripes!
Analyses
• Voronoi or Thiessen polygons to find all of
the locations closest to individual points
• Distance matrices
• Spatial joins
• Finding all adjacent locations
When do You NOT Need QGIS?
Before
we get started, here is a short list of things you do not need QGIS for if your goal is to work with
spatial data in Tableau:
• Spatial
Intersection (point → polygon) -
Starting in Tableau 2018.2,
the spatial intersection join type was added to the product. If you have
points and polygons you can do all of your joins in product. So if you
just want to know what region every customer is in, just add your region
polygons and your customer points and join them together!
• Buffers
- Want to know what is within a specific distance of a
location? Starting in 2020.1,
you can create buffer geometries around points and measure distances between
locations with ease. No more special calculations or pre-processing.
• Spatial
Union - If you have multiple spatial files and need to combine them
together, no need to use QGIS. Starting in 2020.3, you
can union them just like any other file type.
The Basics
Download & Install
The
first critical step in starting with QGIS to support your Tableau analytics is
to install it! You can get the installation files on the QGIS Project website. There should be a big,
green ‘Download Now’ button that you can click (but if not, here is the
shortcut to the download
page). Scroll down to the version you want. I use Windows, so
that’s where I look, but if you’re using macOS, Linux, etc., just look
for the installers for your system. Then simply run the installer. Be
patient—it can take a while to
install.
In
this rest of this post, we’ll walk through the basics, including:
• Adding data
• Adding background maps
• Calculating attributes
• Exporting data
Add Data
Great,
now you have QGIS installed. Open QGIS Desktop and we’ll get
started! For reference, I am using QGIS 3.14 (not the latest version, but
it should look pretty much the same for the examples in this post).
How
can you get some data into QGIS? I’ll work with two common data source types so
you can see the basics of how to work with them—a text file with point locations and a spatial file (e.g.,
shapefile, geojson, etc.). Here are links to some basic files you can
download if you want to try out working with data in QGIS now:
CSV
Files
In this post, I’ll work
with a dataset of Boston
public schools.
This particular dataset has the x and y coordinates in a projected coordinate
system which makes it a little trickier (AKA, more fun!) to work with. The
dataset is in Massachusetts Mainland (ftUS), which has a spatial reference id
(SRID) of 2249—we’ll look at how to use that bit of information when working
with projected data in QGIS.
Another
fun dataset, if you want to play around, is the NYC
squirrel census. I’m not using this as an example in this post, but it’s
still a lot of fun to look at! The table of data that you can download from NYC
for the squirrel census is in latitude and longitude.
Spatial
Files
I
love the US
Census cartographic boundary files. Tons to choose from! In this
post, I’ll be using the Census Tracts for Washington state shapefile from the Census.
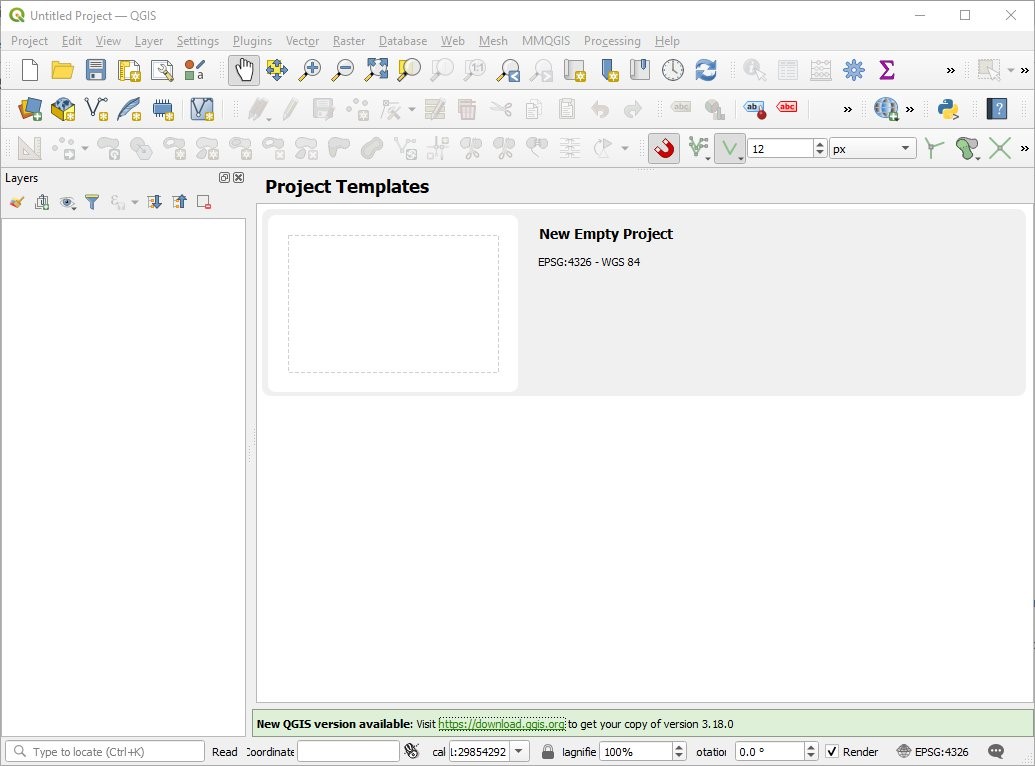
When
you first open QGIS, you will likely have a blank screen that looks something
like this - we’ll open a new empty project to get started:
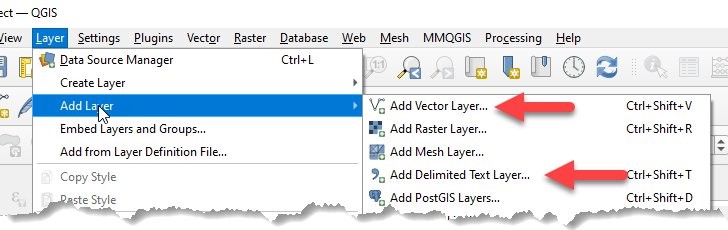
Now
we have somewhere to add our data. The easy place to find the tools to add
any new dataset is to use the Layer → Add Layer menu. For my
Tableau-related work I generally just use these two options: Add
Vector Layer... and Add Delimited Text Layer...
Add Spatial Files
I’ll
start with vector (point, line, and polygon) spatial files. These are
generally the easiest and most straightforward. Most of the time, these
files come with a coordinate system defined for them, and this information is
stored in the file itself, which makes working with it in QGIS much
easier.
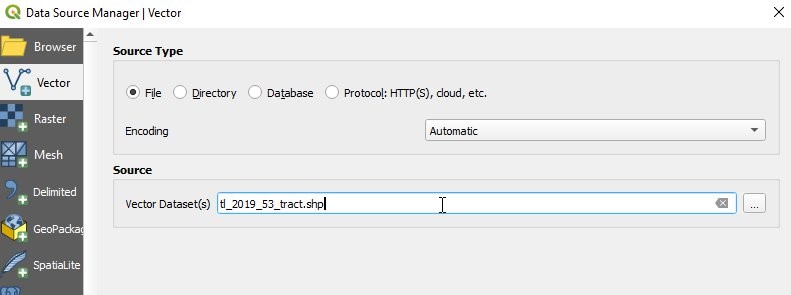
Generally,
you can just use Layer → Add Layer → Add Vector Layer and select your
spatial file in the Source section.
Most
of the time, that will be all you need to do to add a spatial file.
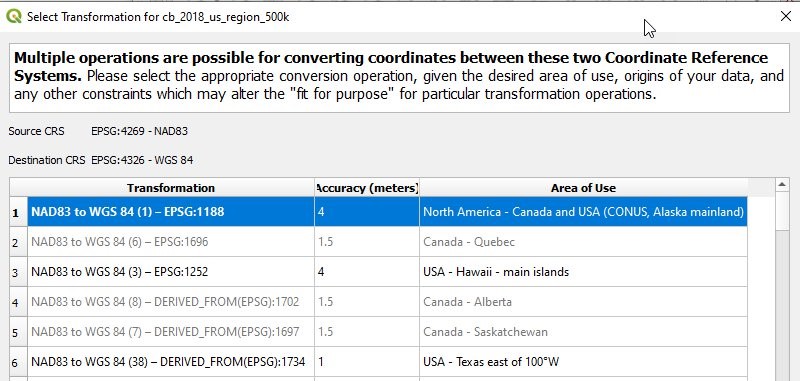
Occasionally,
you’ll see a window asking you to select a Transformation for your file—this
shows up when your dataset is in a different coordinate system than the QGIS
map and it needs some help in converting between the two coordinate reference
systems. In most cases, taking the default option will probably be just
fine.
Add Delimited Text Files
It’s
easy to add a text file - just use Layer → Add Layer → Add Delimited Text Layer like this:
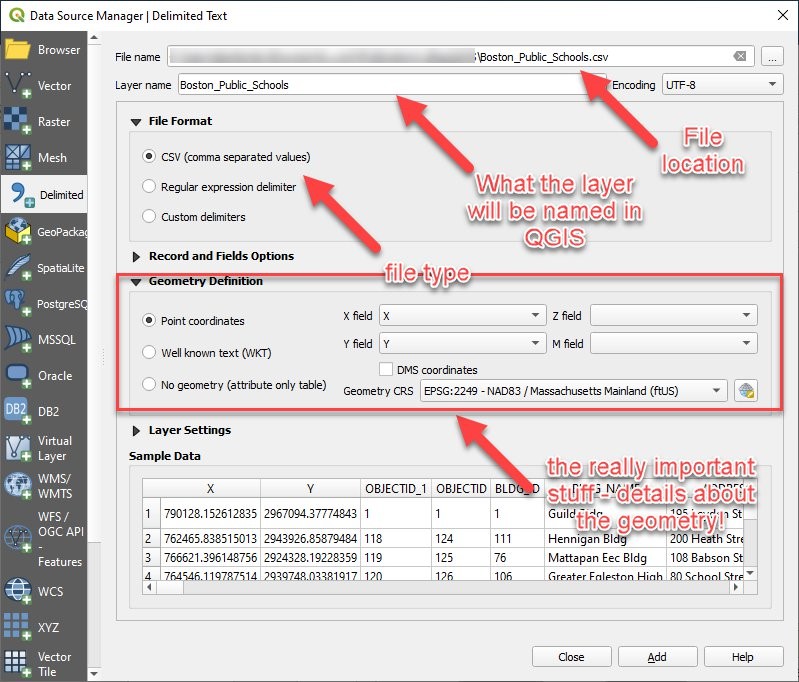
I’ve
highlighted the important parts in the image above:
• File
Name - Where QGIS will find your file. Click on the ... next to the
text field for the file picker dialog.
• Layer
Name - What QGIS will call your layer (I’m generally lazy and leave the
default).
• File
Format - Is it a generic CSV, or does it use a custom delimiter, or a
regular expression delimiter?
• Geometry
Definition - This is the really important part, and it isn’t as intuitive
as the other key parts, so I’ll go into some additional detail right now...
Ah,
the geometry definition. This is the critical piece that makes your CSV
useful as a spatial file. In Tableau, you just drop your latitude and
longitude onto the worksheet and it all works (assuming you have set them to
have the right geographic role), or you use MAKEPOINT() to convert them to a
point geometry. In QGIS you need to tell the software a bit about the
data. It doesn’t like to make too many assumptions.
Tip
on Tableau’s MAKEPOINT()
Function: If you’re just
looking to convert a CSV with points into something Tableau can use, you do
not need to use QGIS, just use MAKEPOINT in Tableau! Even if your data
isn’t in latitude and longitude, you can convert it using the spatial reference
ID (SRID) in Tableau using MAKEPOINT(x ,
y, srid). For more information about SRID check out the Spatial Reference System wikipedia page. You can look up SRID codes using
projection names on the EPSG.io web site or spatialreference.org
If you know you
have projected coordinates (not latitude/longitude), but don’t know the SRID
here are my methods for figuring out the coordinate system: 1) check for any
metadata that came with the file, or from the site where you downloaded the
data. They often list the coordinate system. 2) If #1 doesn’t work, do a
search for “official coordinate system {insert agency / county / state /
country}” where the data is located. 3) Guess randomly until you get it
(don’t really do this...you should be able to find the details if you search
around, but sometimes I really do do some random guessing...but I’ve also been
dealing with these problems for a lot of years so have some intuition about the
guessing process).
If
you have two fields with coordinates,
and fields are nicely named something like “latitude” and “longitude” they may
already be filled into the right fields. If they aren’t, you’ll want to
hit the dropdown for X field and Y field and fill in the right field
names. Remember that X matches to Longitude and Y matches to latitude if
your coordinates are in latitude and longitude. If you have projected
coordinates, just match up the X coordinate to the X field, etc.
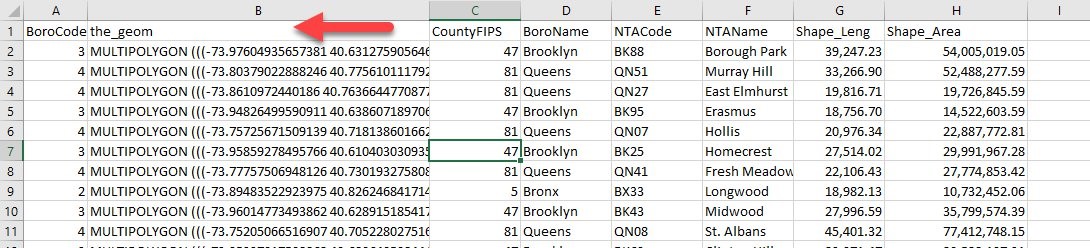
If
you have Well Known Text (WKT) in
your table you can use the WKT option to define the geometry. If you
download data from an open geospatial data portal you very well may end up with
a table with a point, line, or polygon geometry as WKT. If you have Point
data it’ll look something like this: POINT ((-73.97 40.63)). If you have
polygon data, it’ll look a little more complicated, like this example of
neighborhood polygons that I downloaded from the NY
City Open Data Portal:
You
also need to tell QGIS about the Geometry
coordinate reference system (CRS) for the file. This is how QGIS knows
where in the world to put your
data. The default will probably be EPSG: 4326 - WGS84. This
is a common way of defining latitude and longitude based on the World Geodetic
Survey of 1984. If you have latitude and longitude data and you don’t know
the specifics of your CRS, this is probably a reasonable guess. If you do not have latitude and longitude
for your data— for instance the X and Y coordinates are in a projected coordinate system—you will
need to find the right CRS to define your points. How do you do
that? My first place to look is always to check the source where I downloaded
the data—there may be a metadata guide that tells you what they are
using. If it’s from a city, county, or state, there is probably an
official coordinate system that is used and you can search the government
agency for details about the official coordinate system. I can’t help you
much here other than to tell you that I just start using web searches to see if
I can find some pointers on what the standard system is for the location of my
data.
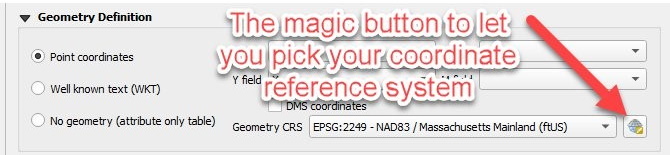
If
you use the Boston
public schools (x/y in projected coordinates SRID:2249) example file,
you’ll define the coordinate system like this...
Click
on the little globe-looking button to the right of the Geometry CRS dropdown:
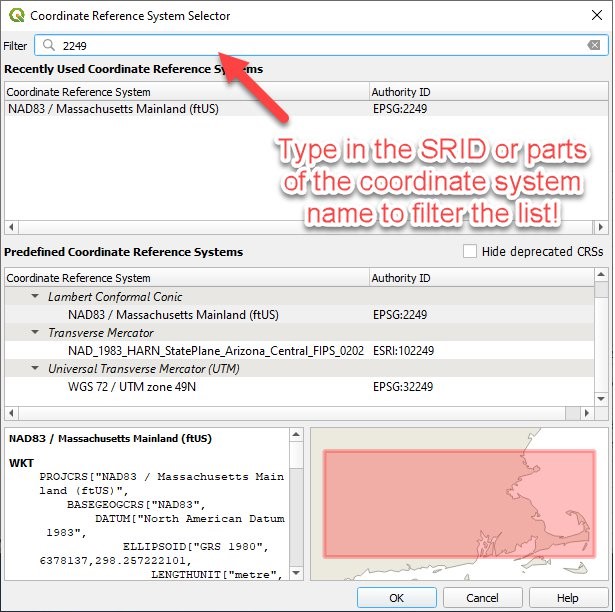
In
the selector window that opens, type in the information that you have in the
filter at the top - If you know the SRID type that in. If you know part
of the name of the coordinate system, type that in. The list will filter.
If you’ve used the coordinate system recently it may be in the top box under
“Recently Used Coordinate Reference Systems.” If not, take a look a
little lower in the window to find the “Predefined Coordinate Reference
Systems” box.
Note
that when you pick your coordinate system there is a nice little locator box on
the bottom of the CRS Selector window that gives you an idea of the location
typically covered by the coordinate system.
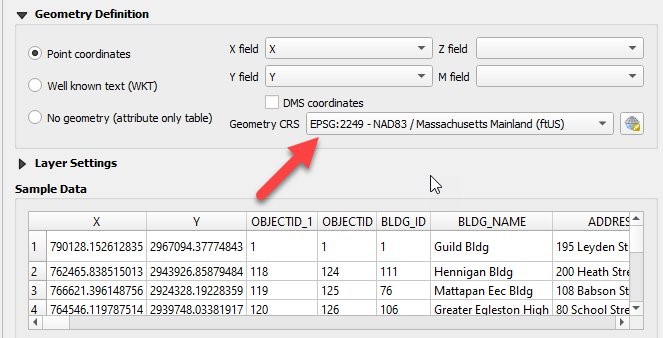
Click
OK and you should see the coordinate system listed in your import layer
dialog. Boom...CRS defined.
Viewing with Context (Base Map)
When
you add files into QGIS they will draw on the map canvas—but, unlike in
Tableau, there won’t be a nice built-in base map for you to use to make sure
all your data is in the right place. You can turn a base map on easily,
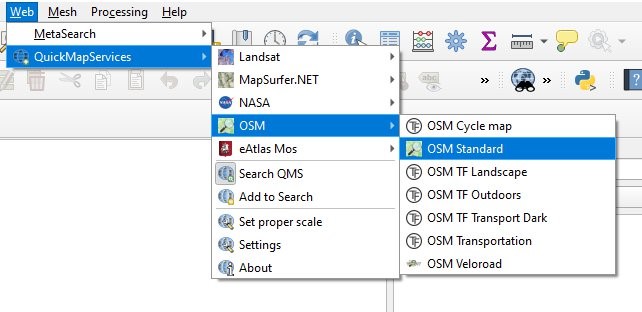
though, just use Web → Quick Map Services. I like the OSM
Standard maps. Important Note: If you
don’t see this option in your main menu, you will need to install the free
Plugin (use the menu for Plugins → Manage and install plugins and then
search for QuickMapServices).
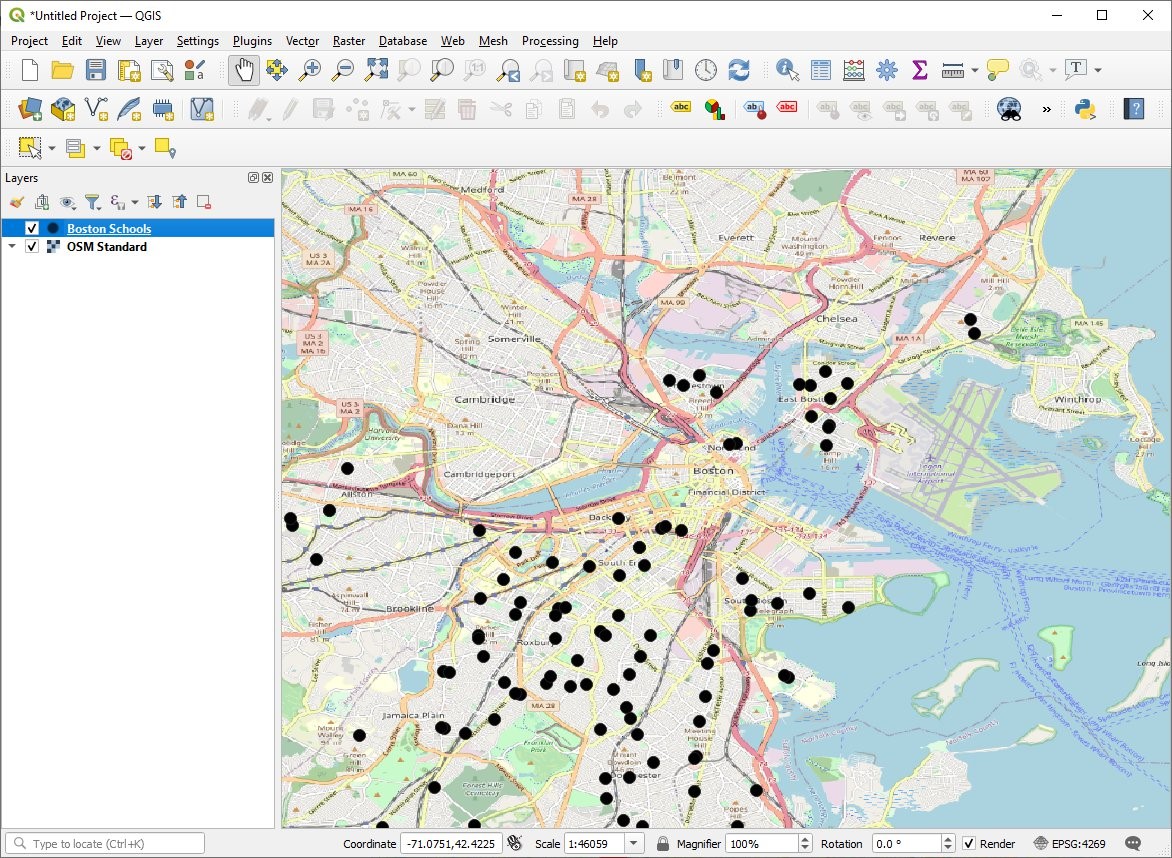
Now
you should see your data on a nice basemap. Hopefully everything seems to
be in the right place! If not, there is probably an issue with the
Coordinate Reference System that you defined and you’ll need to fix that before
moving on. See the notes in the section above about defining the
Coordinate Reference System for your dataset.
Calculating New Attributes
While
you can do a lot with calculated fields in Tableau, there are some spatial calculations that you can’t
easily do which can be easily done in
QGIS. I’ll demonstrate a single calculation to give a general overview,
but we’ll do lots of calculations in subsequent posts so you can see more
examples then. Adding attributes will require us to work with the “attribute
table”, which is displays information on features of a selected layer. For more information about this, read
through the QGIS documentation file on Working with the attribute table.
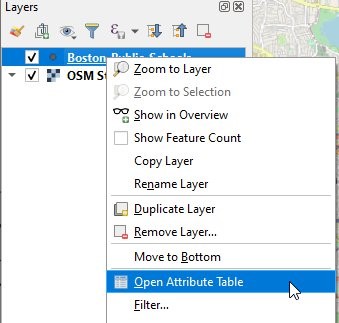
First
of all, how do you open the
attribute table to take a look? Just right click on the layer that you’re
interested in and select ‘Open Attribute Table.’
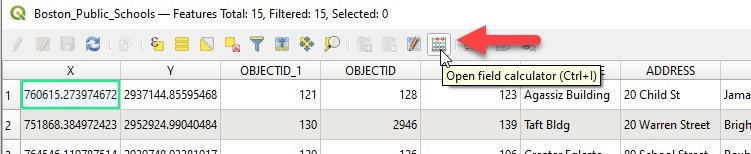
Next,
open the Field Calculator
From
here, we can calculate some new values!
For
some file types (e.g., CSV) you’ll create ‘virtual fields’ and will then have
to save your file with a new name to have them made permanent. For
editable file types, you can start editing the table, then add your
calculations, and just save the edits at the end and have them permanently
saved in the table.
For
any calculation you’ll define a few key things for your field:
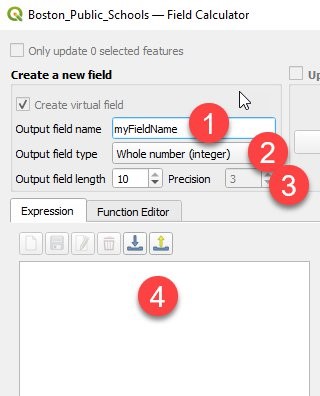
1) Output field
name
2) Output field
type
(e.g., will it be an integer or decimal number
3) Output field
length
(and, if relevant, precision) - to define the field size and number of decimal
places. This is particularly important when calculating values when you
want to ensure a level of precision in the result. You can’t change this
after the fact...
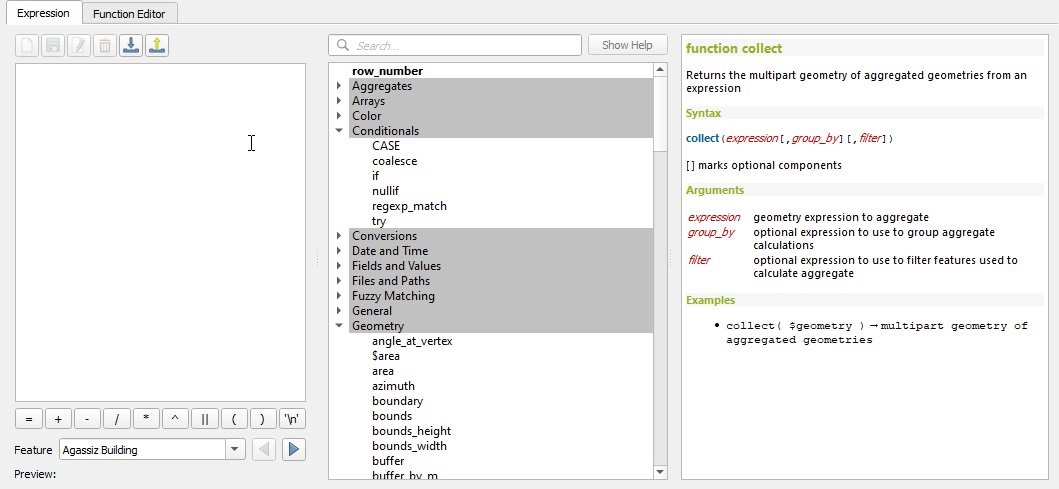
4) Expression - the
calculation itself. There is a great set of tools to help you with writing
your calculation—just look to the right of the Expression and you can search
for functions and see the help associated with each (much like Tableau).
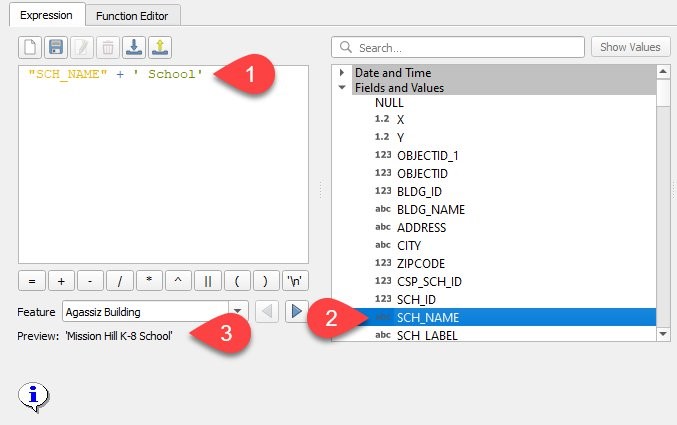
Here is an example of a simple calculation—I’ll add the word ‘School’ to the
end of each of the “SCH_NAME” attributes (#1 below). Using the lookup box on
the right, I can drill into the Fields
and Values section to find the attribute I want to work with (#2). I
can ten double-click to add it to my Expression. Finally, I just add + ‘
School’ to add the word to the end. Below the expression, the editor will show
a preview so that I can make sure I’ve entered the expression correctly (#3).
In
future posts, we’ll do more complex calculations involving geometry (the sorts
of things you can’t do as easily in Tableau).
Exporting Data
We’re
not going to do any big file trickery or manipulation in this post, but often,
such file trickery involves exporting a new version of the original
file. This comes in really handy when you’re working with spatial data
that is in a format that Tableau doesn’t (yet) recognize, like Well Known Text
(WKT). We can open the file in QGIS and then export it into a file type that
Tableau does recognize.
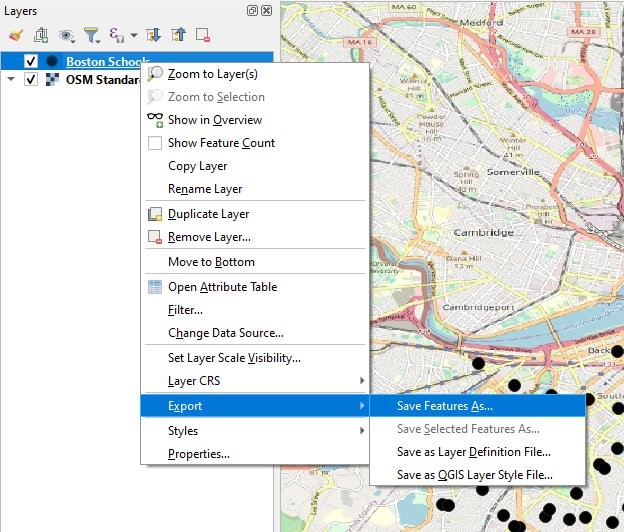
Whether
you’re working with points, lines, and polygons from a vector spatial file or
created from a text file (e.g., CSV), it’s the same process to export
data. All you have to do is right click on the file name in the Layers pane and Export → Save Feature As...
There
are a ton of options for the format to export your data. I generally use
ESRI Shapefile (because it’s been burned in my brain as the spatial file type after too many years in school and
teaching GIS classes with ESRI software). There are many options on this
list that Tableau will like such as KML or GeoJSON (the full list of acceptable
file formats can be found here).
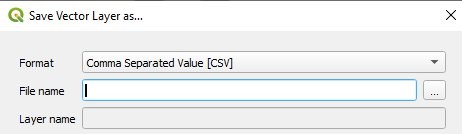
If
you don’t need the spatial components
of the file (i.e. you just want a CSV with attributes that you’ve calculated),
you can just export as a Comma Separated Value (CSV) file.
When
exporting spatial files, there are a few particularly handy options to know
about:
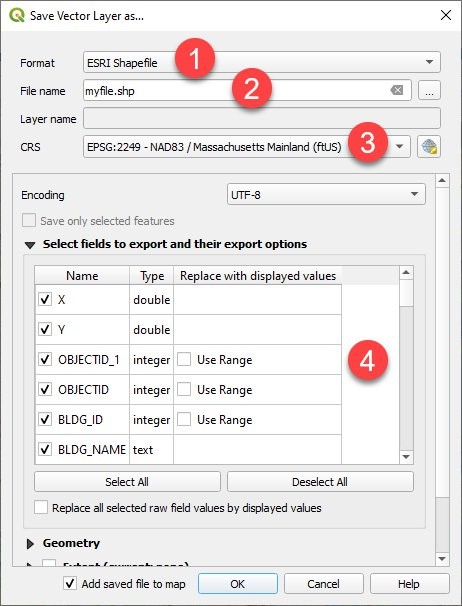
1) Format - Choose your
format, as discussed above.
2) File Name - Enter your
file name (and and remember where you saved it).
3) CRS - The
coordinate reference system. This will default to something smart based on
the CRS of your original file or the map in QGIS...but it’s better to double
check this to make sure it’s right! This is also the place where you can
redefine the coordinate system. So, if your data is in WGS84 (latitude and
longitude using the World Geodetic Survey of 1984) and you want it to be in
Massachusetts Mainland (ftUS) you can change it here! Just change the drop
down before you export.
4) Field List - Choose which
fields you want to export.
After
exporting your file, QGIS will automatically load it into a new layer that you
can continue to work with. Or, you can jump to Tableau and start analyzing your
spatial data there.
Coming
Soon!
Okay,
so that’s probably enough to get you started. But we’ve only scratched the
surface. In the next post, we’ll go into some manipulations you can do with
text files in the next post.
If
you want some practice while you wait for the next post, here are some great
QGIS tutorials (not Tableau-specific):
• Official
QGIS training materials
In
the meantime, if great questions or ideas come to you, feel free to reach out
on the Tableau Community Forums
or to follow more of the random Tableau spatial thoughts that I share on
Twitter (@mapsOverlord)...or to
share the great maps that you’re making in Tableau!
Sarah Battersby, May 3, 2021


No comments: