
VOTD - How to get Viz of the Day
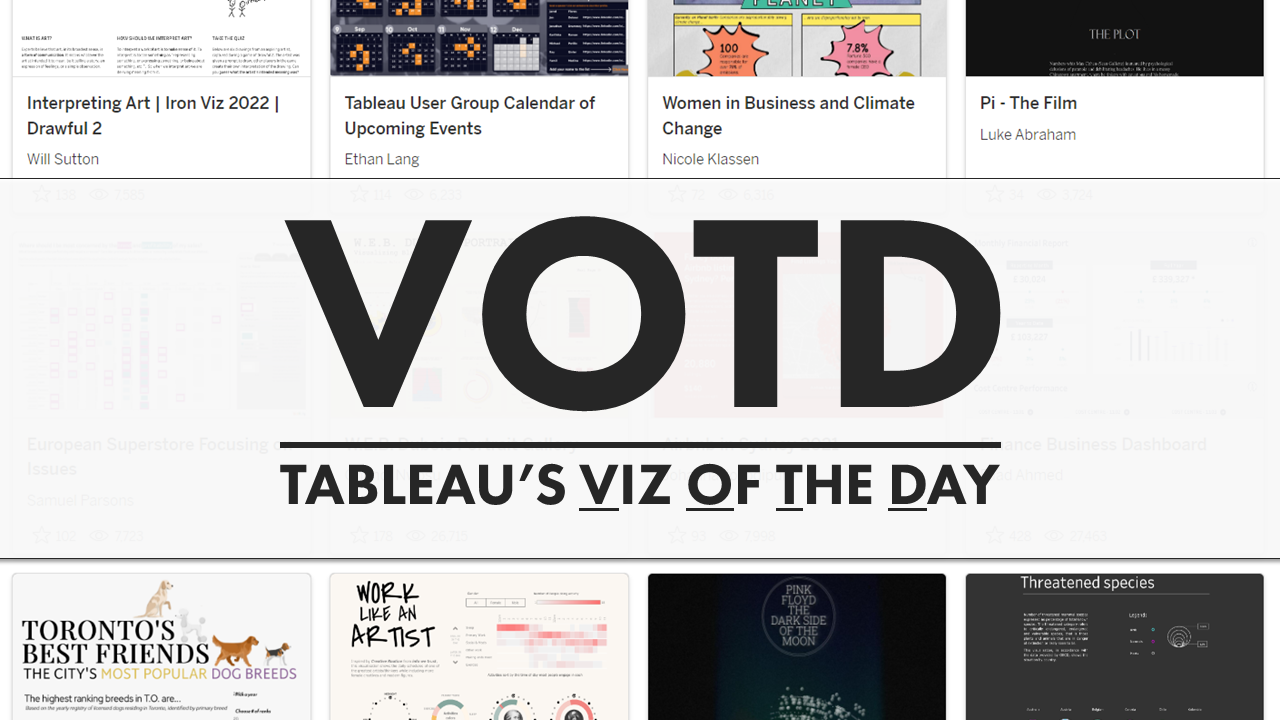
Pictured above are VOTDs from Will Sutton, Ethan Lang, Nicole Klassen, Luke Abraham, Sam Parsons, Chimdi Nwosu, Johanna Josodipuro, Fuad Ahmed, Julianne Kelso, Ha PL, Priya Padham, and Saverio Rocchetti
In this blog post, I will be discussing Tableau Public's Viz of the Day (VOTD), what it is, practices that will eliminate your workbook from being selected for VOTD, and things that will improve your chances of being selected for VOTD. Although this guide will help you understand the criteria, following it perfectly doesn't guarantee your viz will become a VOTD. Also, note that requirements have changed over time and will continue to evolve. For that reason, the guidelines set forth in this blog post are really only as good as the time in which it was written.
As a disclaimer, I have been given the blessing of the Tableau Public team to write this blog post, but please note that these are my words, not the words of Tableau.
It is important to know that getting a VOTD should not be your singular goal. Your goal should be to learn, grow your skills, to gain understanding of new subjects, and inspire others. I think it's okay to have a goal to get a VOTD, but it's important to not be discouraged if this does not happen as there are simply so many factors and so many amazing authors across the globe.
I should also note that David Murphy (Datasaurus Rex) has wrote about VOTD in the past, a blog post which I will be sharing more about later. What is Viz of the Day?
Every weekday, the Tableau Public team selects an outstanding viz as Viz of the Day (VOTD). Featured vizzes are added to the Tableau Public website, shared via social media streams, and sent out via email to VOTD subscribers. VOTD vizzes are seen by thousands of people worldwide. It provides a source of inspiration, learning, and community connection. And when you get your first one (or tenth one), it means the absolute world!
Based on the data compiled by Iron Viz winner, Will Sutton, using Tableau Public APIs, we know that the first VOTD was selected in late 2010. As of July 18, 2022, the Tableau Public team has dawned this honor upon a total of 2312 workbooks across 1285 unique authors. Former Visionary, Ramon Martinez has the most VOTDs at 20, all of which were published from 2012 - 2016. In the past five years, Spencer Baucke has more than any other person with 12, followed by Iron Viz finalist, Kimly Scott, with 11. (If you were curious, I have 4 and Ken has 8). If you want to learn more about the 2312 vizzes and 1285 authors, check out my redesigned VOTD Overview viz where you can really dig in.
Workbooks selected for VOTD can be accessed on the Discover page of Tableau Public. You can also subscribe for them to be sent directly to your email daily. And you have the ability to help select VOTDs simply by nominating your favorites.
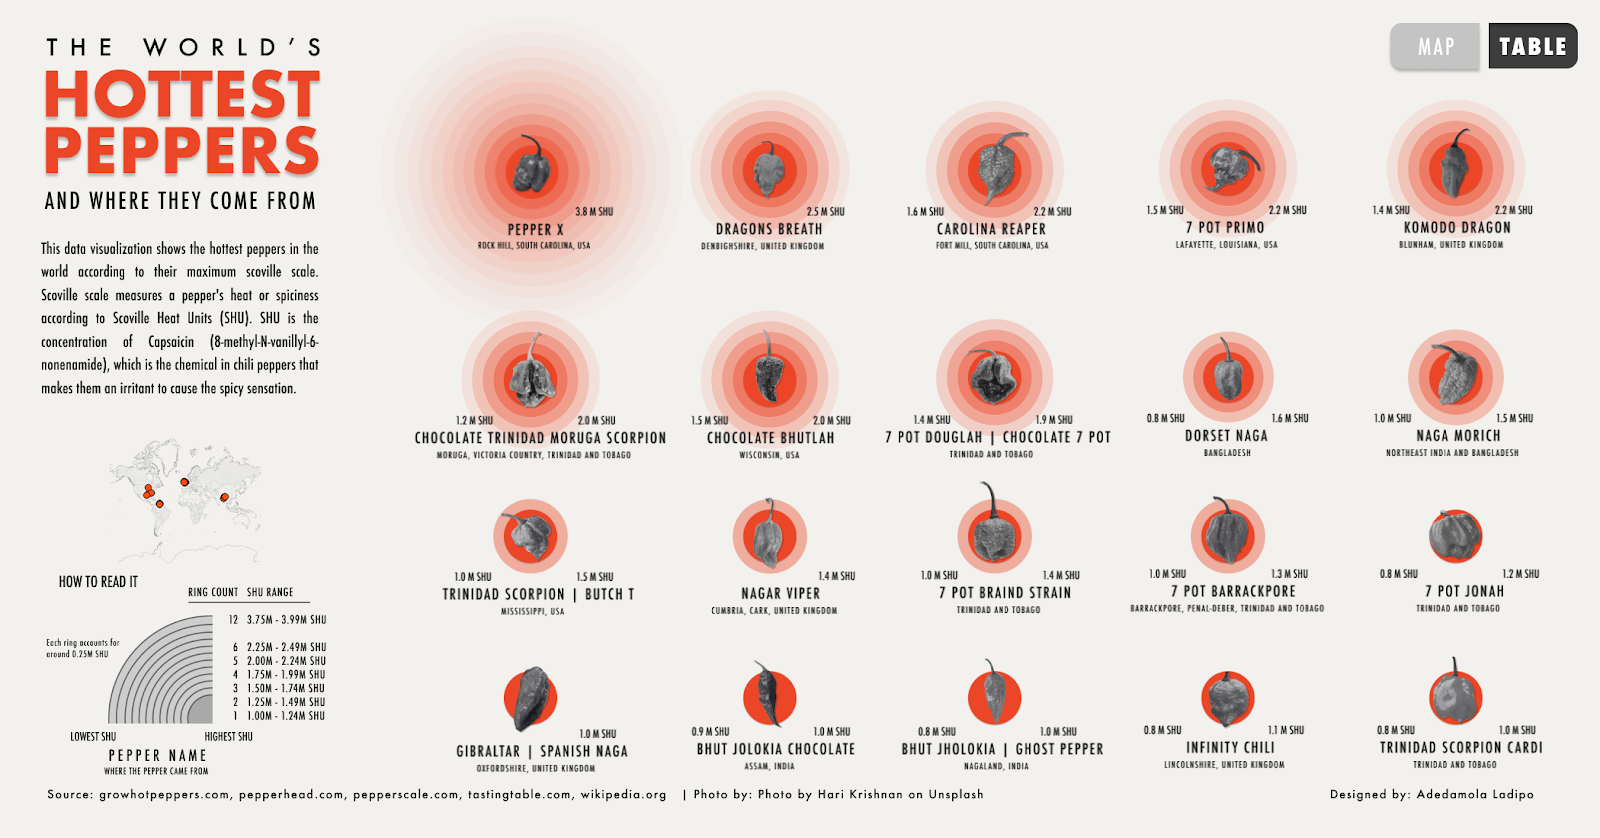
In this Viz of the Day, Damola Lapido investigates the hottest peppers in the world.
What are the Requirements for VOTD?
There are most certainly some requirements that must be met before your viz can be considered for VOTD. As mentioned above, this changes over time and will continue to evolve, so these guidelines are really only as good as the time in which it was written.
It must be built in Tableau and published to Tableau Public: your viz must have been built in Tableau and published to Tableau Public. Okay, that seems a bit obvious, but I have seen instances where visualizations were nothing more than one large image brought into Tableau without as much as a data source. I've also seen where authors build the guts of the viz completely in another tool then utilize Tableau for display and to share. This is not at the heart of VOTD. VOTDs are meant to highlight work done in Tableau.
It must be your own work: the workbook that you create must be your own work. It cannot be a downloaded copy of someone else's work. It's okay to "remake" another visualization, but if you do this, then say so boldly at the top - don't make it questionable in any way. That said, original work will always have a better shot of getting VOTD than a remake of another's viz.
It cannot contain logos: in most cases, logos are trademarked. If a viz contains a logo that is not owned by the author, it will be removed from VOTD contention. For example, if you create a viz about Netflix and include the Netflix logo, it will not be considered. This is the case for any logo, including that of sports teams. Above I mentioned that requirements have changed over time. If you look back at the history of VOTD, you'll undoubtedly see workbooks that contain logos. This is simply because requirements have changed since that time.
It cannot contain copyrighted images: similar to logos, if your viz contains copyrighted images, it will almost always be removed from VOTD contention.
As a side note, I should mention that I will occasionally use logos or images that I do not own in my personal work. There have been many discussions on the topic, and although I'm far from an expert in this field, my understanding is that it is considered "fair use" if the final result is not for sale nor you make any money off of it. So it is my opinion that using logos and images for personal vizzes on Tableau Public is a safe practice, although I strongly recommend citing the sources for each logo or image.
Note: if you get permission to utilize an image (or logo) then you should notate that in your viz.
Some wording or topics are subject to review: any politically sensitive topics or those related to diversity, equity, and inclusion will receive an equality review from Tableau. This doesn't mean that a viz about a politically sensitive topic will be dismissed, it means that it will simply undergo a review. There may be certain words or phrases, however, that ultimately cause it to be removed from VOTD contention. Please note, however, there have been hundreds of vizzes focused on subject matters that fit into this category, so please don't let this discourage you from creating them - it is crucial that we continue to create visualizations about these important topics.
Best practices matter: oftentimes, authors use Tableau Public to explore new chart types and different styles. There are certainly times when an "exotic" chart type will be featured for Viz of the Day even if that chart "should have been a bar chart". Just look at my Tableau Public profile...I have a lot of vizzes that meet that particular criterion. I've learned a ton by building these charts and I strongly encourage you to do so as well.
That said, best practices do matter. If you are building standard chart types, Tableau Public places great importance on following best practices. For example, if you truncate the axis on your bar charts or you utilize a color-blind unfriendly palette, it's very unlikely that your viz will be considered for VOTD. It is also key that your charts are not built in a way that is deceptive to the audience. The goal of dataviz is to provide understanding, not to deceive.
Cannot be created by Tableau or Salesforce: this doesn't apply to most of us, but if you work for Tableau or Salesforce, you are not eligible for VOTD - sorry Mark Bradbourne!
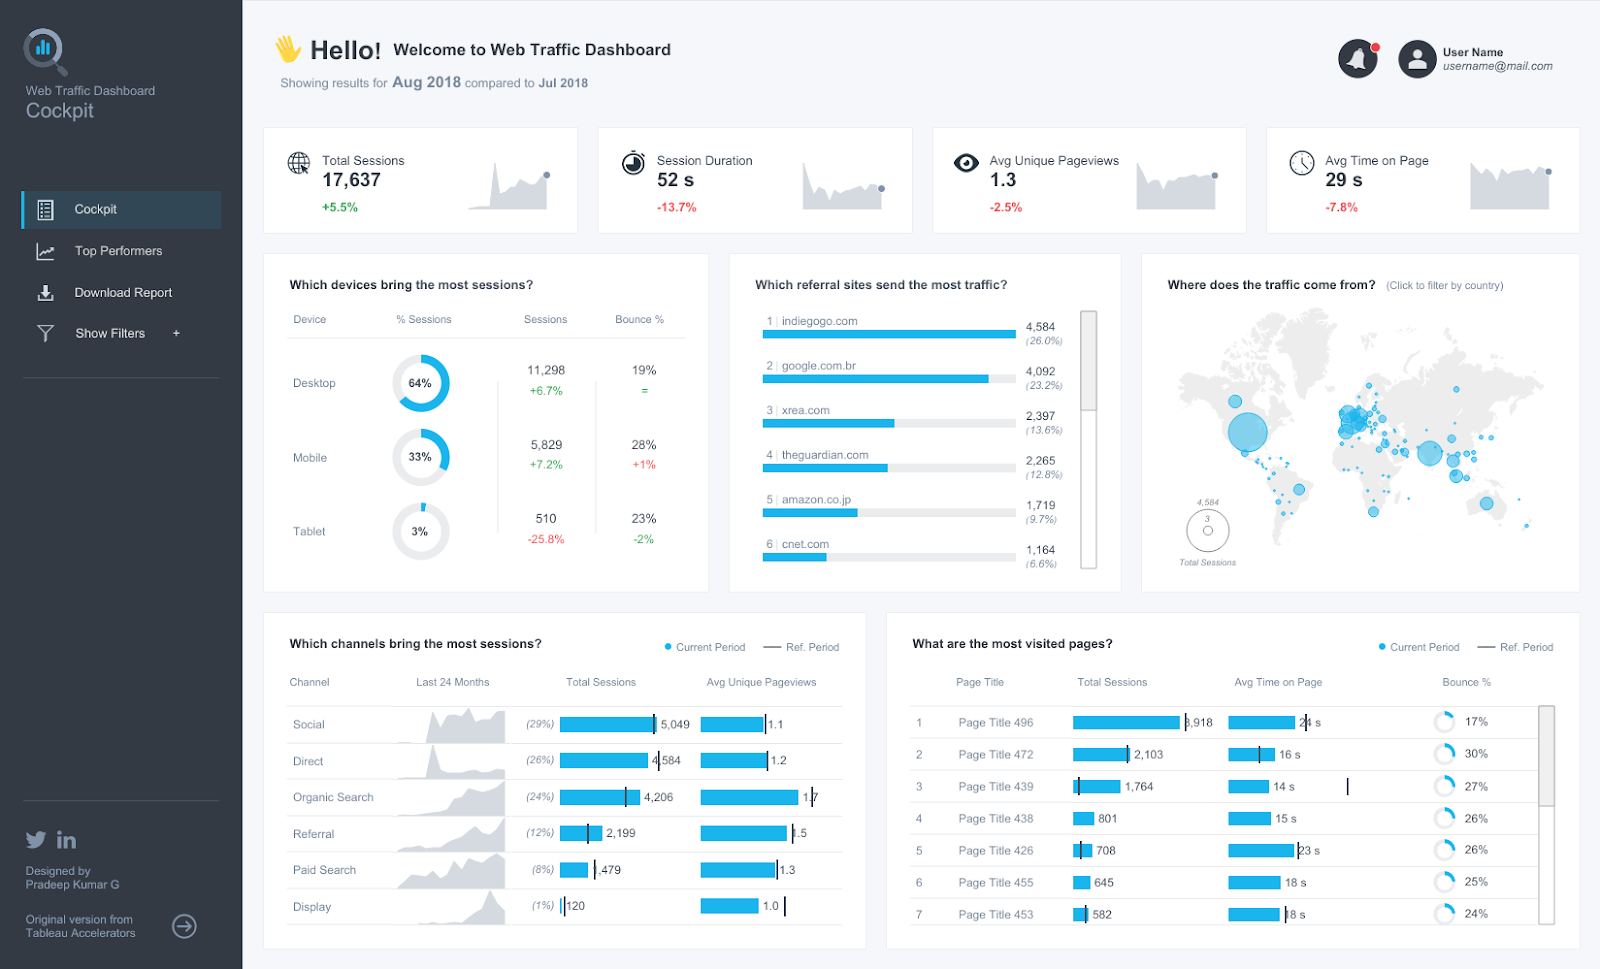
In this Viz of the Day, Pradeep Kumar G reveals his Web Traffic real word dashboard. (It is also the viz my VOTD dashboard is modeled after; Pradeep gave me the thumbs up to use it as well.)
What Will Improve Your Chances?
Now that we've talked about the requirements (i.e. the things that will remove you from consideration), let's talk about what will improve your chances of getting a Viz of the Day.
Let's start out with the blog post from David Murphy that I mentioned earlier. In that blog, David talks about six things that improve your chances of getting VOTD:
- Timely or topical
- Communicates a key insight or story
- Spotlights and elevates our diverse Tableau community
- Includes a novel chart type or trick
- Highlights new features
- Is visually stunning
Rather than me repeating what David already so eloquently wrote about two years ago, I encourage you to read his blog post before moving on with mine. He's a way better writer than me anyway!
On top of what David shared, there are other things that can help your chances of getting a VOTD.
Collaborative vizzes: viz collaborations with other people seem to get far more attention than vizzes created by an individual author and often pop up on the VOTD radar.
The viz should be downloadable: Tableau Public encourages people to share and learn from others and there is no better way than allowing your viz to be downloaded. Therefore, making your viz downloadable increases its likelihood of being selected. (Note, there are always circumstances where users cannot allow the viz to be downloaded so this is not a requirement, but it certainly helps).
Unique topics or angles: David talked about unique charts, but unique topics or angles often help elevate your viz and get more people talking (and nominating). If you utilize the same data source as another person and that other person gets VOTD, there may be a pause from someone either nominating your viz or selecting it.
Community project vizzes: above I mentioned that utilizing a similar data source might reduce your chances, but over time, community projects tend to land a ton of VOTDs, even though they often share the same data set. Perhaps this is because project leaders do such a great job of promoting the content of the people that participate.
Timing matters: the Tableau Public team does, in fact, take into account how long it has been since your last VOTD. If you are Chimdi Nwosu and absolutely everything you create is out of this world, but you got VOTD last week, it is very unlikely that you will be considered this week (or the next several weeks). The team will do their best to not choose the same author multiple times too closely together.
Tableau campaigns: oftentimes, Tableau runs campaigns where their goal is to focus on certain subjects or topics. Creating vizzes focused on these topics will increase your chance of being selected.
Share your work on social media: get more eyes on your viz by sharing it on social media. Twitter and LinkedIn have very strong Tableau and dataviz communities. There are also communities on Facebook, Instagram, and Tik Tok.
Be Spencer Baucke: although I'm just playing around a bit, Spencer is incredibly talented and has clearly cracked the VOTD code. If you want to be inspired and see some incredible work (as well as 13 total VOTDs), I suggest you check out his Tableau Public page.
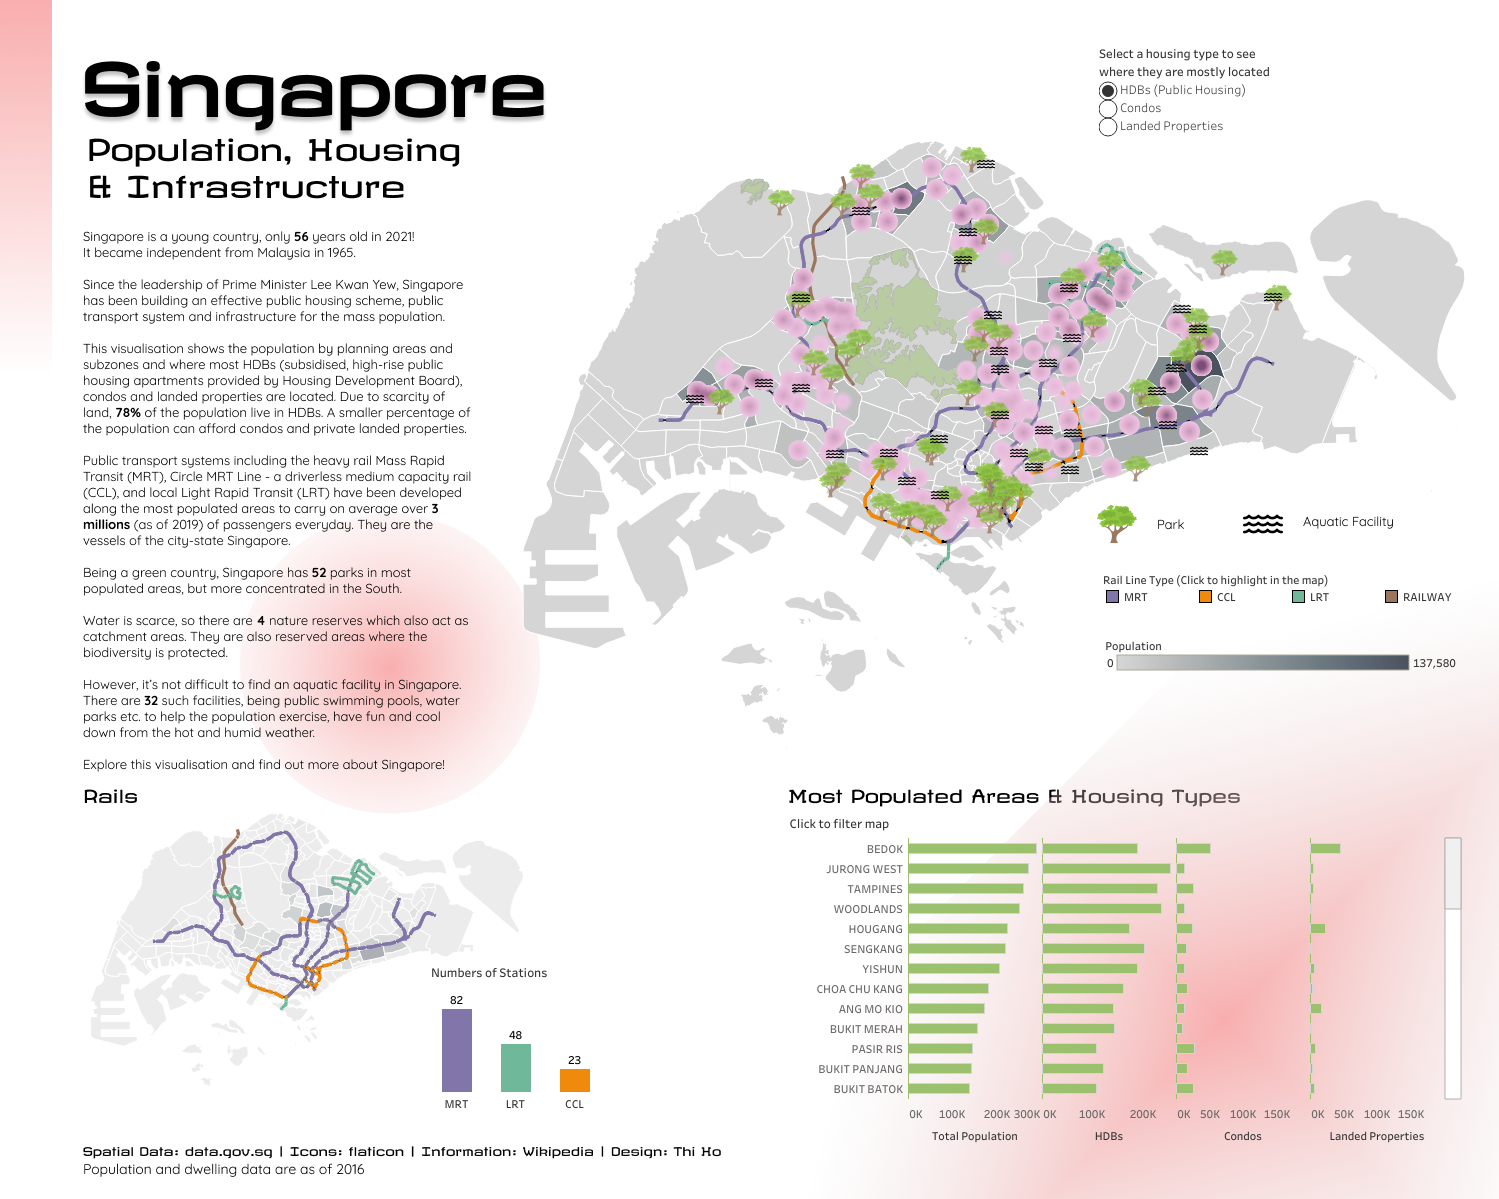
In this Viz of the Day, Thi Ho looks at the infrastructure of Singapore.
Wrap Up
So there you have it, some tips and tricks of what to do and what not to do. Please remember that an awesome viz, might not get VOTD. For example, Damola Lapido has 6 VOTDs (a big number), but every single one of his 36 vizzes is amazing and could have easily gotten VOTD based on merit alone. So don't stress it, have fun, share what you have created, and perhaps you'll be the next on the VOTD list!
Thanks for reading!!!
Kevin Flerlage, August 22, 2022
Twitter | LinkedIn | Tableau Public


Hm this is interesting. I work for Tableau and a coworker of mine won VOTD recently. Perhaps they've relaxed the rule on working for the company.
ReplyDeleteWho at Tableau got VOTD?
Deletehmmm. I wonder if University logos are ok. I work for said University and use our logos in my work but would still love to get a VotD.
ReplyDeleteHonestly, this criteria has changed so much since I wrote it. But if you use images or logos that you have rights to, I'd just notate that in the visualization.
Delete