
A Solution to the Hex Map Filtering Issue

Ever since I created my first hex map in Tableau, I've had a problem in which I never loved any available solution. That problem occurs when you utilize filters. Sometimes there is no data for a given state and that state completely disappears from your map. (Note that the same problem occurs with a choropleth map where you've turned off all layers).
Check out the map below. In this example, I've utilized four filters to drill down to values of interest to me. But at this point, I can hardly even tell this is a map of the United States.

So how do we resolve this issue? Well, in the past, I've utilized a couple different methods.
Map a Background Image
Four years ago, I took a screenshot of a clean hex map with no fill color, saved it as an image, then mapped it as a background. This was a great idea in theory, but in all honesty, it was painful. It was nearly impossible to get the coordinates lined up. It took forever and never looked that great. In fact, it was such a poor end result that I haven't done it since then.
Float a Sheet Behind
The method I typically utilize is similar to the background image. I bring in a new hex map data source (shapes, shapefile, etc.) that is not joined or related to my actual data. I create a sheet with that map. I then make sure that this "background" map is set up exactly like my actual map (the same axis ranges if using shapes or locked in the same zoom level if using a shapefile). This works fairly well. Alignment can be an issue at times, but the biggest issue is "what if you can't float?". This actually came up recently when I needed to do this in a collapsible container where everything needs to be tiled.
Completely Pad Out our Data
I'm not going to go into detail about this option as I think it's a major pain and the juice is simply not worth the squeeze. But, you could pad out your data in a way where those state values always have some value even if that value is 0 or null.
Set Actions
In the our TC22 presentation, Ken talked about how he uses set actions to do this. Essentially he recreates each filter using a set control and instead of actually filtering out values that are out of the set, he changes the hex shape to something else that makes it clear there are no values. Check out Ken's blog post on set actions for this exact example.
This is a really great technique and there is so much that I absolutely love about it. However, one drawback is that you essentially need to change all your filters over to set controls and create accompanying calculations in order to filter values and/or change shapes. Imagine having a dozen filters - that is going to create a lot of extra work.
The Best & Easiest Solution
There is, however, a really flexible and simple solution that solves all of the problems above.
As mentioned above, I recently needed to solve this issue, but to do so within a collapsible container. The background image solution was so rough that I really wanted to avoid it. Since it was in a collapsible container, I couldn't float a map behind. And although I love the set actions technique, this map had a dozen different filters. It was then that I had an epiphany!
In version 2020.4, Tableau released map layers functionality. And a year later, Tableau released functionality that allowed users to layer maps from different data sources. So to solve this issue, you could layer a blank background map behind an actual map and do so in a single sheet. We could then filter data on top so that when a state yielded no data, the background map would show through. Honestly, it was a perfect solution.
So let's build it!
The steps below will replicate the Hex Filtering viz on my Tableau Public page .
In this example, I'm using Superstore data which I have joined up to a padded hex map shapefile that was created by Luke Stanke. I typically use shape coordinates from Matt Chambers rather than a shapefile because I don't need to join to another data set (see tip number 10 in this blog post). But utilizing map layers is way easier using maps as it requires no hacks. Since shapefiles are maps, this technique will be much easier to implement using them versus shape coordinates. (If you are not familiar with all the ways to create hex maps, I encourage you to pause your reading in order to check out my What the Hex blog post).
Connect to Superstore and join to Luke's shapefile on State/Province = State. To build the map, go to a sheet and double-click Geometry, add State Abbr to the Text card and add Profit Ratio to Color. From here, add Ship Mode, Category, Segment, and Region to the Filters shelf. Once you've modified the colors, alignment, etc., your sheet should look similar to the following:
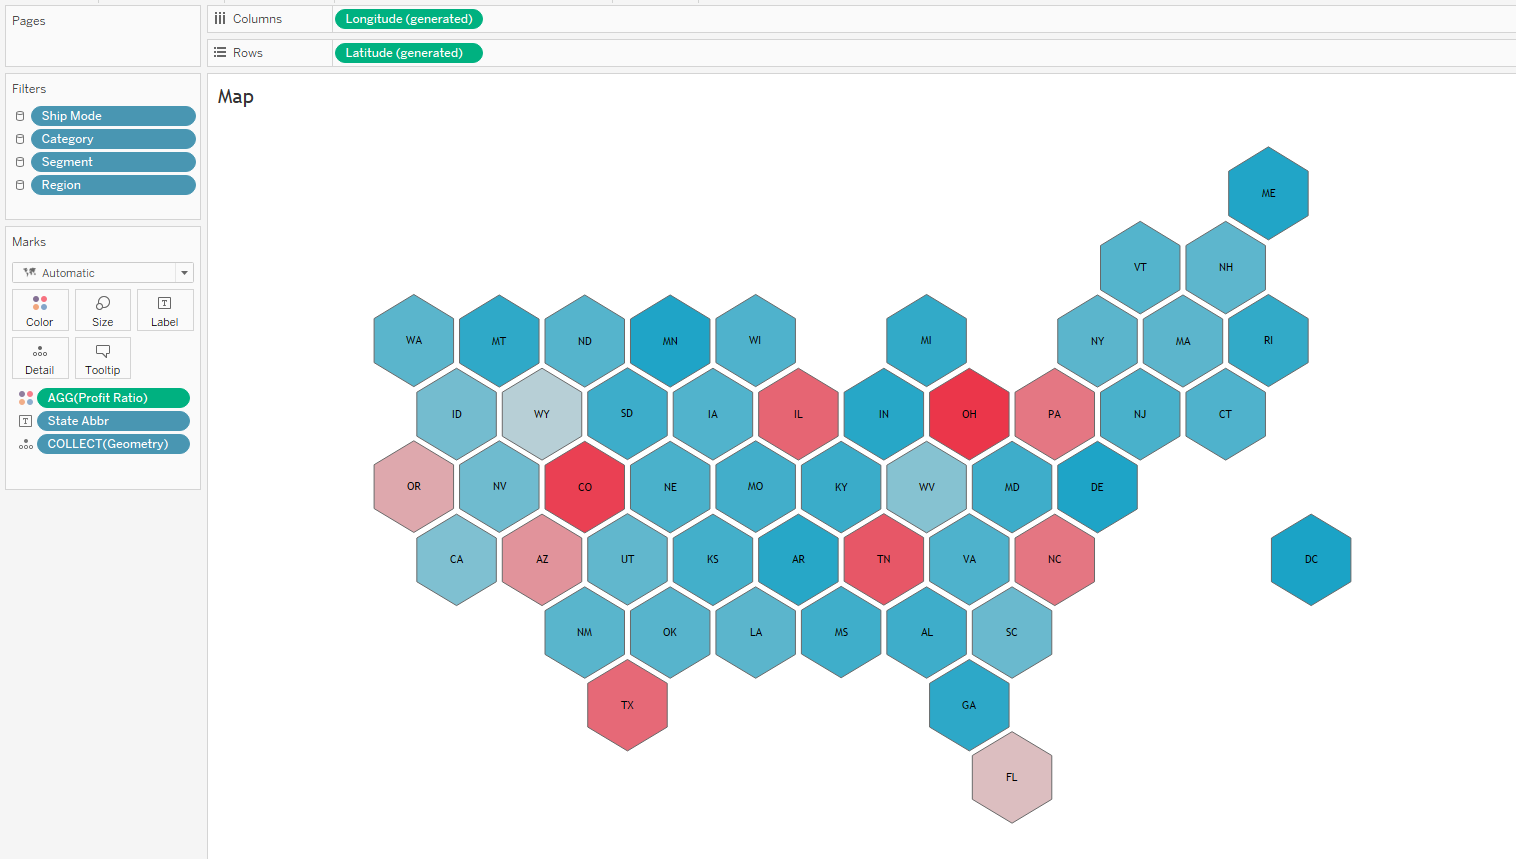
If you look closely at this map, you'll already see a few issues. Yeah that's right, Alaska and Hawaii have no data and therefore their hex shape is gone...it's not even on the map before we start filtering data!
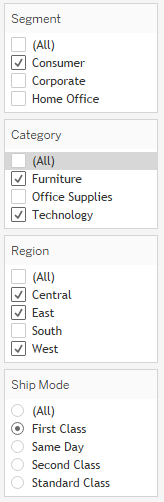
Okay, let's apply some filters. Set the filters as follows:
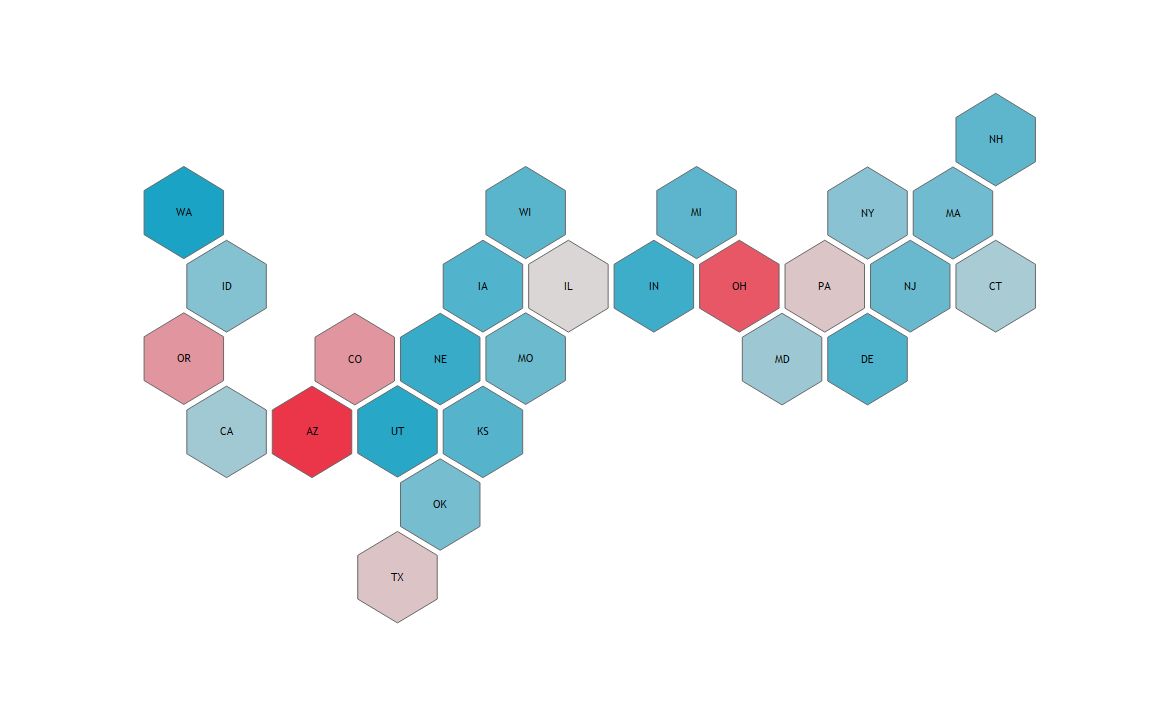
When you do that, your map will look like this...yuck! What country is this even a map of?
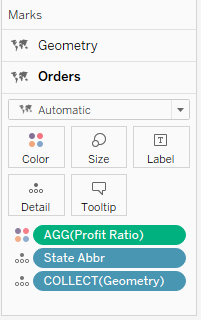
So let's fix it. Add a new data source and choose Luke's padded shapefile. Simply bring this in as a completely separate data source. Now go back to your map and at the top left, click on the HexStates Padded data source (the one you just added). Click on Geometry and drag it to the top left corner of your palette and drop it as an additional layer. Then move that layer to the bottom. These steps are shown below.
Now let's clean it up a bit. Click on the Geometry layer (the one you just moved down). Change the fill color to white. In the Color card, change the borders to light gray. Add State Abbr to the Text card, center up the label and change the font to light gray (make sure the font size is the same as on the other layer).
While you have the Geometry layer selected, look at your Filters shelf. You'll see that the filters are faded out. This tells you that your filters are not active for this layer. They are only active on the actual map layer.


Thanks for the blog Kevin. Can you please tell me from where can I get US hex map spatial file?
ReplyDeletehttps://www.flerlagetwins.com/2018/11/what-hex-brief-history-of-hex_68.html
DeleteThanks for the blog Kevin. Can you please provide the link to download spatial files?
ReplyDeletehttps://www.flerlagetwins.com/2018/11/what-hex-brief-history-of-hex_68.html
DeleteThanks for the help Kevin.
DeleteNo problem at all! :)
Delete