
Half Donut Chart in Tableau
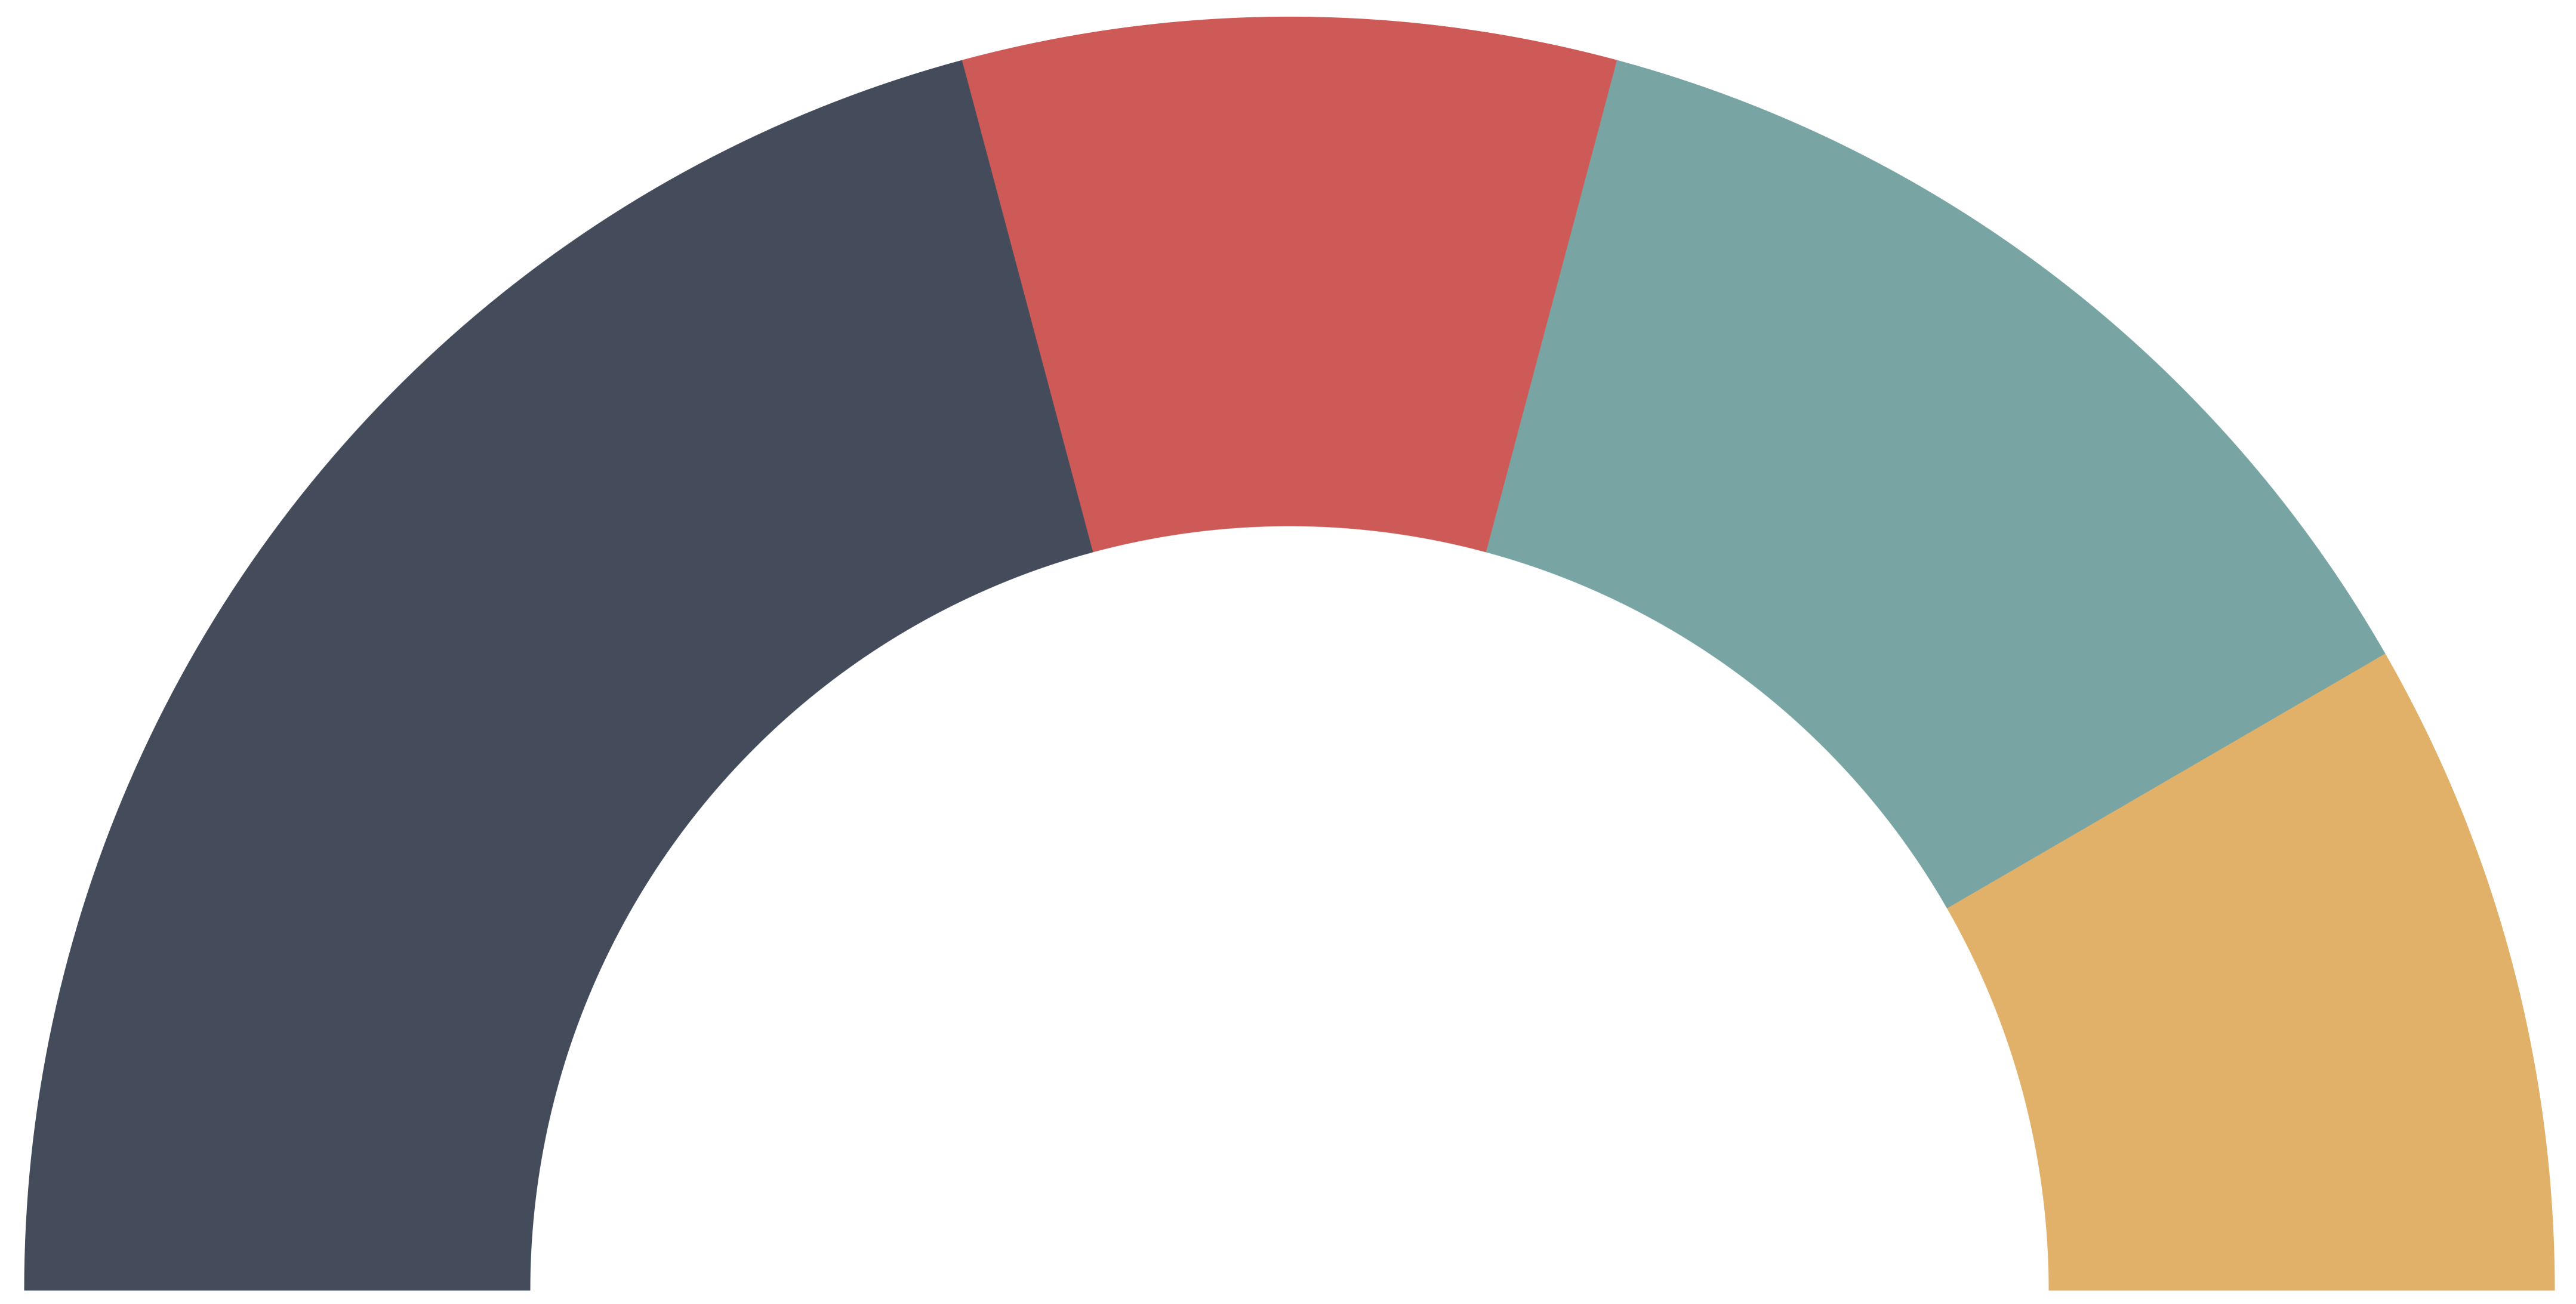
I am
regularly asked how to create a half-donut chart in Tableau, kind of like this:
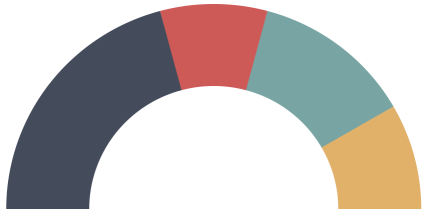
My first response is always to recommend another chart, partially because there is typically a better chart that is easier to understand and takes up less space, but also because it’s really hard to build in Tableau. Others have addressed the first part of this concern, so I’m not going to spend time on it here. Rather, I want to focus on what makes this chart so difficult to build in Tableau (don’t worry—I’ll provide a method for creating this chart at the end of the blog).
Haven’t You Done This Before?
When
I tell people that this is very difficult to build, they are often confused.
After all, I’ve created NPS Gauges
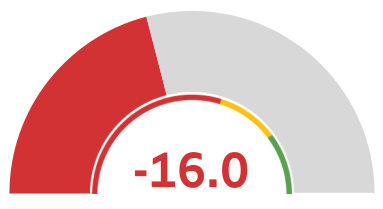
…and
Percentage Gauges
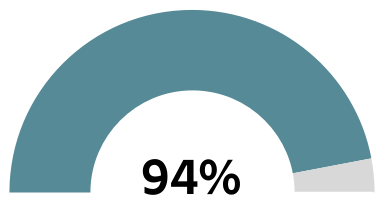
Plus,
regular donuts charts are easy to create in Tableau. So, why would a half donut
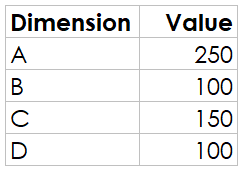
chart be so difficult? Well, let’s walk through it. We’ll start by creating a
donut chart using the following data.
This
can be done pretty easily through use of a dual axis chart—one axis using a pie chart and one using a circle mark
(to create the donut hole).
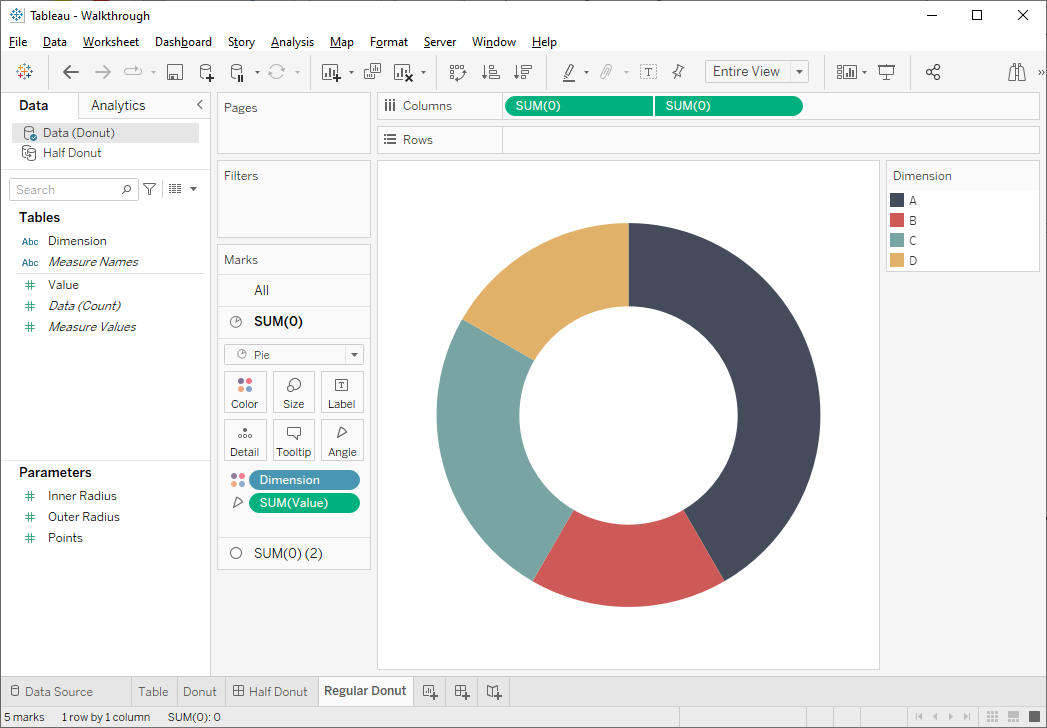
Note the position of Dimension A. Since this field is sorted
alphabetically, it’s the first dimension that is plotted and it starts at the
12:00 point, then moves clockwise. The first dimension is always plotted in this
way. But starting at that 12:00 point makes no sense with a half donut chart. Instead,
we want to start at the 9:00 point and move clockwise. If Tableau allowed us to
rotate the pie chart, then we could easily do that, but that’s not an option—we
can only start that first segment at 12:00.
This
brings me to the NPS and Percentage Gauges I’ve previously created. If the
above is a problem, how did I create these? Well, this was a big challenge as we
have to identify which segment crosses the 12:00 point, then split it up into
two segments—one to the right of the 12:00 point (our very first segment) and
one to the left (our final segment). My approach was to create a donut chart
with 5 pre-defined slices, as shown below.
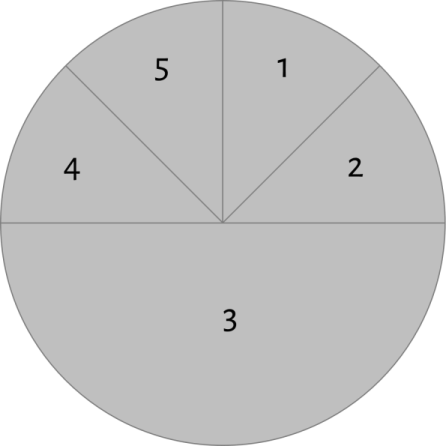
This
allows us to start at 12:00 and draw our slices clockwise. But it requires a
bit of math to determine the size and color of each of the slices. This is doable
because my NPS and Percentage Gauges only visualize one number—an NPS value or
a Percentage. Because of this, the chart really only has two segments. The
first is colored and shows the value, while the second is grey and shows what’s
left. So, using the five-slice technique, we need to determine which of the two
segments crosses that 12:00 mark. Based on that, we can break up the four
slices needed to create the chart (slice 3 is always the same size and matches the
background color so that it looks invisible). The logic for this is a bit
tricky and requires a fair number of calculated fields, but it’s doable.
But
what happens when we need to visualize a variable number of segments as with a
half donut? Unfortunately, in this case, the logic becomes exponentially more
complex, requires more than five slices, and involves the use of running sums to
determine the cut-off mark. Would this be possible? Maybe, but it would be really difficult.
At
this point, we should be asking if the juice is worth the squeeze. In almost
every case, I’d say no—this chart isn’t so special that it’s worth going through
all this pain to create it. In most cases, a simple donut chart, pie chart, or
something else entirely would suffice.
A Method for Creating Half Donuts
You
didn’t think I’d title this blog, Half Donut Chart in Tableau, then just
leave it at “don’t do it!”, did you? 😉 As I’ve said before, there’s almost
nothing you can’t create in Tableau. Unfortunately, due to what I’ve already
explained, pie charts don’t seem like a viable option for this type of chart.
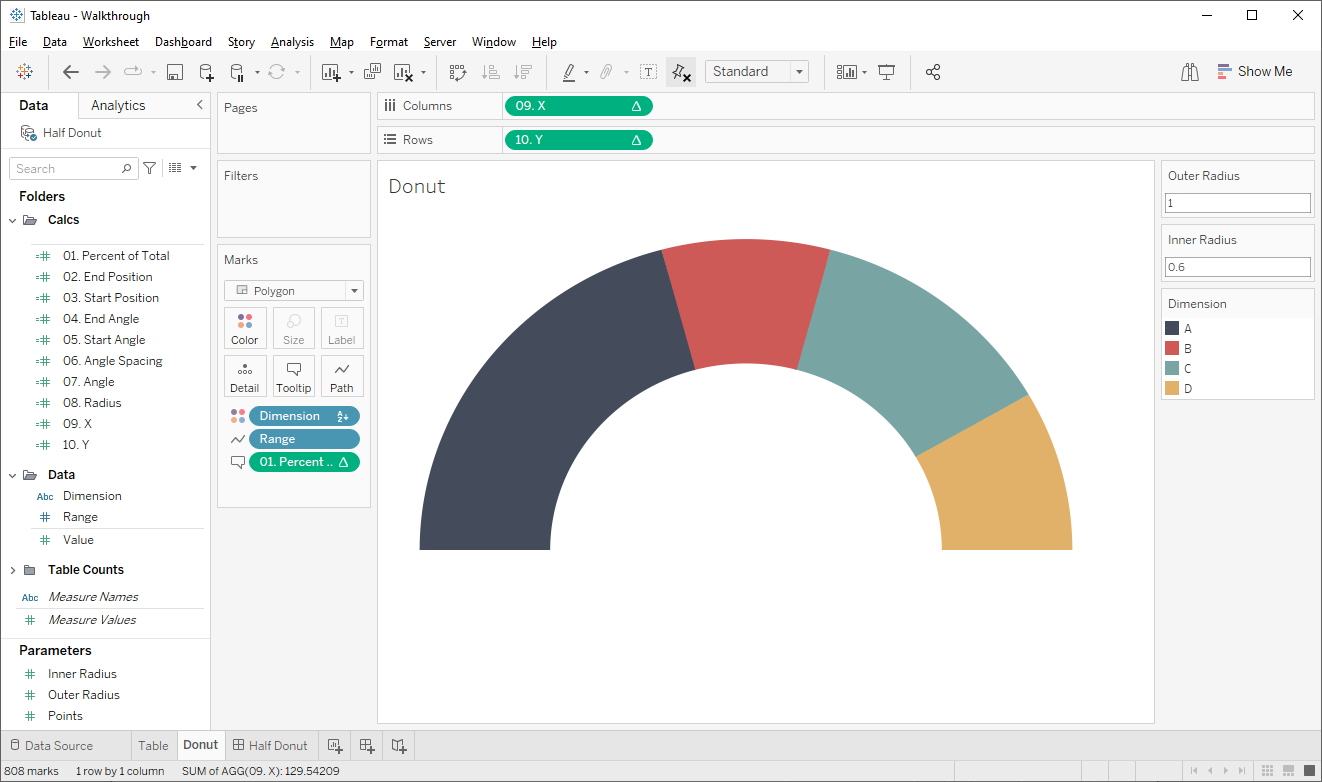
So, instead, I’ll be leveraging polygons. We’ll have to first densify our data so we can draw the curves using trigonometry. We’ll do the following using calculated
fields:
1)
Determine the proportion of the total for each segment.
2)
Use running sums to find the start and end point of each segment.
3)
Translate the start and end point into angles ranging from 0° (3:00) to 180°
(9:00).
4) Using
the densification points and trigonometry calculate the X and Y coordinates
around the outer curve of each segment then connect it to the inner edge then
draw that to complete each polygon.
In
the end, we’re able to produce the chart:
Feel
free to download the workbook if you’d like to take a closer look at the calculations.
As
you can see, this isn’t easy…and yet, I still felt like this was easier than
trying to figure out the pie chart logic. That tells you something! Once again,
I’d ask if the the juice is worth the squeeze?
Using the Template
Okay,
so maybe you’ve read all this, understand why it’s difficult and you still want
to use this chart type in your project. Fortunately, I’ve templatized this to
make it as easy as possible.
Like our
other templates, this one includes two components—an Excel spreadsheet and a Tableau workbook. The Excel spreadsheet has two sheets, Data and Model.
Model is used to handle the data densification needed to draw the curves.
You don’t need to worry too much about this sheet—just make sure it’s in your
spreadsheet. Data is used to populate your data. It contains two
columns, Dimension and Value. Dimension defines the individual
segments of the donut while Value is used to determine the size of each
segment. If you’d like to add new columns, that’s fine—just make sure you have
Dimension and Value.
Next
download the Tableau template. Edit the data source and connect it to your
Excel file. The workbook should update automatically to reflect your data.
If
you’d like to adjust the thickness of the donut, you can change the Inner
Radius parameter. Values closer to 1 will create a thinner donut, while values
closer to 0 will create a thicker one.
Wrap-Up
As I’ve
said numerous times already, if you’re considering creating a half-donut chart,
take a moment to think about whether or not it’s really the best option. This
type of chart has a number of problems and is also very difficult to create.
That said, like everything, there’s always an exception to the rule and there
are times when this might be the perfect chart. Just know that it’s not as
straightforward as a regular donut chart or even a gauge chart. If, after
reading all this, you still want to create it, feel free to leverage my
template. Thanks for reading! If you have any questions or comments, please let
me know in the comments.
Ken
Flerlage, December 11, 2022


I cannot download your tableau workbook, greyed out
ReplyDeleteOops. Can you try now?
DeleteI was able to reproduce the half donut with 3 segments. I had to use 6+1 slices, this took a bit of time but was able to figure out the formulas and it is working just fine. So thanks for this blog on how to build the half donut.
ReplyDeleteI now have another issue, i need to show the values for each of the 3 segments. Since it's not a simple pie and is a combination of different slices, I am not able to show the values. Any idea on how I can show the values / marks in the donut itself?
You mean you need it to show as a label on each section?
DeleteYes
DeleteYes. Show the label on each section.
DeletePolygons are difficult to label, so it wouldn't be easy. In that case, I'd probably recommend using a different type of chart.
DeleteApologies for not being clear. I had used your earlier method (NPS guage) to build the semi donut with multiple slices. While I see the option to add labels, it is proving to be a challenge since there are multiple slices that add up to one color.
DeleteAh I see. Can you email me? flerlagekr@gmail.com
Deletehello, may i know your formula to produce 3 segment. It's hard for me to produce 3 segment because i am at beginning using tableau
DeleteHello, I was wondering if i can ask you. I have use your tableau format with my data. The problem is the shape is not same with yours, which is full half donut but only with 1 dimension. How can i make same shape half donut chart with 3 dimension?
ReplyDeletePlease email me. flerlagekr@gmail.com
DeleteI know this is an older post, but I downloaded the template spreadsheet and workbook to see if I can make it work for me. Unfortunately, the values I entered into the spreadsheet (35.95, 37.25, and 26.8) were rounded at some point to 36.0, 37.0, and 27.0, respectively. Is this because of the join, where we define the relationship as 1 = 1? If so, is it possible to use values with digits after the decimal place, or am I stuck with rounded integers?
ReplyDeleteCan you email me with a sample workbook? It is possible I have a bug in the workbook.
Deleteflerlagekr@gmail.com
DeleteThis comment has been removed by a blog administrator.
ReplyDeleteHow can I create a gauge chart where I have data something like this
ReplyDeleteEquipment Category Usage Hours
Pump A Cat 1 400
Pump A Cat 2 380
Pump A Cat 3 500
Pump A Cat 4 300
Pump B Cat 1 200
Pump B Cat 2 450
Pump B Cat 3 360
Pump B Cat 4 250
and I want to create something like each equipment has total availability of 1920 hours in a year and want to show what % of time out of 1920 hours have an equipment spent in each category and then remaining hours from 1920 by gray color on gauge chart?
Could you email me at flerlagekr@gmail.com?
Delete