
Kirk Munroe: 4 Common Tableau Data Model Problems…and How to Fix Them

Kevin
and I are happy to have Kirk Munroe join us for the first in a series about
data modeling with Tableau. Kirk lives in Halifax, Nova Scotia, Canada and is a
business analytics and performance management expert. He has held leadership
roles in product management, marketing, sales enablement, and customer success
in numerous analytics software companies including Cognos, IBM, Kinaxis,
Tableau, and Salesforce. He is currently one of the owners and principal
consultants at Paint with Data, a visual analytics consulting firm,
along with his business partner and wife, Candice Munroe, a two-time Tableau
User Group Ambassador and board member for Viz for Social Good.
Kirk is also the author of Data Modeling with Tableau, an extensive guide, complete with step-by-step explanations of essential concepts, practical examples, and hands-on exercises. The book details the role that Tableau Prep Builder and Tableau Desktop each play in data modeling. It also explores the components of Tableau Server and Cloud that make data modeling more robust, secure, and performant. This blog will give you a taste of what’s available in the book, so if you find this useful, go buy the book!
I first saw Tableau in action way
back in 2007. I was working as a product manager in a much bigger BI company
(at that time) and I was immediately impressed. For example, bringing a measure
and a date field to a view and having Tableau automatically create a line chart
was a game changer. This was the breakthrough in making analysis accessible to
non-technical users and making analysis fun for analysts. (Why did I have to
keep telling my BI tool HOW to visualize data?!?!)
We now know this is driven by
Tableau’s proprietary VizQL language. The patented language combines query,
analysis, and visualization into a single framework. Other BI tools would query
(SQL, MDX), arrange the data through analysis, and then chart the data from
memory in three distinct steps. For the magic of VizQL to work, the data needs
to be in a very neat tabular format with the following characteristics:
1) Every column needs to contain
values representing a distinct field, ideally free from null values.
2) The data needs to be at the lowest
level of aggregation that the analyst needs to answer questions and no rows can
be missing.
Fortunately, data is usually stored
this way. In the beginning, if your data wasn’t, Tableau left it to us to find
a way to get the data in the right format. But, in the years that have passed,
Tableau has given us numerous ways to solve these data modeling challenges. In
this post, I will talk about four of the most common data modeling challenges
I’ve encountered and how Tableau can be used to solve them.
1) Data is Too Wide
The most common problem I see is data
models that are too “wide”? By “wide”, I mean that similar or related data are
stored in multiple columns. Financial data is often in this format. Take the
following example:
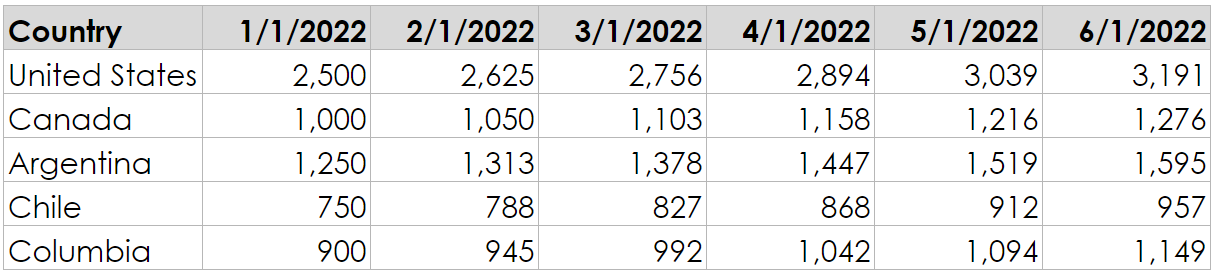
The six months are in separate
columns, and the sales values are in cells. To visualize this data, we might
want to create a chart kind of like this:
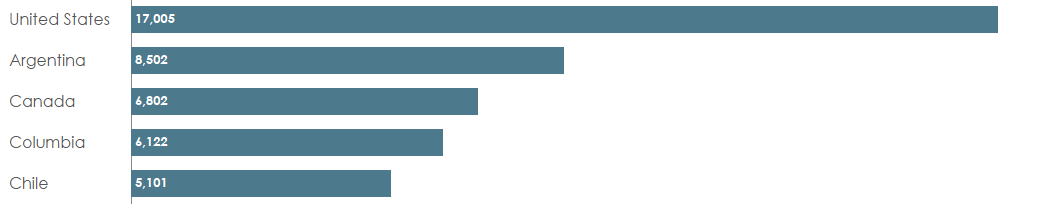
This chart is pretty difficult to
create with the data in the original format. And it gets even harder when you
want to filter on dates or want to combine it with other data such as sales
targets. The ideal would be a “tall and skinny” shape with one column for the
date and one for the sales.
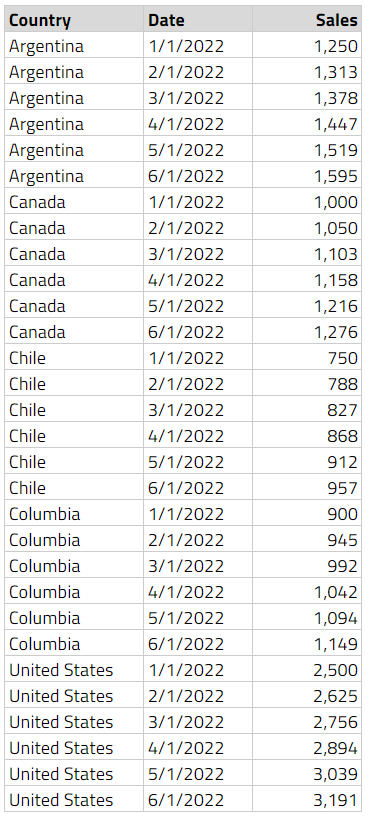
These six columns have now been
converted to two—one containing the dates (taken from the names of the original
columns) and one containing the sales amount from each of those columns. With
data in this structure, we now have a lot more flexibility in Tableau.
To get data into this shape, we need
to pivot our columns to rows. Ken has already written about how to do this so I
won’t go into any more detail—check out his blog, 3 Ways to Pivot Data for Tableau.
2) Data is Too Skinny
While Tableau often likes data to be
tall and skinny as detailed above, there are situations where this layout
simply doesn’t make sense. An example is when we have conditional measures
names in one column and measure values in another as shown below:
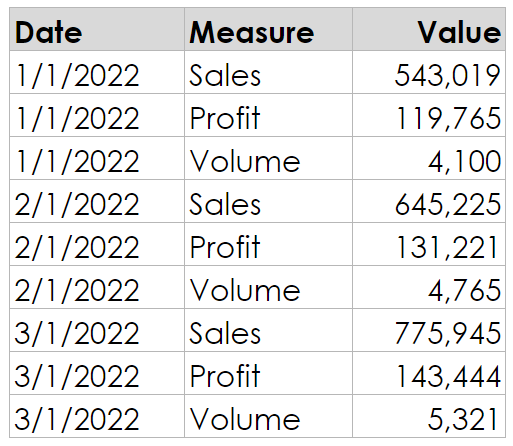
Tableau Desktop does not have a great
way to deal with this scenario. People often try to deal with this by creating
calculations like:
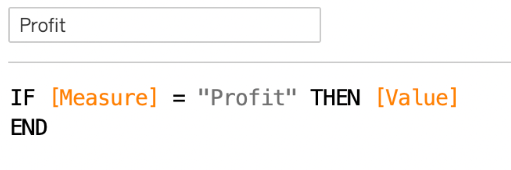
After repeating for Sales and Volume,
we end up with a data model that looks like this:
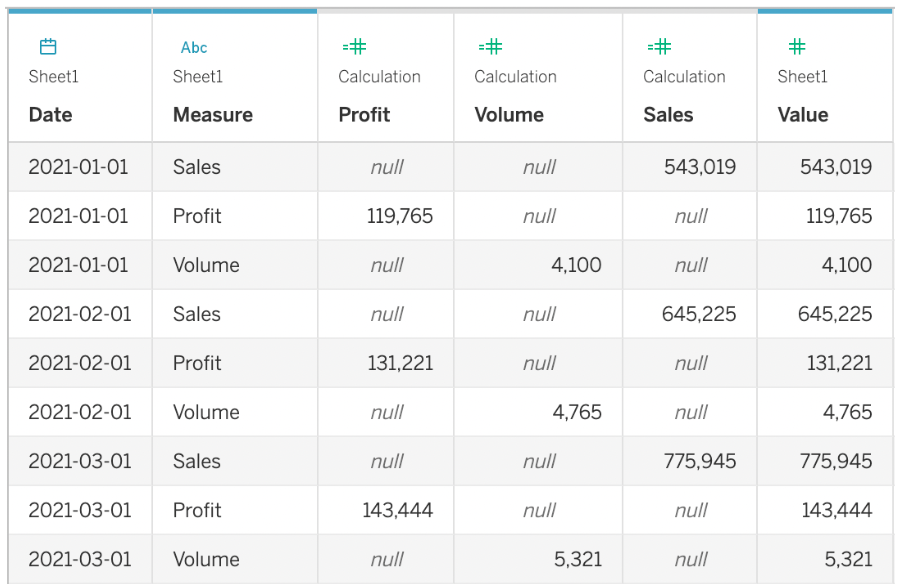
This creates many problems for
Tableau:
1) Row-Level Calcs - There is no ability to do row-level calculations.
For example, if you want a row-level calculation of Profit Margin, there is no way to divide Profit by Sales as they don’t exist on the same row. You would have
to aggregate the data first to create the calculation.
2) Performance - The workbook is going to be slow to open. Tableau
will need to materialize these new fields every time the workbook opens. Often,
the data has a third column adding additional context. In this case, the viz
level of detail might force a calculation that Tableau can’t materialize.
3) Aggregation - Aggregating NULL values can cause problems so we need
to really think about how to handle them.
I once worked with a company that had
data in this format. There were less than 5 million rows and the workbook took
35 seconds to open. Changing filters took 10+ seconds every time. It was effectively
unusable. After restructuring the data using the process shared below, the
workbook opened in less than 2 seconds and filters were almost instantaneous.
Plus, we cut out dozens of calculations in the process!
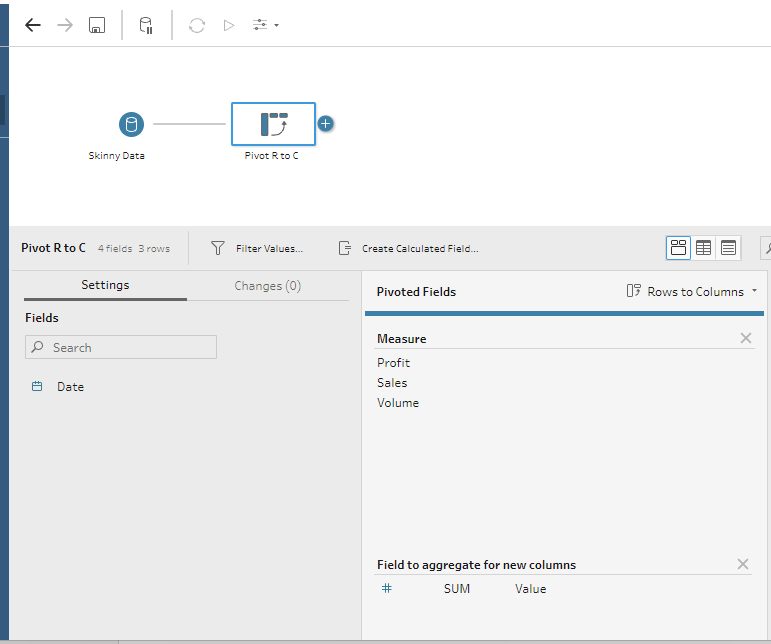
In this case, we need to pivot data
from rows to columns (the opposite of # 1). Tableau Desktop doesn’t do this,
unfortunately, but Tableau Prep does! To do this, first create a pivot step and
set the pivot option to “Rows to Columns”. Next, drag your measure name field
(in our case, Measure) to the
“Pivoted Fields” section, followed by the measure value field (in our case, Value) to “Field to aggregate for new
columns” and voila! Done!
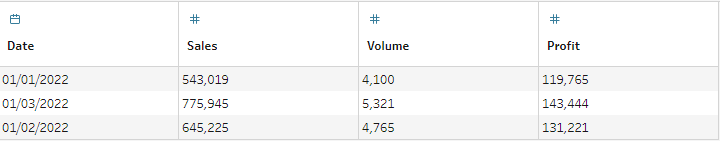
We now have a wider data model that
works much better in this situation.
3) Data is Too Short
Another use case that happens
frequently is when our data is aggregated at too high a level for the analysis
we want to perform. It isn’t always possible to disaggregate our data, but we
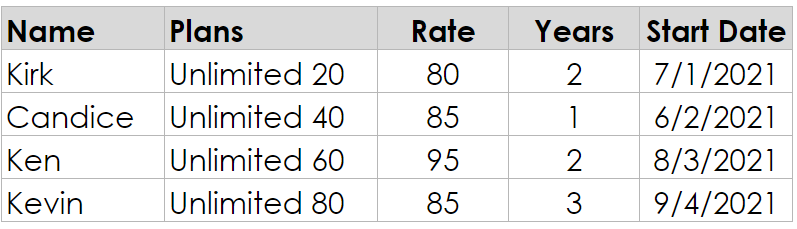
can often add missing rows to make the data easier to work with. For example,
let’s say we have data with subscriptions. Each subscription has a single row
with the start date and period of the subscription.
With this data model, it is almost
impossible to answer point-in-time questions such as “How much revenue will we
be receiving in January, 2023?” While there are ways to address this problem,
they typically involve complex table calculations. This inevitably leads to
performance problems and an incredibly fragile workbook, with one hack built on
top of another, just to get things to display as desired. It is so much easier
to address this in the data model, rather than using table calcs.
Fortunately for us, thic can be
quickly resolved using Tableau Prep’s Add
New Rows feature.
To do this, we first need to have an End Date. In a Clean Step, we create a calculation called End Date. The calculation looks like this:
End Date
// Add 12 x Years to these start date.
// Use Date to ensure this is a date, not date/time
DATE(DATEADD('month',
([Years]*12)-1, [Start
Date]))
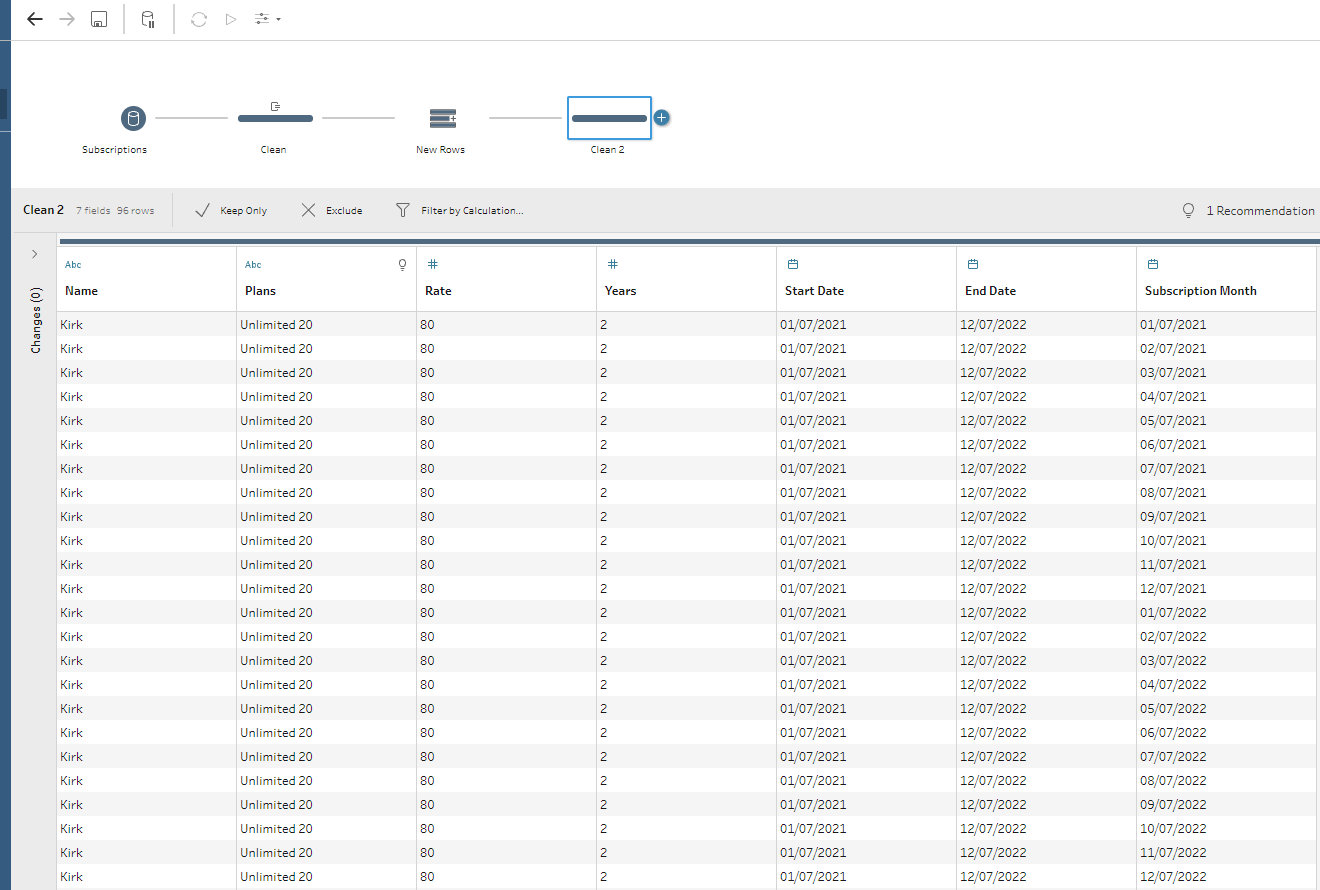
Now that we have the date when the
contract ends, we can create a row for every month between the start and end of
the contract. We do this with a New Rows
step like this:
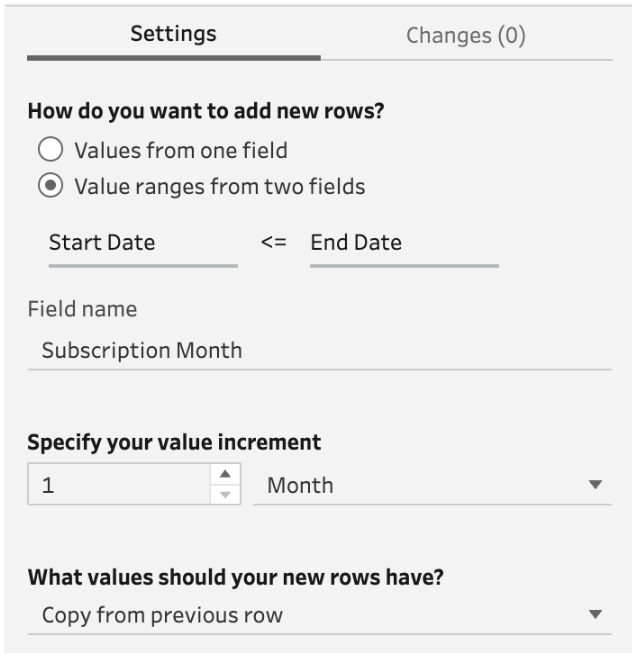
Here we are telling Tableau to add 1
row between the Start Date and End Date (including the End Date). We give it a name called Subscription Month, at the level of
month, and copy the value from the previous row. In other words, we want the
same value in every month.
If we preview this model in Tableau
Desktop, we can easily answer the question of how much money do we having
coming in during the month of January 2023. It is $260!
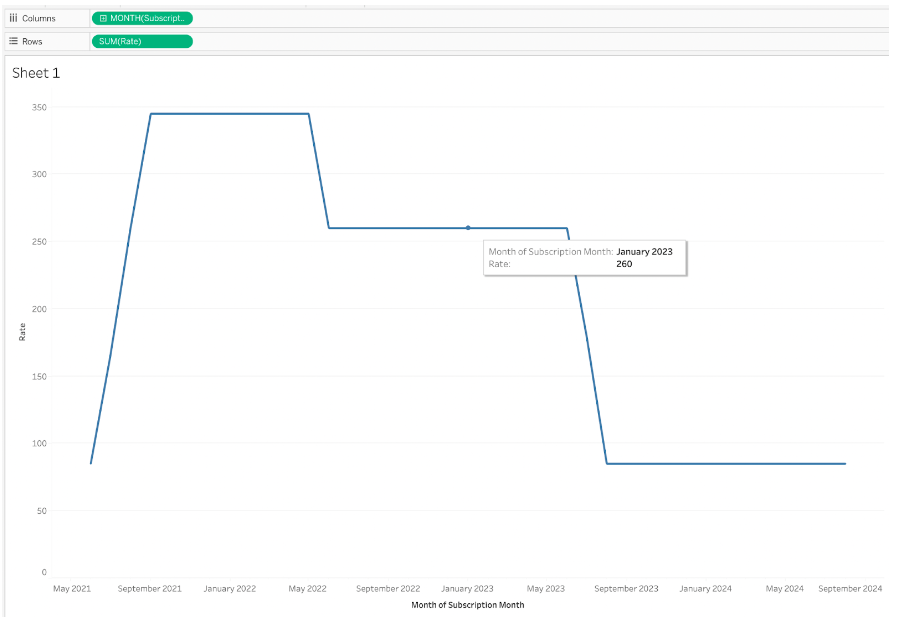
How much easier is that!!
There are so many cases where adding
rows can be a lifesaver. Another example is a marketing campaign where we get
zero responses on some days so they are never recorded. In this case, we would
want to create new rows and have a 0 in the new rows.
Once you know how to do this, you’ll
see opportunities to use it all the time!
To achieve the same outcome without
Tableau Prep, we would need to scaffold our data as detailed by Ken in Creating
a Date Scaffold in Tableau. While it isn’t hard per se, it
takes extra steps and isn’t quite as straightforward as simply adding the new
rows as detailed above.
Note:
Ken also details how to create a scaffold using Tableau Prep but the New Rows
feature didn’t exist at that time.
4) Data is Too Long
The last common data modeling problem
I see is when your data is too long. Consider Tableau’s Superstore sample data
which has data that is very disaggregated. There is a row for every product
sold in each transaction. But, imagine how much real world data this would be
if you were analyzing IKEA or Costco data—every person in the long check outs
lines would be responsible for one row of data for each product in their cart.
Multiplied by all the people all day long, by all the stores on the planet, by
3+ years of data. That’s an astronomical number of rows and the sheer volume of
that data could lead to all kinds of problems!
But, does anyone need this much data
for analysis?
Someone responsible for the
operations of a store in a given region would likely be happy to analyze store
trends and compare their store to others. Someone in investor relations would
need data rolled up to the month—or maybe even the quarter. A store manager
would likely want to know various information about their particular store,
such as the busiesest time of the day by section, but they would only need
their store.
The point is that, for most analysis
use cases, the data likely doesn’t need to be this disaggregated. The data is
just too long and will slow down analysis with slower queries and too much data
to wade though.
To address this problem of data being
too long, Tableau gives us the ability to aggregate data in both Prep and
Desktop when we are using extracts.
The option to aggregate in Tableau
Prep is more robust than Tableau Desktop and gives us more control over the
method of aggregation. Before we jump in, it is important to always consider
the level you want to aggregate. For example, if you use Superstore and
aggregate to the day and category, you will get 3 rows per day (one ro for each
of the three categories). If you aggregate to the level of subcategory, you
will get 17 rows per day.
With that, let’s jump into Tableau
Prep. If you want to follow along, I’m using the 2020.3 Superstore data
posted on data.world by Andy Kriebel and I’m using Prep Builder 2022.3.0. The
orders sheet (table) has 9994 rows.
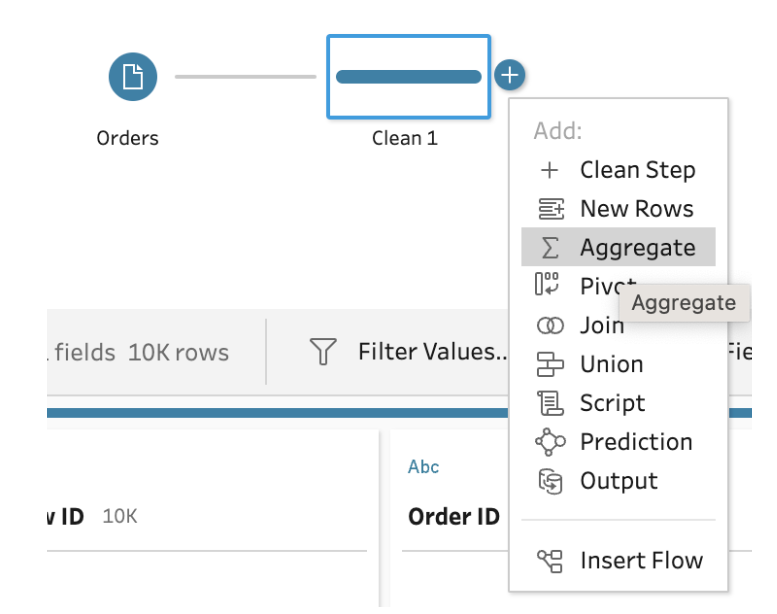
After bringing our Superstore sales
order data into Prep, we first add a clean step (it’s always a good idea to add
a clean step between all other steps to make sure the data is profiled
correctly!) and then choose a aggregate step:
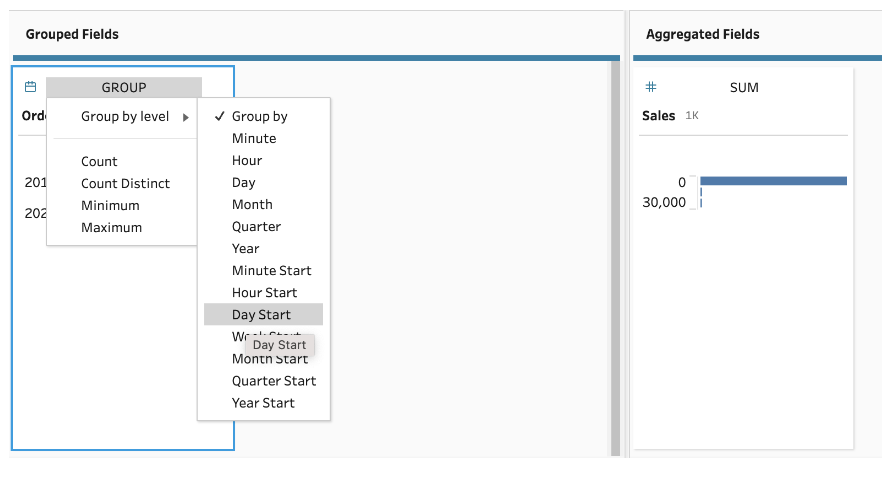
We will take the most simple case,
and add Order Date to “Grouped
Fields” and Sales to “Aggregated
Fields”. Next, click on the GROUP above Order
Date, select “Group by level”, then select “Day Start” (Day Start will
truncate any times to midnight). We can leave the SUM above Sales as that is
the way we want it aggregated—that is, summing the Sales for each day:
If we add a Clean Step, we will see
that we are down to approximately 1,000 rows or approximately 1/10th where we
started. However, there isn’t a lot of analysis we could do with this data,
just total sales by day. So, let’s go back to the the Aggegrate Step and add in
Category and Subcategory to the Group by fields and add Profit, Quantity, and Discount to the Aggregated Fields.
Click back on the Clean Step after the Aggregate Step to see the profile of our
aggregated data now:
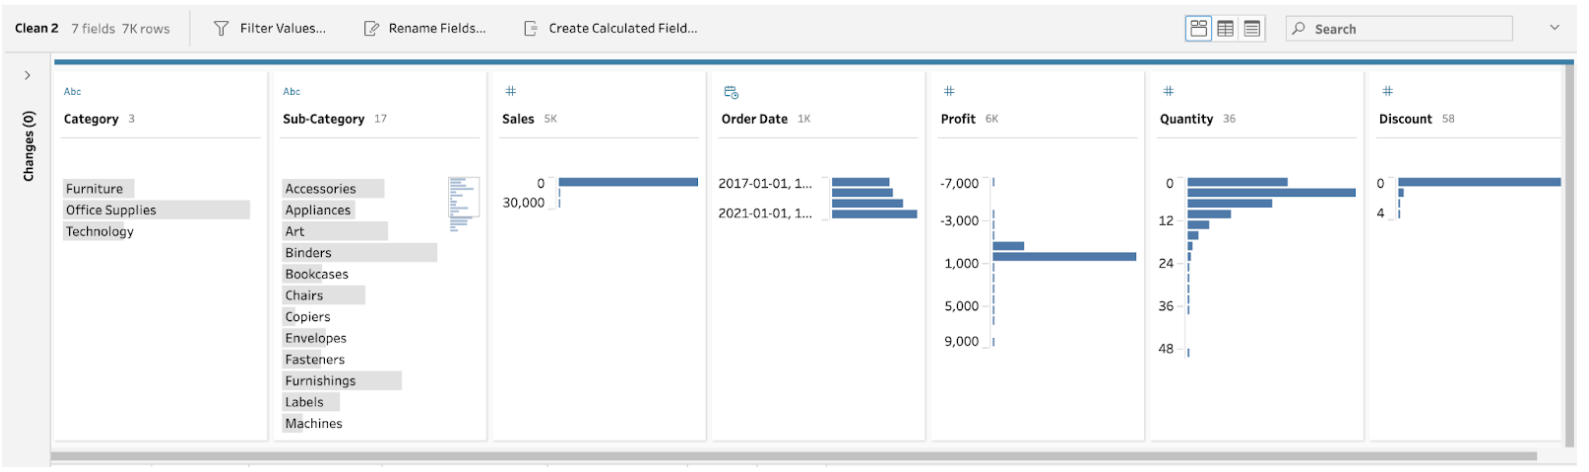
Now we see that we have approximately
7,000 rows and have enough fields for analysis to answer questions on sales, profit,
quantity, discount by category and subcategory—still a lot of possible answers!
With this sample data, we only
reduced our row count by about 30% but this is due to Superstore sample data
not being very robust. For a successful real-world retailer we’d likely see a
much greater reduction of rows.
Conclusion
In closing, think of your Tableau
data models like Goldilocks would—not
too wide; not too skinny; not too short; not too long. If you have your
data shaped “just right”, analysis is going to be so much easier! The good news
is that Tableau also makes reshaping your data quick and easy. I’m hopeful that
the tips I’ve shared here help you to recognize and correct those scenarios
where some data reshaping would be useful.
My book, Data
Modeling with Tableau, covers these and many other use
cases and scenarios. In addition to modeling in Tableau Desktop and Prep
Builder, it covers virtual connections, securing and sharing data models,
creating models in the Tableau web interfaces, data model considerations for
Ask and Explain Data, and data catalog and lineage. It is now available on
Amazon in ebook and print formats.
Thanks for reading!!
Kirk Munroe
January 3, 2023


No comments: