
Ten Tips & Techniques Including the Easy Way to Use GIFs (Round 6)

Well, I've done five previous Ten Tableau Tips blog posts, how about a sixth one? I hope at least one tip is something you've never seen before.
Please note that some of these GIFs may appear small on screen. They are, however, recorded at a higher resolution. For a closer look, you should be able to simply zoom into your web browser or right-click and open in a new tab (which will show it as it was recorded).
1. Zoom Ability in Desktop
A few months ago, I released a video showing 5 things you can do in Web Edit, but not in Desktop; one of those was the ability to zoom in. However, that has changed...to some degree. You all probably know that you can use the mouse wheel (or touchpad) and CTRL key to zoom into the calculation window. Jeff Shaffer recently showed me that you can do this in all sorts of windows within Desktop. Unfortunately, you can't yet do it in the main window, but this is a great start.
2. Copy Text from Tooltips in Web Edit Only
I mentioned the 5 things you can do in Web Edit, but not in Desktop blog in the last tip. After I released that blog, I found another one...you can copy information from a tooltip in Web Edit, but not in Desktop. I personally try to do this all the time btw.
3. Fixed Geometry
I recently wrote a blog about how you can solve the filtering issues with a hex map...basically keeping the background from disappearing. Well, before I wrote this, Klaus Schulte was working on a viz and needed to do something similar with a shapefile. He figured out that you can create a Fixed LOD on the Geometry field and then used that as a background map layer that would not be impacted by filters (filters that are not in context). The GIF shows how this was done in Klaus' viz. This is pretty slick! Nice find, Klaus!
4. Change Multiple Measures to Discrete at Single Time.
If you put a bunch of continuous fields onto your view, you can use the SHIFT key to select them all (or CTRL to select some) then change them all to discrete at the same time. I use this all the time!
5. Blurry Images - Fixed!
This one really isn't a tip, but for a long time, the images that I added to my dashboard (images and button images) would come through as blurry. I did learn that you could improve this by making the images the same size as they would be on the dashboard and not check the "Fit Image" checkbox. This helped. But recently, something has been fixed. I don't know what, but I'm not seeing any blurry images at all. I'm not resizing them or anything...just using any size image, set them to "Fit Image" and they all look great!
7. Convert Table to Custom SQL
If you are connected table in Tableau, you can click on the arrow and change it to Custom SQL. This is super helpful if you are in the middle of development and need to add joins, need to see a list of fields, etc. It's also really handy if you do, in fact, want to swap it out for Custom SQL...you won't have to add a new data source and replace the table with that new data source.
8. Drag Fields Into Tooltip from Calcs
One of my favorite little time-saving tricks is to drag fields from a calculated field onto my view. I do this all the time when I am using two fields in a calculation and want to show those two fields on the tooltip (or anywhere else) along with the resulting calculation in the tooltip. An example of this would be Profit Ratio using SUM([Profit])/SUM([Sales]). I just open the calculation then drag the two fields (SUM([Profit]) and SUM([Sales]) onto the tooltip. The GIF shows me dragging these fields onto various locations on the view.
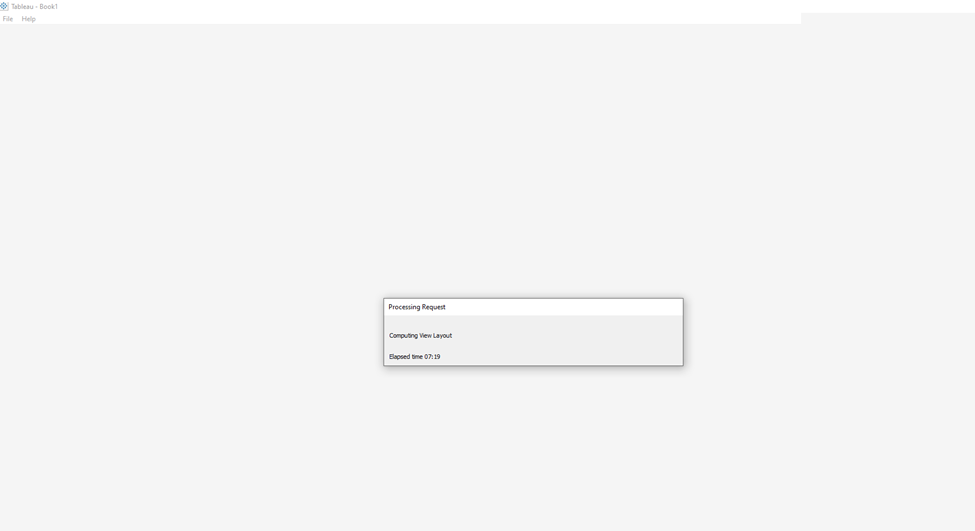
9. Simple Resolution When Tableau Won't Open
Here's another tip from Jeff Shaffer. Sometimes you open Tableau and it won't open. You may get a message that looks like the following. This can often be caused by Tableau getting stuck with license validation (perhaps their server is down). In order to get it to load, try disconnecting your wifi. This has worked for me on numerous occasions.
10. The ONLY Way to Use GIFs
Using GIFs in a dashboard is a fun way to get engagement on a Tableau Public viz, but it also has a number of use cases in business applications...one being that it's a great way to get someone's attention. The problem is that GIFs are a pain. You get a link to one (or you create one and publish it to your website then grab a link), you bring in a web object, add that link, size it up and publish, but then...it looks totally different. It's a pain.
That said, you can now use the new image link option to solve this and it allows you to resize without issue. It works perfectly. Check out the GIF to see the problem and solution.
I've mentioned him several times, but Jeff Shaffer did this long before I discovered it. Man, that guy is good at Tableau!
That's a wrap...10 more tips! Thanks for reading!
Kevin Flerlage, February 13, 2023
Twitter | LinkedIn | Tableau Public


No comments: