
Kirk Munroe: Relationships, Joins, Blends & When to Use Them

Kevin
and I are pleased to welcome back Kirk Munroe for the third blog in his series
about data modeling with Tableau. Kirk lives in Halifax, Nova Scotia, Canada
and is a business analytics and performance management expert. He is currently
one of the owners and principal consultants at Paint
with Data,
a visual analytics consulting firm, along with his business partner and wife,
Candice Munroe, a Tableau User Group Ambassador and former board member for Viz
for Social Good.
Kirk
is also the author of Data Modeling with
Tableau,
an extensive guide, complete with step-by-step explanations of essential
concepts, practical examples, and hands-on exercises. The book details the role
that Tableau Prep Builder and Tableau Desktop each play in data modeling. It
also explores the components of Tableau Server and Cloud that make data
modeling more robust, secure, and performant. This blog will give you a taste
of what’s available in the book, so if you find this useful, go buy the book!
Also be sure to check out Kirks’ previous blogs, 4 Common Tableau Data Model Problems…and How to Fix Them and 14 Scenarios and When
to Use Tableau Prep vs Desktop?
Relationships
The 2020.2
release of Tableau brought the long-awaited feature of relationships.
Relationships allow you to create a relationship
between two or more tables by letting Tableau know which fields are related
between the tables. You then trust Tableau to make the necessary joins (or not)
at run-time to answer the questions you pose as you create sheets (for more
details on this, see Ken’s blog, Tableau's
New Data Model & Relationships). Prior to
2020.2, you had to explicitly create joins between these tables. Relationships
can be almost magical in that you just trust Tableau to do the trick—no
thinking about what the SQL is being creating behind the curtain. On the flip
side, you are putting your trust in the hands of the magician!
Team Relationship vs Team
Join
When questions of
joins vs relationships come up in the #DataFam on social media, it looks like
most people fall hard on either “Team Relationship” or “Team Join”. Let’s explore
these two positions a bit.
Team Relationship - People on Team Relationship are very trusting—they are happy to
let Tableau figure out the necessary joins for them. Why spend time thinking
about all that if you don’t have to? Let Tableau do that—we have vizzing to do
right now! People on this team might also be a little afraid of getting a join
wrong, but we know they are the minority!
Team Join - People on Team Join are not very trusting of Tableau to get things
right. People on this team are experts in SQL so why would they hand that logic
off to someone else? People on this team might also be control freaks, but we
know they are the minority!
So which team
makes the most sense to join (pun intended!)? I like to think the best team is
a third team which seems to have the smallest membership (or at least the
quietest membership)—Team Right Tool for
the Job.
Team Right Tool for the
Job - People on Team Right Tool for the Job understand that vizzing in
Tableau is the quickest, easiest, and most fun when they are working with an
ideal data model. People on this team know that relationships really can be
magic but they can also lead to unnecessary queries and aren’t up to the task
of every job. People on this team also know that joins can lead to
inflexibility, limiting analysis, data explosions, and longer-running queries.
Sure, being on this team means you are likely to spend more time building your
data model, but team members understand that they make that time up many times
over when creating vizzes. No more unexpected answers, difficult calculations,
and going back to the data model when new questions arise!
Oh, wait. What
about Team Blend? Blends were never a favorite feature of mine. They are
inflexible, slow, and tricky to get right. One of the great benefits of
relationships is that, most of the time, they eliminate the need for blends.
There is one exception to that rule and we will talk about it at the end of
this post. Short answer, avoid being on Team Blend except in one (hopefully)
rare case when you might need to be!
What do we need
to know to be on Team Right Tool for the Job? Let’s use a near-real-world
scenario to understand what it takes by understanding the ideal use cases for
relationships and joins. To do this, let’s explore data from Inside
Airbnb for New York City.
Note:
As I write this, the date is April 1, 2023 (although this post is no joke!), so
your results may vary slightly depending on when you download data.
We are going to
use three files from this site:
1)
Summary Listings
- Contains a single row for each listing, along with some summarized metrics
for each.
2)
Detailed Reviews
- Contains a single row for each review of a listing over time. Thus, each
listing will have multiple rows. Note:
This data will download as a compressed “gz” file. You’ll need to extract the
csv file using a tool such as 7-Zip.
3)
Neighbourhood Shape
File - Spatial file (GeoJSON format) of
the neighbourhoods of the city. Contains a single row for each neighbourhood.
When to Use Relationships
Let’s start by
discussing some situations where relationships make the most sense. We’ll start
by detailing the three ideal scenarios for relationships:
1)
The tables are of different lengths.
That is, they don’t have the same number of rows. In tech speak, their
cardinality is “1:Many.” Joining these tables will result in an explosion of
data and will often lead to confusing aggregation calculations in Tableau.
2)
The tables have analytical value on
their own. In other words, you can get answers to important questions by
just querying either table on its own, without any joins at all. Relationships
will will not create a join to answer these questions, resulting in much
simpler and faster SQL queries.
3)
Your questions require multiple join
types. In this scenario, the analysis you’re performing would require at
least two of the different types of joins (right, left, inner). That is when
questions of “only when data exists in the left table”, “only when data exists
in the right table”, and “only when data exists in both tables” are all
relevant questions.
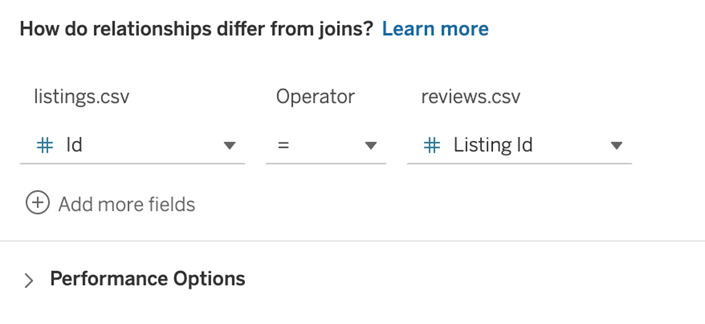
This might still
seem a bit confusing, but looking at the first two files should clear things up
a bit. In Tableau, let’s create a relationship between the summary lists and
detailed reviews files using the Id field from listings and the
Listing Id field from reviews.
With a little
analysis in Tableau, we can quickly see that these tables are much better optimized
as a relationship than they would be through a join for the reasons we shared
earlier.
The Tables are of
Different Lengths
The listings
table has 42,931 records (one for each listing) and the reviews table has
1,110,024 records (one for each review—each listing will have many different
reviews). With a join, this would lead to a pretty big data explosion. The
listings table has 18 fields. If you think about this like a spreadsheet, a
right join would result in 19,207,674 additional cells of data!!
The resulting
data set would also make aggregation quite tricky. For example, with a
relationship, we could do a simple COUNT of Id to get the number of listings.
With the join, we would need to do the more expensive COUNTD (Count Distinct)
or we would get the wrong number.
The Tables Have Analytic Value on Their Own
There are a lot
of questions that could be asked of either table on its own. How many listings
are there by neighborhood? How many reviews have there been over time? To
answer these, we do not need to join to the other table, so why force that to
happen every time?
Your Questions
Require Multiple Join Types
There are many
questions we could ask of this data set and, depending on the question, we
could use a variety of join types. Let’s look at some examples. For all of
these, please envision the listings table on the left and the reviews table on
the right.
What if we wanted
to know how many reviews there are for all the current listings over time, including
listings which have declining reviews? For this, we need a left join because
we need to make sure we get all of the listings, not just those with at least
one review.
What if we wanted
to analyze reviews over time, regardless of whether the listings are all still
available? For this, we need a right join because we need to make sure we’re
getting everything from the reviews table.
What if we wanted
to know about reviews for only listings that are still available today and we
don’t care about listings with no reviews? Here’s where we’d use an inner join.
Let’s take a
closer look at the first question—listings that have any number of reviews
(including none). We might start by building a physical left join. We’d then
build a dashboard to answer this question, but our audience might come back to
us and want to know about reviews related to listings that are no longer active
(our second question). We would have to go back and either change our join or,
more likely, create another data source using the same tables but a different
join type. However, with a relationship, we could answer all these questions
with the same data model. This is because Tableau will automatically choose the
correct join type at runtime on a question-by-question basis (i.e. a
sheet-by-sheet basis).
What about a full
outer join? Full outer joins are messy. They result in an even bigger data
explosion and a lot of null values which need to be dealt with in calculations.
With the introduction of relationships, I can’t think of a single case for
these with the possible exception of the specialized “intersects” spatial join
which we will address shortly.
All of this to
say, bringing the listings and reviews tables together is a perfect case for
relationships over joins.
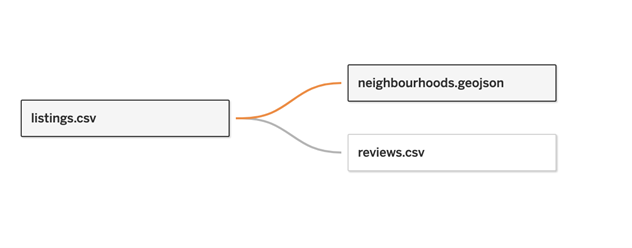
Now let’s add the
neighbourhoods spatial file to our model.
The first
question is whether to create the relationship/join with the listings or
reviews table. Notionally, a listing exists in a neighbourhood and a review
exists on a listing. For this reason, I would recommend creating the
relationship/join against the listings table like this:
The next question
would be whether to use a relationship or a physical join. Let’s explore…
The Tables are of
Different Lengths
The listings
table has 42,931 records and the neighbourhoods file has 233 rows. This is a
vote for a relationship.
The Tables Have Analytic Value on Their Own
In this case, the
neighbourhood spatial file doesn’t have much analytical value on its own so
this is neither a vote for a relationship nor a join.
Your Questions
Require Multiple Join Types
The neighbourhood
file really only has value when it is joined to listings as a left join so it
is neither a vote for a relationship nor a join.
All of this to
say, the case for a relationship over a join is not nearly as strong as it was
for listing and reviews. However, the difference in the number of rows alone
would make me go the relationship route.
You “Team
Relationship” people are out there saying “exactly!” aren’t you? ;) Now is time
to burst that bubble…
When to Use Joins
Continuing with
our Airbnb data, let’s say that we want to enhance our analysis with data
from Redfin's Walkscore, which contains walk scores for each
neighbourhood in New York City (I’ve put the data into csv and made it
available here: NYC
Walk Scores). Let’s look at why joining this
data to the spatial neighbourhood file makes more sense than adding it as a
relationship.
Note:
The neighbourhoods in the spatial file do not quite line up with those in the
walk score data, so if you try this yourself, you’ll run into some issues. In a
real-world scenario, we’d perform some additional data cleaning to make sure
everything tied together, but for the purposes of this exercise, let’s pretend
the neighbourhoods match up exactly.
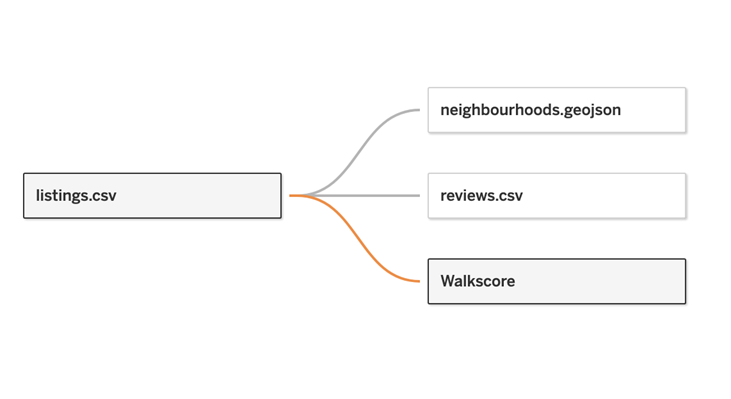
We could
certainly add our Walkscore data via a relationship like this:
But there are a
couple of challenges with this approach. First, we are asking Tableau to make
queries it doesn’t need to make. Second, it can cause confusion. For example,
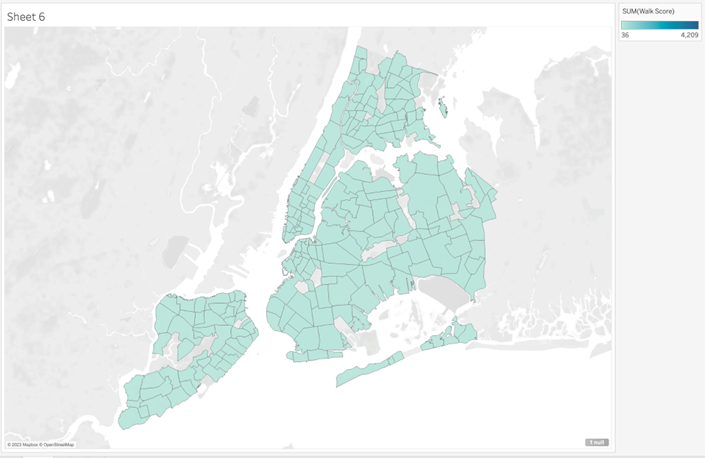
if we pull the Geometry field onto the viz and then Walkscore on color, we get:
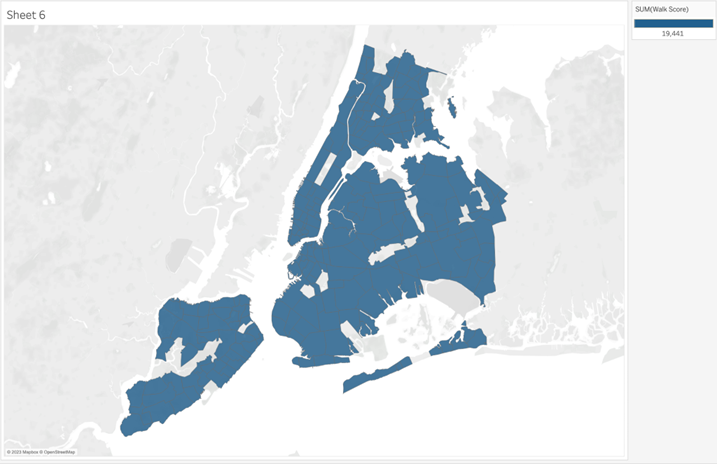
This is
confusing. Walkscore can’t be more than 100, right. To address this issue we
might think that we could bring the Neighbourhood field (from the Neighbourhood
data source) onto detail but that is also confusing…
To get the result
we want me need to pull the Name field on from the Walkscore data source…
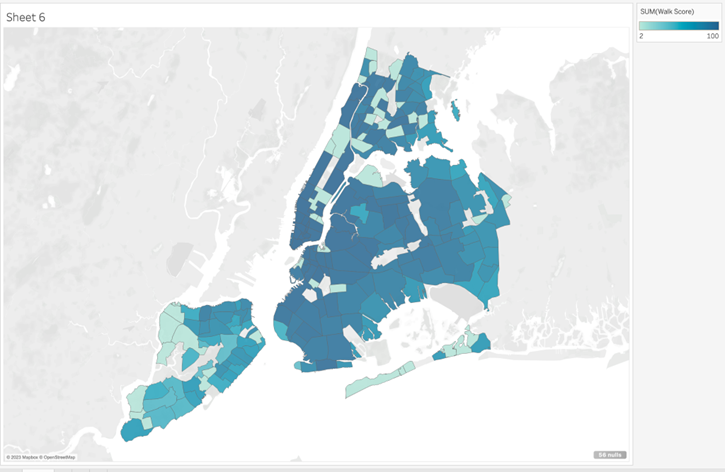
The reason for
this behavior is that we need a field from the Walkscore table to force Tableau to make the join we need.
If we go back to
our three conditions for a relationship, we can see that this table doesn’t
meet any of them:
The Tables are of Different Lengths
Each of the
tables has one row per neighbourhood, so they are the same length.
Note:
In reality, they are slightly different lengths because of the mismatch issue
noted earlier and the fact that the spatial file has two neighbourhoods that
have two rows because their shapefiles have a break in them.
The Tables Have
Analytic Value on Their Own
The Walk Score
table doesn’t have much value on its own for this use case. It needs to be
combined with the listings and/or geojson file for value—at least in the
context of the Airbnb analysis we’re performing.
Your Questions
Require Multiple Join Types
It makes a lot of
sense to join the neighbours and Walk Score data as they provide value as a
single table. Assuming they were properly cleaned and each had one row per
neighbourhood, a right, left, or inner join would all yield the same results.
So, we can just perform a physical inner join. The final optimized model would
look like this:
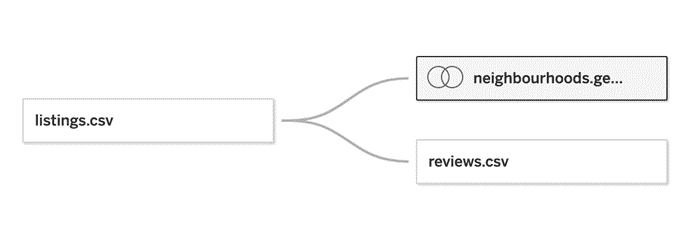
With the joined
table looking like this:

This model
effectively is treated as three tables (in Tableau terms, three “logical”
tables). Listings has a row for each of the ~43k listings; Reviews has ~1.1
million rows, one for each review; The physically joined tables have ~240 rows,
one for each neighbourhood.
Team
Right Tool for the Job for the win!
Additional Join Use Cases
Before we close
this discussion, I’d like to briefly mention two other cases where joins are
preferable:
1) Geospatial joins where the INSTERSECTS
operator will be used. Although we used a geospatial file in our example,
we did not need a geospatial join. We created both our relationship and join to
the table with a string field. When using INTERSECTS, we must use a physical
join since it is not supported by Relationships.
2) When there is a need for row-level security,
an entitlements table is used, and the data source will be published for others
to use to create their own workbooks. In this case, a query that would only
requires a single table without needing the join to the entitlements table
might expose data it shouldn’t. If you are embedding your data source in the
workbook and ensuring people cannot download or edit your workbook,
relationships with row-level security and an entitlements table works well.
But, admittedly, it still makes me nervous and this is one of those scenarios
where I prefer to force Tableau to always join the tables together, just in
case.
What About Blends?
Okay, so we’ve
gotten all the way through this and haven’t discussed blends, so let’s address
them quickly. Now that we have relationships, I can only think of a single use
case for blends—when you need to combine a published data source with other
data in a workbook. At the time of writing, when you connect to a published
data source from Tableau Desktop (or web authoring), you cannot connect to
additional tables from the data source page. You can, however, connect it to another data source using a blend.
Imagine in our
scenario that the model with listings, reviews, and neighbourhoods has been
published as a published data source.
We connect to that data source on Server/Cloud and want to add Walk Score data
for context. Our only option, unless we go back to the data source owner, is to
blend that Walk Score data.
Blending has many
challenges. Mostly, they perform slowly, and they are difficult to set up,
especially when the blend depends on dates. More importantly, they only allow
for analysis at the level of aggregation of the secondary data source. What
would this mean in our case? We could explore neighbourhoods by Walk Score but
if we wanted to see the walk score of an individual listing, we would not be
able to get it because it is “below” the level of neighbourhood. For all of
these reasons, my suggestion is to avoid blends whenever possible, only using
them when you have no other options available.
Wrap-Up
Well, there you
have it. I hope that, if you are on Team Relationship or Team Join that you now
see the value of coming to Team Right Tool for the Job. And maybe you can bring
some friends with you!
I hope you’ve
enjoyed my series of blogs on data modeling with Tableau. If you haven’t read
the previous blogs, you can find them here:
4 Common Tableau Data
Model Problems…and How to Fix Them
14
Scenarios and When to Use Tableau Prep vs Desktop?
My book, Data
Modeling with Tableau, covers these and many other topics
that I’ve not addressed in the series, including virtual connections, securing
and sharing data models, creating models in the Tableau web interfaces, data
model considerations for Ask and Explain Data, and data catalog and lineage. It
is now available on Amazon in e-book and print formats.
Thanks for
reading. If you have any questions or thoughts, feel free to drop a comment
below and we will be glad to address them.
Kirk Munroe
April 17, 2023


Great post! One issue with relationships is that you can't use a data source that has a relationship to filter across another data source. For example, if data source A and B both have a relationship and a date field and I want the user to be able to filter by date across both sources at once, I can't simply apply the date filter from one source to the other. The filter pill turns red and the error message says: "Data sources that contain logical tables cannot be used as secondary data sources for data blending." In contrast, joined data doesn't have that limitation. I'd prefer to use a relationship for all the reasons you outlined above, but I also need to do cross data source filtering, so that the issue I'm battling right now.
ReplyDeleteHi Jen. First, thank you! As for your use case, do you mean you want to apply a filter with "All Using Related Datasources"? I've been able to make this work. If I'm misunderstanding, please let me know!
DeleteThis was a fantastic article, Kirk. Definitely something I've struggled with understanding for some time now and this did wonders in helping clear the mud!
ReplyDeleteOne thing that we discovered recently is that if a Tableau data source is created with relationships (or presumably with "Team Right Tool For the Job"), the data source can't be utilized in a Tableau Prep Flow.
Hi Brain. Thank you!
DeleteGood catch. I have never run into that situation before but it makes sense. Since the relationship would need to use the "engine" from Tableau Desktop/Server/Cloud to know how to create the join (and presumably that code isn't in Prep), it wouldn't know how to bring it into a flow.
I think this makes sense as data modeling in Prep is a very directive/explicit set of tasks because your output is always going to be a single table.