
Customize Your Tableau Filters

I’ve always wanted the ability to customize Tableau filters a little more than what’s possible out of the box. For example, it would be nice to be able to change the style of the checkboxes or add some additional text or use a completely different UI. Aside from UI, I’d like to be able to enable additional functionality such as the ability to define which items are selected by default or trigger an action based on a selection. I’ve been faced with these challenges several times in the past and have struggled to find an out-of-the-box solution. So, today I’m going to share a method for creating your own 100% customizable filters in Tableau. I’ll warn you ahead of time that this will be an advanced technique, so I would only use it when standard filters won’t work.
UI Examples
Before we jump into the tutorial, let
me first share some examples of what we might want to do. Let’s start with UI.
Note: Our focus throughout this blog will be on multi-select filters, but we
could apply these same techniques to other types of filters as well.
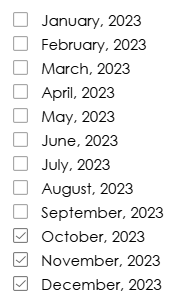
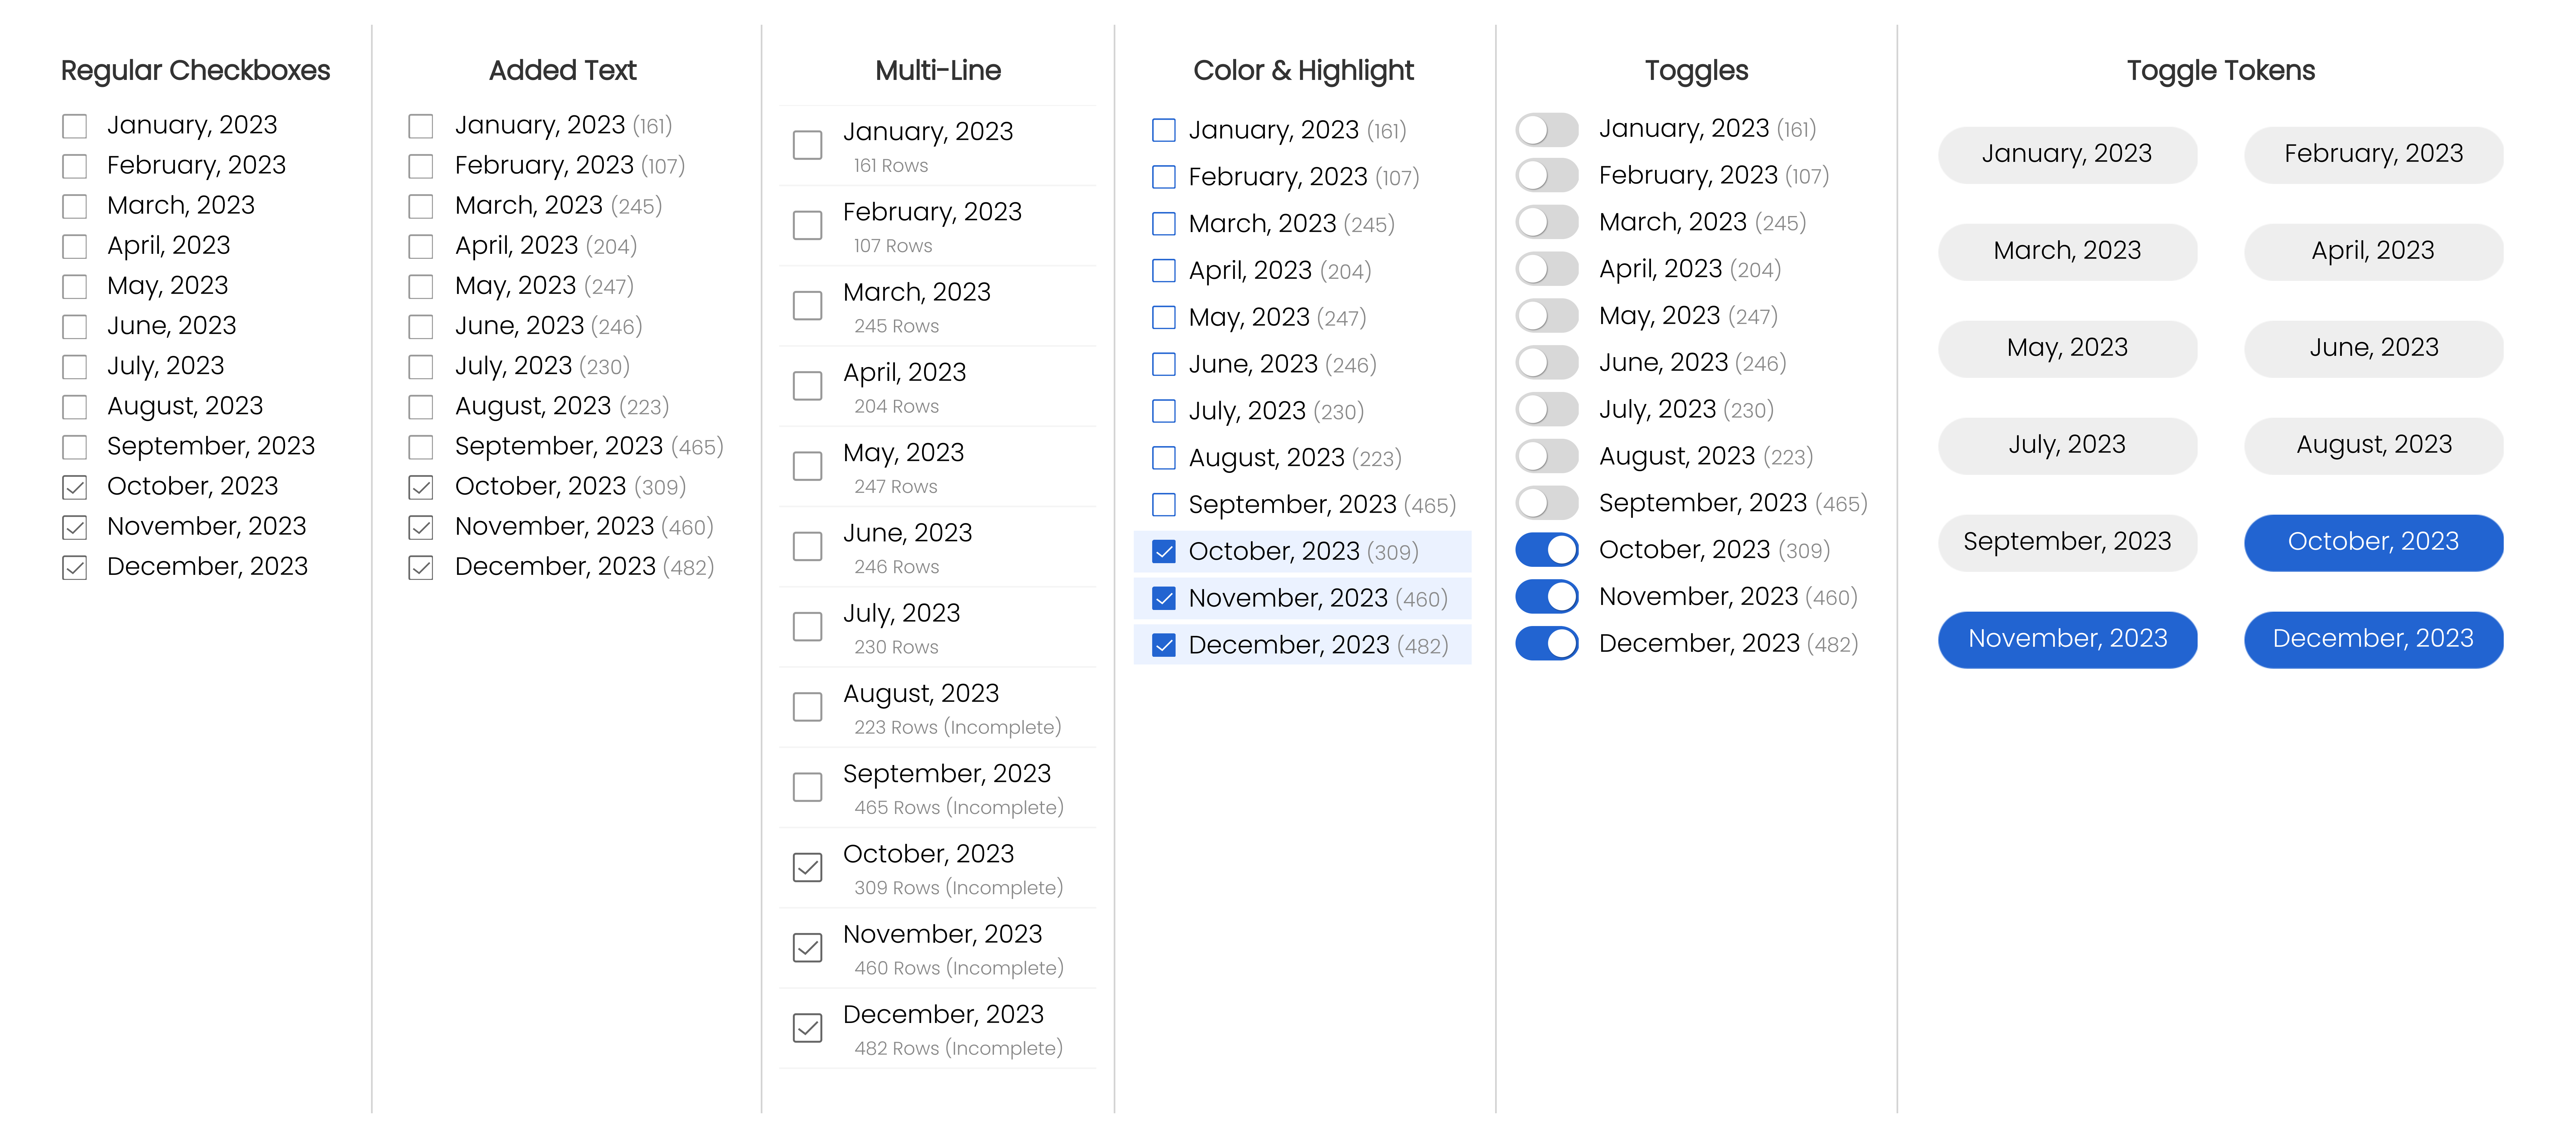
A standard multi-select filter looks
something like this:
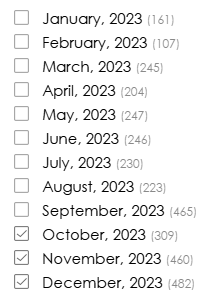
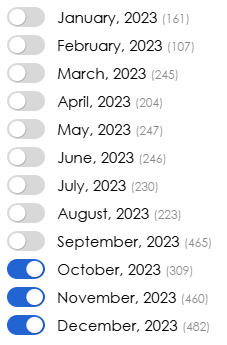
We could start by adding some
additional information to the text. For example, perhaps we just want to show
the number of rows for each month. Here we’ve added the row count in a smaller
and lighter font:
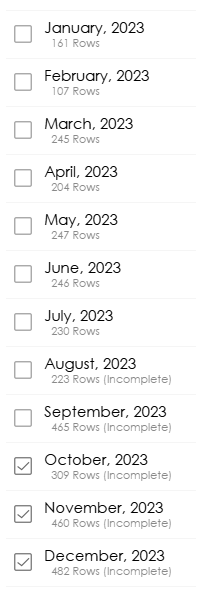
Perhaps you want to have multiple
lines of text?
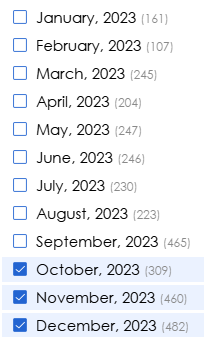
I’ve always wanted to style filters a
bit differently. This could be particularly valuable in embedded analytics when
you want the style of the Tableau content to match the overall website or app.
For example, in the following, I’ve used blue checkboxes and a light blue
highlight.
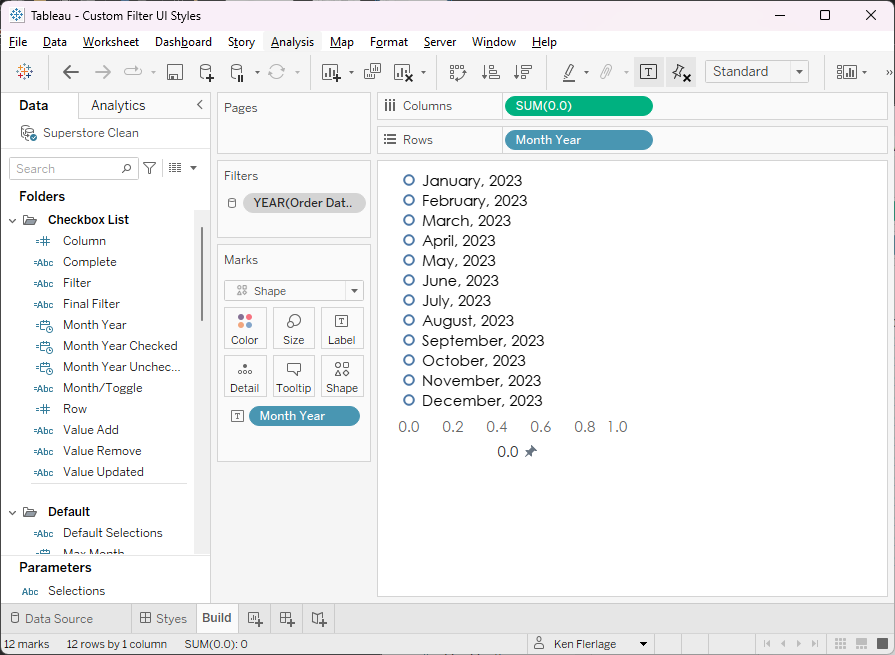
Or maybe you don’t want checkboxes at
all. Perhaps you’d like to use toggles instead?
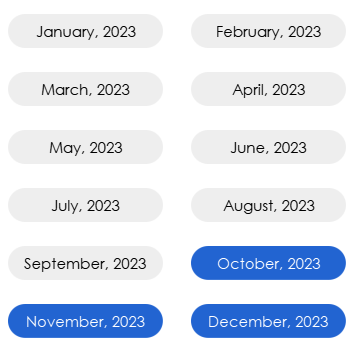
Or maybe you want a completely
different UI altogether. In the following, I’m using a concept called “Toggle
Tokens”:
Those are just a few examples, but
the sky is the limit. With the technique I’ll be sharing, we can customize
filters however we want—we can change text colors, checkbox colors, background
colors, checkbox styles, use completely different UI layouts, put filters in
columns and rows (or even a single row), add dividing lines, etc. Pretty much
anything we want!!
Note: If you’d like to interact with these
examples, you can access them on Tableau Public: Custom Filter UI Styles
Functional Examples
But UI is just the start. With this
technique, we can implement several pieces of functionality not available in
normal filters. For example, what if you want a filter to automatically select
the last 3 months? Or, perhaps, you want it to automatically select any month
that is complete (i.e. not the current or future months)? The examples I’ve
shown earlier are automatically set up to select the last three months. And you
can see in the multiline example that I’ve shown which months are “complete”
and which are not. With a few tweaks, we could easily set up the filter to automatically
select only the complete ones.
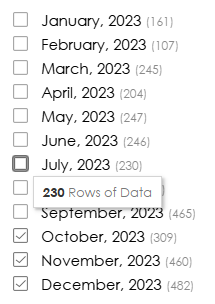
Perhaps you want to give your user
some additional information about the filter option but don’t want to display
it right on screen. Wouldn’t it be nice if you could use tooltips to provide
that additional info?
You could even implement viz-in-tooltip
to show quick charts or provide some basic data profiling.
A problem I’ve run into several times
in the past is the need to trigger some sort of action based on the selection
of a filter. For example, perhaps you want to prevent your user from
deselecting all options, so when they deselect everything, you want to
automatically select the last month. You can’t do that with filters, but you
can with this technique.
We’ll get into this in the tutorial,
but this technique leverages a parameter to store information about which
options are selected and deselected. Because this information is stored in a
parameter, it means that the filter can be used across multiple, unrelated data
sources. For example, perhaps you have one data source with an Order Date and
another with a Ship Date and you wish to use the same filter for both. With
this technique, you can easily do that. In some ways, this technique is
essentially like being able to create multi-select parameters.
How-To
Now that you understand the use
cases, let’s talk about how to create these custom filters. Here is the basic
concept:
▪ Each filter is a sheet.
▪ A parameter stores the states of
each item in the filter.
▪ Parameter actions are used to add
and update the state of items as they are clicked.
▪ Custom shapes are used to visually show
each item’s “state” (whether an object is selected or deselected).
▪ As items are clicked, the sheet is filtered to show the correct custom shapes.
Let’s start with the last item first
since it will require us to do some data modeling. We’ll get into this more
later, but the goal is that users can click an item and the box will toggle between
selected and deselected. The problem with this is that, when you click a mark
in Tableau, it generally remains selected until you click it again to deselect
it. Because of that, you’d have to click each item twice to toggle it. There have
been several documented hacks for correcting this problem, but I’ve personally had
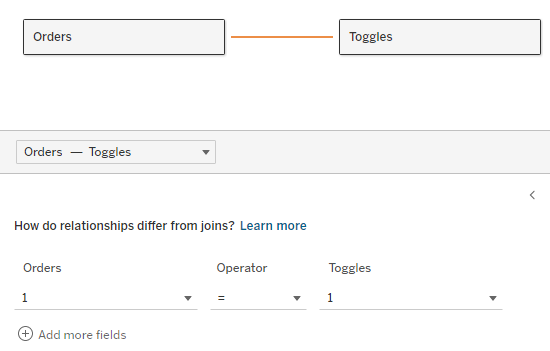
issues with them in certain situations. So, to avoid that, I bring in an Excel
or text file with a single column, Toggle, and two rows, “Checked” and “Unchecked”.
I then relate this to my data in the Tableau data source using a 1 = 1
relationship.
Theoretically, this will duplicate my
data, but that’s not entirely true. When the toggle data source is not used on
a sheet, Tableau will never include it in its query so the data will not be
duplicated. When the toggle is in use, then it will be duplicated, but we’ll
deal with this by filtering out the extra data.
Now here’s the trick…We’ll use this
toggle field to filter the data every time an option is clicked. When data is
filtered, any existing selections are cleared. So, by filtering the data on
each click, we’ll never have any selected marks. Thus, we’ll only need to click
once to toggle the value.
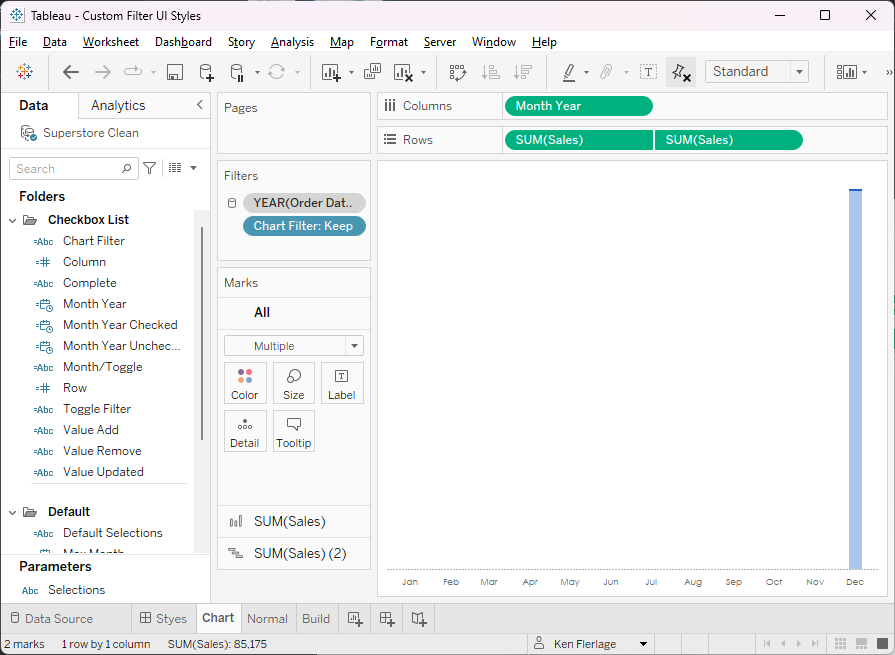
With our data modeled, we’ll create a
new sheet. We’ll create an inline calculation on Columns with value, 0.0, we’ll
drag our dimension to rows, and we’ll choose the Shape mark type.
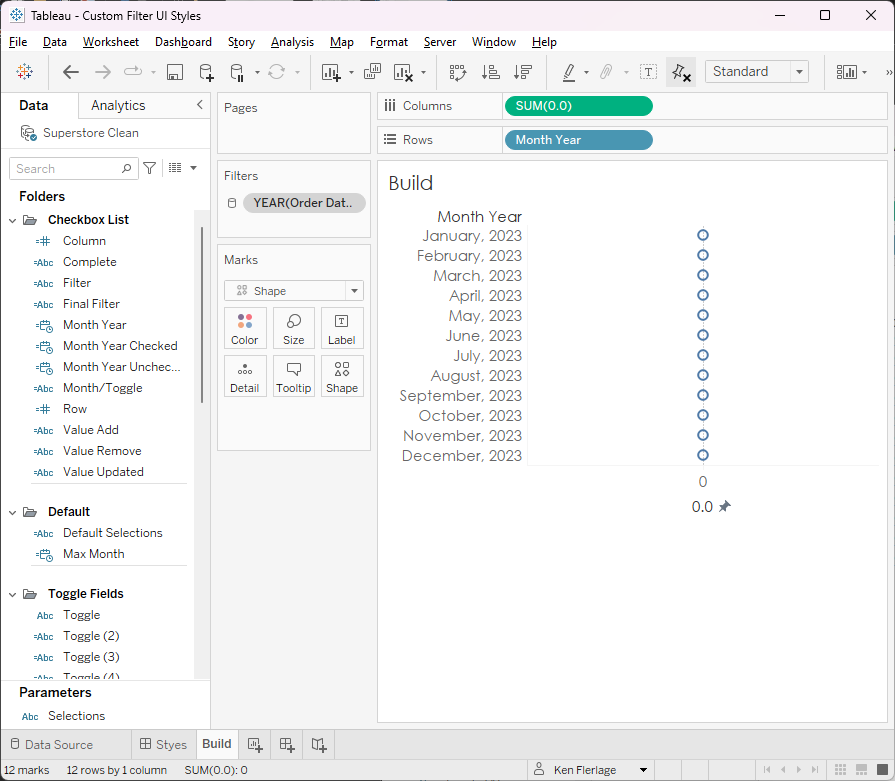
Next, we’ll edit the axis so that it
runs from -0.1 to 1, we’ll drag our dimension to the label card, then we’ll hide
the header for the dimension on the rows shelf.
Now we’ll drag Toggle to the
shape card and assign custom shapes to the Checked and Unchecked options (Note:
I created all of mine in PowerPoint and
have uploaded them here: Check Shapes).
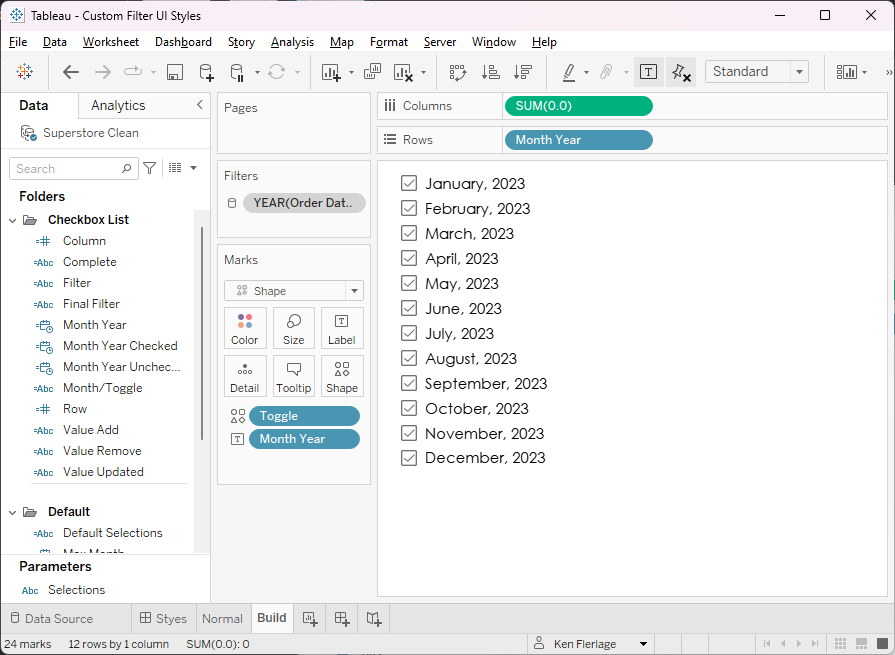
While it appears that we’re only
showing checked shapes, both shapes are shown. They are on top of each other,
making it look as though only the checked ones are visible. We now need to make
it so that, when an item is clicked, it toggles between being checked and
unchecked. But, before we can do that, we need some place to store the current “state”
of each item. For that, we’re going to use a parameter. We’re essentially going
to build a long string of values with the state of each item and store them in
the parameter. For example, if the parameter reads ;2023-11-01
00:00:00|Unchecked;2023-12-01 00:00:00|Checked, this means that
November 2023 is unchecked and December 2023 is checked. By default, we’ll treat
a value as unchecked if it is not in the list. Thus, January through October
are unchecked in this example.
Let’s start by creating the parameter—I’ve
called mine Selections. We’ll leave it empty for now, indicating that all
items are unchecked. Then we’ll create a calculated field to act as a filter on
our sheet.
Toggle Filter
// Keep only the
month and toggle values that are in the parameter.
IF
CONTAINS([Selections],
STR([Month Year])) = FALSE THEN
// Value has never been initialized, so
it's unchecked.
IF [Toggle]="Unchecked"
THEN
"Keep"
ELSE
"Hide"
END
ELSEIF
CONTAINS([Selections],
[Month/Toggle]) THEN
"Keep"
ELSE
"Hide"
END
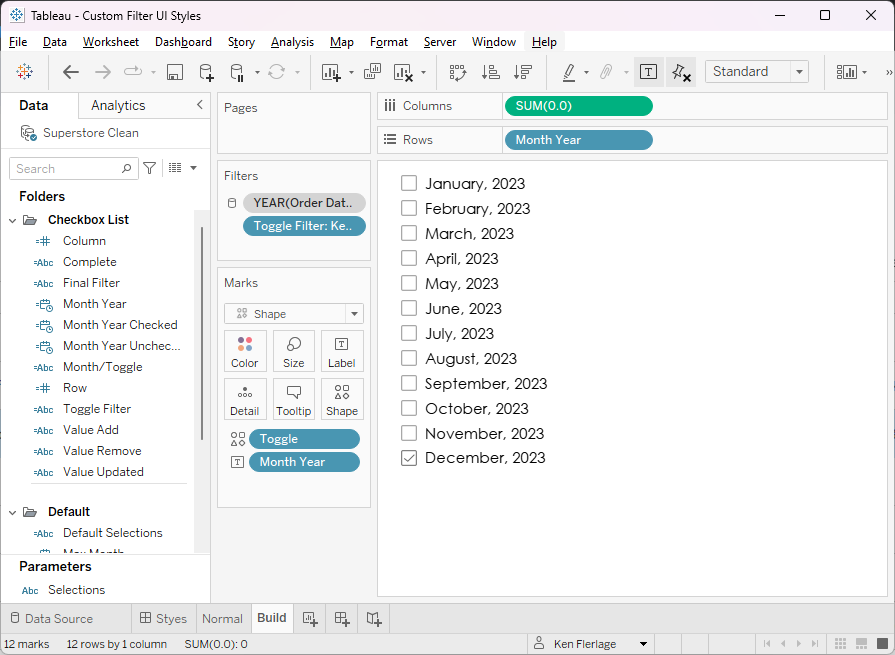
This will check the values in the
parameter and determine which are checked and which are not. We’ll use this as
a filter on our sheet, keeping only “Keep” values, which will ensure that we
only have one mark for each item—either checked or unchecked, but not both.
With the parameter example shown earlier, we should see this:
We’re going to build the
functionality for maintaining the parameter momentarily, but let’s first create
a filter capable of filtering actual charts. We’ll create the following
calculated field:
Chart Filter
// Filter any month
that has Unchecked in the parameter.
IF
CONTAINS([Selections],
STR([Month Year]))
= FALSE THEN
// Value has never been initialized, so
it's unchecked.
"Hide"
ELSEIF
CONTAINS([Selections],
STR([Month Year])
+ "|Checked") THEN
"Keep"
ELSE
"Hide"
END
This calculation checks our field, Month
Year against the values in the parameter to determine if they are checked
or unchecked. We’ll then filter our view keeping only “Keep” values. Here’s a
sample chart using this filter and the parameter example shared previously. As
you can see, only December is shown.
Creating the Interactivity
Yay! We now have a partially
functional filter! The last piece is to create the functionality allowing users
to interactively check or uncheck each box and load that information into the parameter.
The technique we’re using for this is very similar to one innovated by Jonathan
Drummey and documented in his blog, Parameter Actions: Using a Parameter as a Data Source. In the blog, Jonathan details
how we can use parameters to store data and parameter actions to essentially
add, remove, and update the data in that data source. It’s a brilliant
technique so be sure to read his blog!
Here’s essentially what we need to do
when a user clicks on an item in the filter.
▪ When an item is currently checked, update
the parameter setting it to unchecked. The value will be ;<Item>|Unchecked
▪ When an item is currently unchecked,
update the parameter setting it to checked. The value will be ;<Item>|Checked
▪ If the item already exists in the
parameter, we’ll remove the existing item and add the new one. If it does not
exist, we’ll simply add the new one.
To do this, we’ll need a series of calculated
fields:
Value Add
// What is the value
that will be added to the parameter?
IF
[Toggle]="Checked" THEN
STR([Month Year]) + "|" +
"Unchecked"
ELSE
STR([Month Year]) + "|" +
"Checked"
END
Value Remove
// What is the value
that will be removed from the parameter?
IF
[Toggle]="Checked" THEN
STR([Month Year]) + "|" +
"Checked"
ELSE
STR([Month Year]) + "|" +
"Unchecked"
END
Value Updated
// New value for the
parameter after removing and adding.
REPLACE([Selections],
";"+[Value Remove], "")
+ ";" + [Value Add]
Drag Value Updated to the
detail card on your sheet (in some cases, you may need it to be an attribute). Now
add the sheet to a dashboard and create the following parameter action:
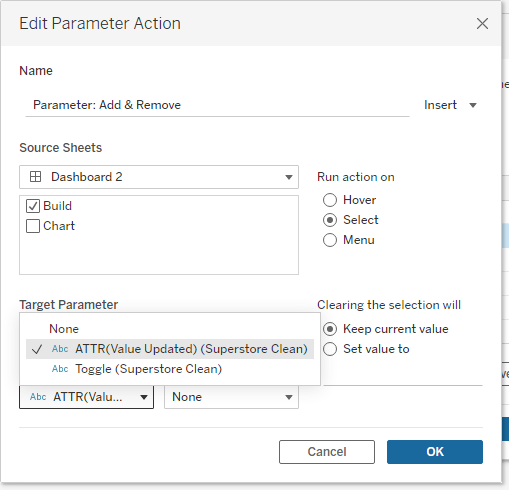
And with that, we’re done! We now
have a completely functional filter.
Customizing It
The beauty of this filter technique is
twofold. First, it’s a sheet using custom shapes so you can customize it
however you want. The UI examples I shared earlier were all created by simply
customizing the shapes, layout, etc. of the filter sheet. The options are limitless.
But, because
this is a normal sheet, you can do all the other things I mentioned earlier—edit
the text, add tooltips, trigger an action, etc.
Second, since everything
is ultimately driven by a parameter, we can take advantage of the extra functionality
of parameters. For example, parameters are data source independent, which means
they can be used across multiple data sources—something you can’t do with
filters without a blending relationship. In many ways, this technique essentially
allows you to create custom multi-select parameters.
We can also
leverage dynamic parameters to specify which items should be selected by
default. For example, let’s say you wanted to always select the last three
months. We’ll start with two calculated fields:
Max
Month
// Last month in the
data.
{FIXED : MAX([Month Year])}
Default
Selections
// Default selection
to show the last 3 months
// Need LOD to make
it "viz-independent" for use as default value in the parameter.
// Be sure to add
";" at the beginning.
{FIXED : MAX(
";" + STR([Max Month]) + "|Checked;"
+ STR(DATEADD('month', -1, [Max
Month])) + "|Checked;"
+ STR(DATEADD('month', -2, [Max
Month])) + "|Checked"
)}
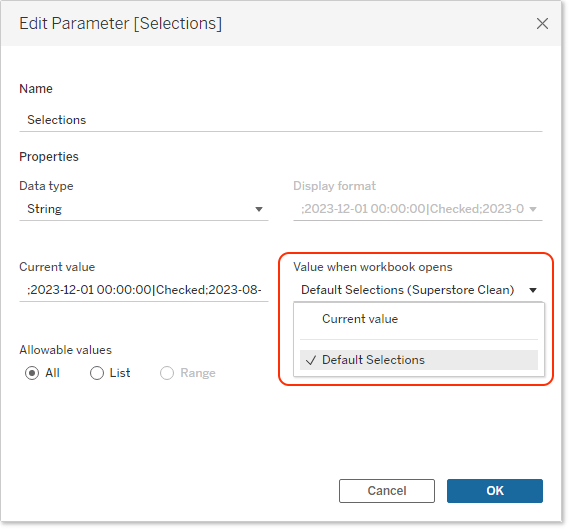
We’ll then
edit our parameter to use Default Selections when then workbook opens.
Or, as I noted
earlier, you could set it up to only show complete months. As long as you have
the data and logic, you can make the default selection pretty much anything you
like.
A Few Additional Thoughts
Before I wrap this up, I want to
share a few additional thoughts on things that you can do with these filters.
Dropdowns
The examples I’ve shared display the
filters in a list format (i.e. all items are shown at once). I generally prefer
dropdowns because they save space. You can implement that here by using a
collapsible container or using dynamic zones.
Apply Button
I love Apply buttons for multi-select
filters because they prevent the view from being updated in the background each
time you select an item. We could use apply buttons here by creating a staging parameter.
As you select options, it will update this parameter. But, when you click the Apply
button, it copies the value from the staging parameter to the parameter used
for the filters.
Overall Apply Button
In 2020, I wrote a blog called An Apply Button for Your Parameters that shared a technique for creating a global Apply button for your parameters. The technique shared is essentially what I shared in the Apply Button section above. Since then, I’ve been asked several times whether this was possible with filters. With normal filters, it’s not possible, but since this custom filter technique leverages parameters, we could theoretically create a global Apply button that applies all of the custom filters at once.
Clear All Filters
I'm regularly asked if it's possible to create a "Clear All Filters" option. While there have been many hacks and solutions developed, I've personally always had problems with these solutions. But, since this is all parameter-driven, we could theoretically create a button that clears the filters, setting them back to their default states.
Wrap-Up
I’ll acknowledge that this technique
takes quite a bit of time and effort. And I’d guess that 99% of the time, it’s
better to just use a basic Tableau filter (or set control or parameter). But when
you need just a little more flexibility—either with the UI or with the functionality—I
think this is a super cool technique. And I suspect that I’ve only scratched
the surface of all the cool functionality you can add using it.
Thanks for reading. I hope you enjoy going
on this journey with me! If you have any thoughts, please leave them in the
comments section below. If you’d like to interact with or download the workbook,
you can access it on Tableau Public: Custom Filter UI Styles
Ken Flerlage, October
9, 2023
Hire Us! | Twitter | LinkedIn | GitHub | Tableau Public


I wanted to do this for the map layers on my 2024 Iron Viz, but I struggled with the impediment of having to double-click to a more primitive toggle as you mention. I wasn't aware of the technique of using a parameter as a data source - that opens up tons of possibilities! This will be my first entry in the list of "things I would do differently if I did this viz again." 👍
ReplyDeleteLet us know how it goes when you eventually try it!
DeleteHi thank you for sharing this! I noticed you did not tell us how to construct the string for the date - a calculated field in your workbook [Month / Toggle]. Could you share?
ReplyDeleteYou can download the workbook here to see how that is formulated: https://public.tableau.com/app/profile/ken.flerlage/viz/CustomFilterUIStyles/Styes. Let me know if you have any further questions after reviewing it.
DeleteGreat work! I have used this to combine color legend with a filter to save some space on a dashboard. I do however have a question: is it possible to add (All) button which selects/deselects all marks similar to a regular filter? Thanks in advance :)
ReplyDeleteCan you email me? flerlagekr@gmail.com
Delete