
Creating Custom Animations for Use in Tableau (Guest Post from Kasia Gąsiewska-Holc)

Today I'm honored to be hosting a guest post by the brilliant Kasia Gąsiewska-Holc. Please be sure to follow her on Tableau Public and Twitter.
Christmas Eve 2018. When everyone was busy preparing their Pierogi (well, at least everyone in Poland as this is a traditional Polish Christmas meal), I was building a Christmas-themed viz for my Tableau Public portfolio and experimenting with some GIF files (that I found online) within it. Took a bit of trial and error but I got there eventually. The viz was finished, Christmas was saved!
However, as much as I liked the idea of having animated images in a Tableau viz, I felt that ready-made GIFs were just not doing it for me. So the idea came up in my mind: how great would it be if I could convert vector graphics that I normally create in Adobe Illustrator, into my own animated images and use them in a Tableau viz?
Fast-forward to February and I published my Garbage in the Ocean viz, shown below, which caught an eye of several people in the Tableau community, largely thanks to my own animated graphics that I was eventually able to create! (Click on the image the view the visualization).

Since many people asked how this could be achieved, I decided to write down a quick step-by-step guide to help you create your own animations. Without further ado, let’s jump right into it!
Note! Before you begin make sure you have access to any vector graphic design software (such as Adobe Illustrator, Krita, Sketch, Corel Draw or similar) and access to a server where you can upload your files and make them available publicly.
Step 1: Create a Vector Graphic
Start with creating a vector graphic. Vector format is crucial here if we want to be able to create an animation. Here you have two options. You can either download a ready-made vector graphic or create your own using a vector graphic design software such as Adobe Illustrator, Corel Draw or similar (if you’re unfamiliar with any of these tools, some basic training—such as this one—will most likely be required). Personally, I work primarily with Adobe Illustrator so that’s what I’ll be referring to in this article.
For beginners in vector graphic design, I would recommend using ready-made elements. There are various online services offering these free of charge. Below are few examples:
In this tutorial, I will animate a simplified version of the wave graphic that I have used in my “Garbage in the Ocean” Tableau viz. You can download this graphic from here. Please bear in mind that the following steps might vary depending on the graphic you’ll be working with but this guide should give you a general idea of how to correctly prepare SVG files that are intended for transformations/animations.
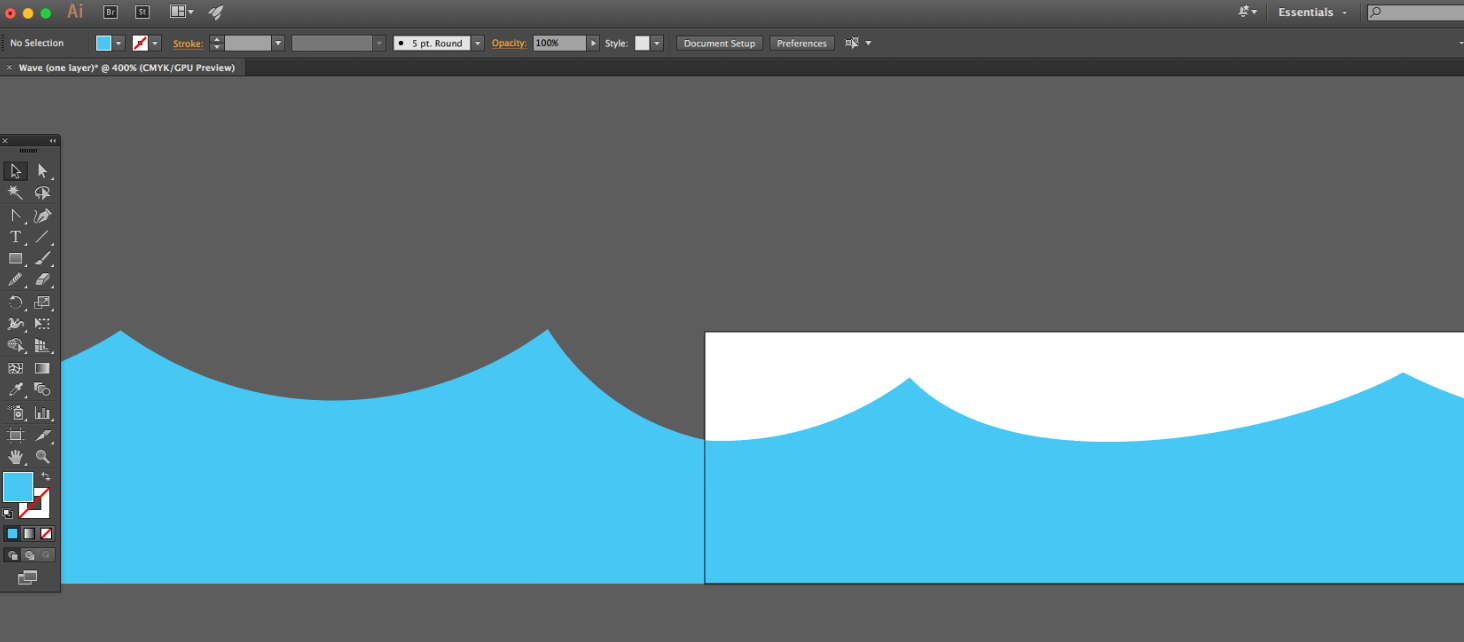
Once the graphic is downloaded, open it in Adobe Illustrator (AI or EPS file in the zip folder) and copy the bottom layer of the third graphic in the set. Now, open a new document in Adobe Illustrator and set the artboard to the size that corresponds to the size of our graphic (659x71 px).
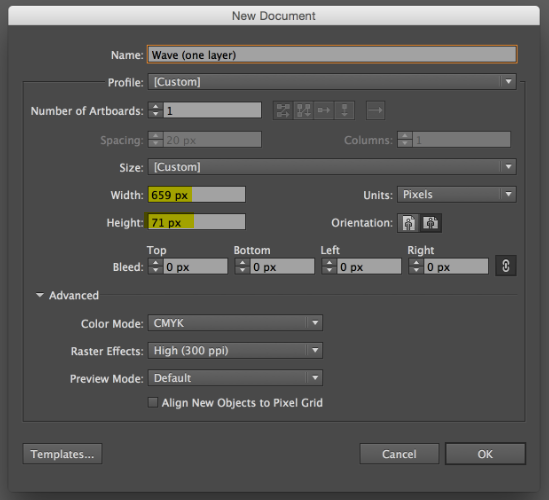
The artboard (white space) is a view box—anything that you put on it will also be visible in the final SVG graphic. Whatever falls outside of it will not be visible. However, since we want the wave to move (in this case from left to right), we’ll need an additional (duplicate) graphic to be placed at the left-hand side of the grey area around the artboard. This will ensure continuity in the wave animation. To demonstrate this, I have created two versions of the animated graphic, using two different settings in Adobe Illustrator.
Version 1: The graphic is constrained to the artboard/view box
Adobe Illustrator Setup
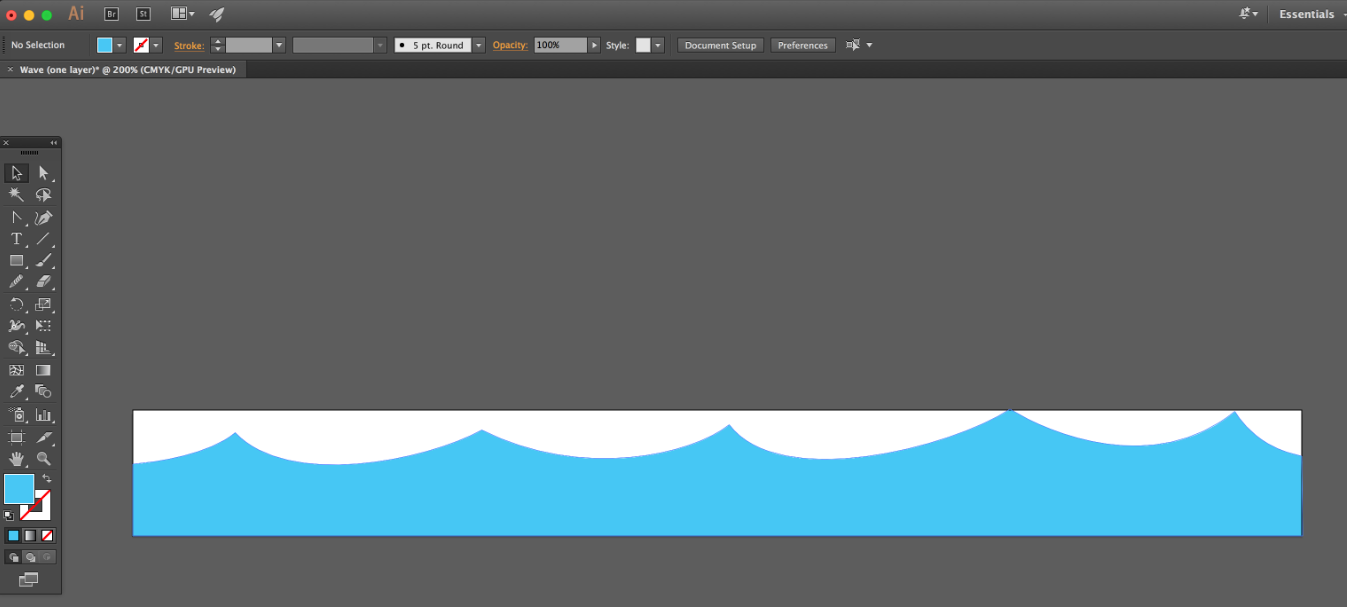
The Result

Note: The actual animation is much smoother. This GIF is for demo purposes only.
What happens here? The wave is set to move 659px to the right. When moving, our graphic falls outside of the view box area and there’s nothing to replace it. Hence, we see the white space instead.
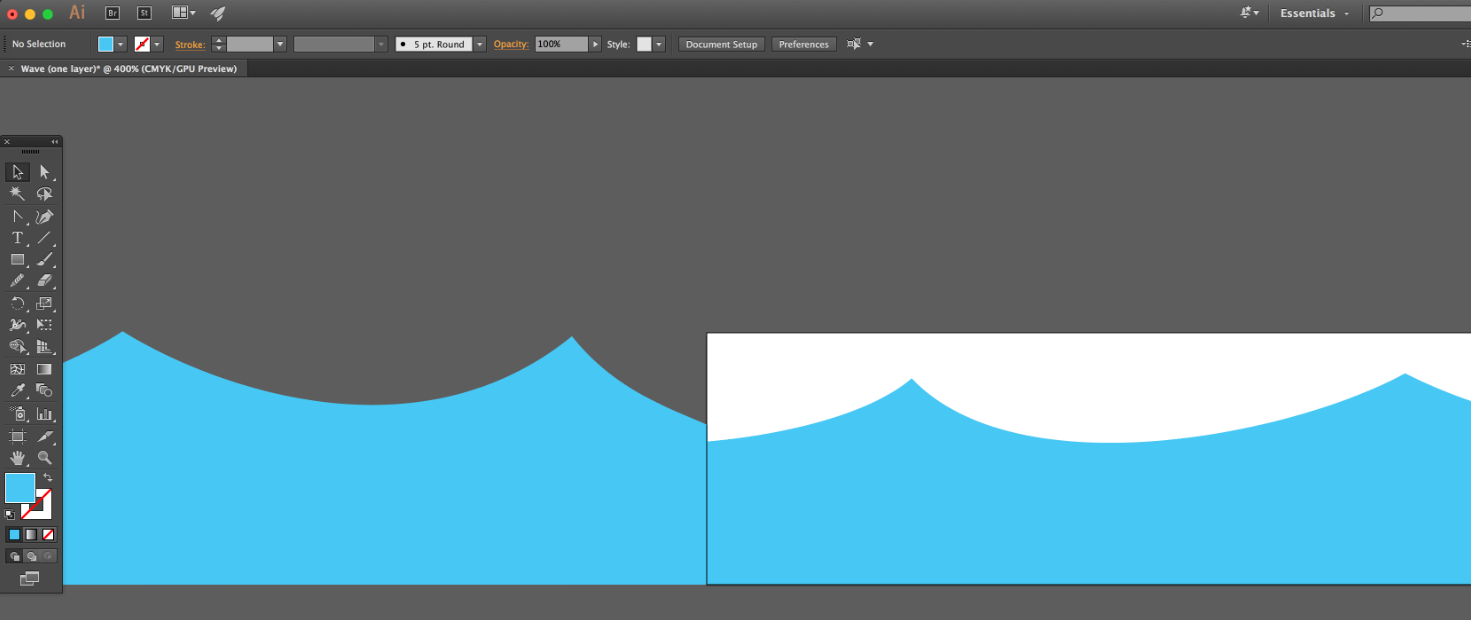
Version 2: The graphic extends beyond the artboard/view box
Adobe Illustrator Setup
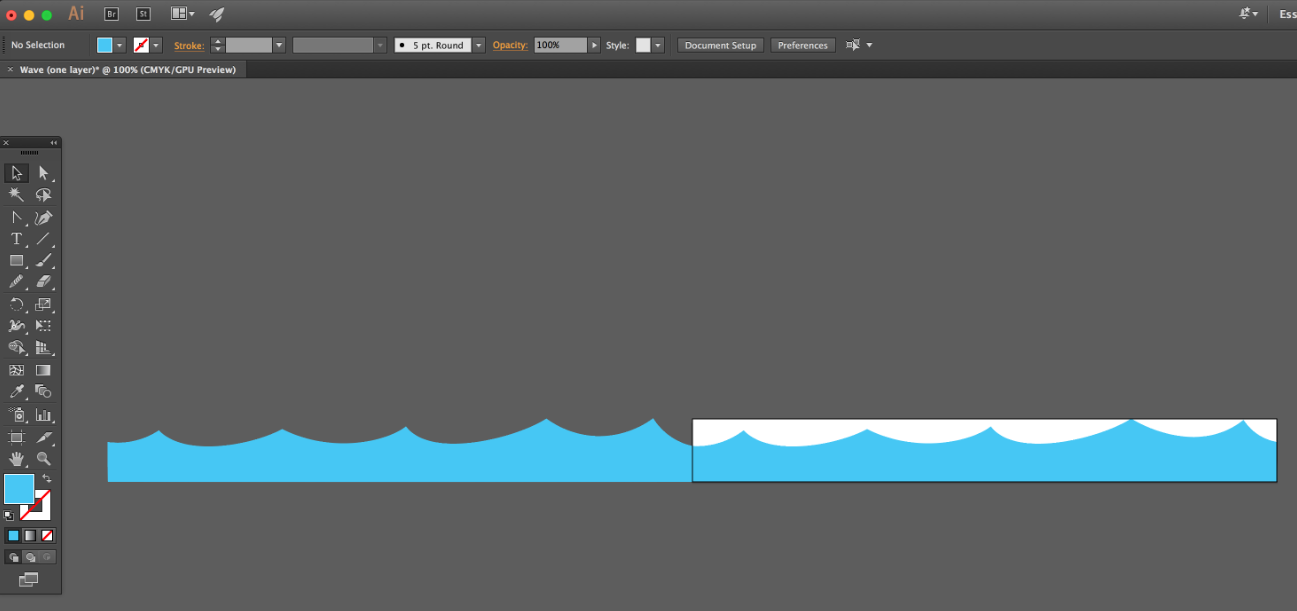
Result

What happens here? When the wave moves to the right, the white space of the artboard is being replaced with a graphic that is sitting in the grey area (as it also moves). After moving 659 px to the right, the graphic goes back to its original position and the animation is repeated. Therefore, we only need one duplicate of our graphic (same size) to be added to the left side. More on this later in the tutorial!
As you can see, the second version of the graphic is what we’ll need for our animation. But before we get to the part that everyone is waiting for (the animation!), we have to make some small tweaks to the vector graphic.
Firstly, in order to make the wave flow smoothly, each side of the graphic has to be slightly edited so that we can create a pattern when the duplicated vector and the original one are put side by side. As you can see below, by default edges of this particular vector are not matching perfectly. Thus, I have slightly changed the position of vector points at each side of the graphic, so that a uniform wave can be created. This step vastly depends on the type of animation you’re trying to achieve. Feel free to skip it if you don’t need a smooth flow of your graphic in the animation.
Before
After
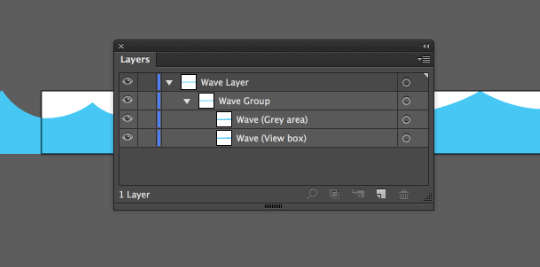
Next, group both segments of the wave (one in the view box, another one in the grey area) and give your group an appropriate name in the Layers window. Generally, it’s recommended to give a unique and easily identifiable name to each element on your artboard. SVG codes tend to be quite complex, as they hold a lot of information and mathematical statements used to define the position of an individual point. Having clear labels, especially if you’re trying to animate multiple objects at once, is necessary in order to efficiently work with SVG files.
Step 2: Export the SVG Graphic
Our vector graphic is now ready to be exported. Go to File -> Save As… and from the list of available formats select “SVG (svg)”. Click OK. Now click on the “SVG Code…” button and you’ll be presented with the code that will be the backbone of animations in the next step. The code should look something like this:
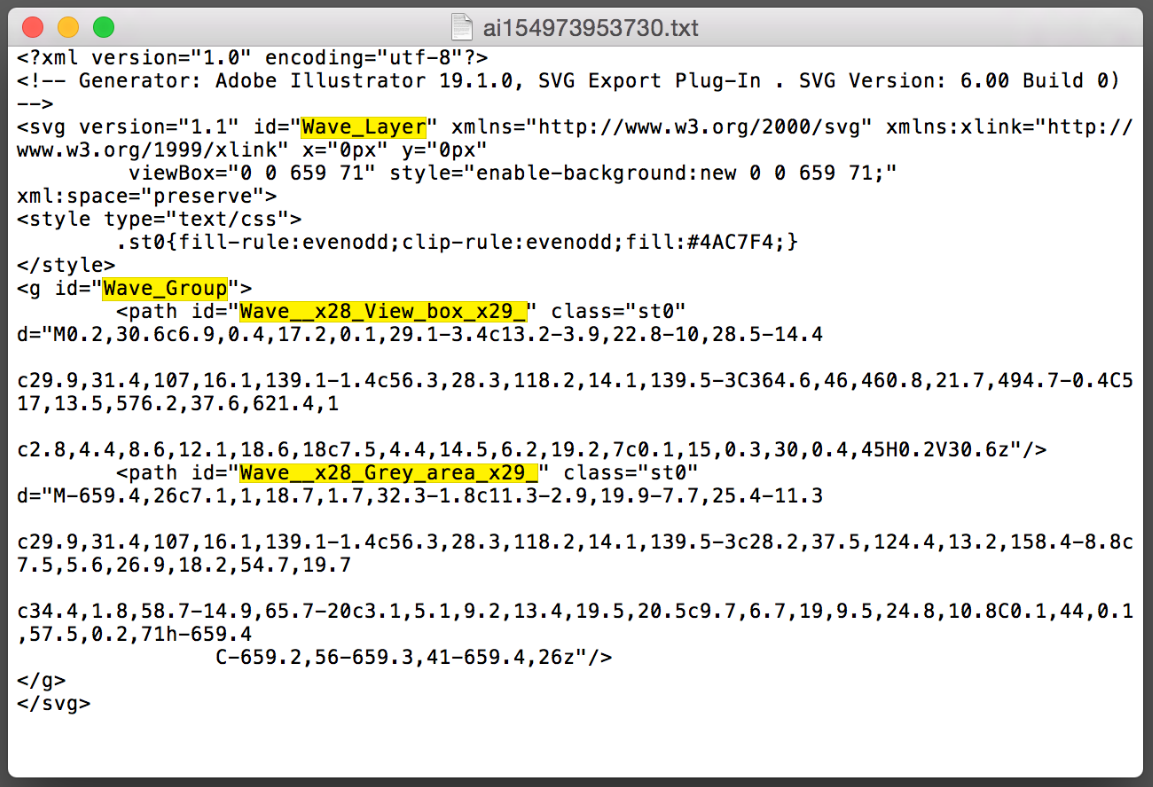
Next, copy the part of the code that starts with <svg version… and ends with </svg> (inclusive).
Step 3: The Holy Grail - Adding Animations
Before we add animations to the graphic, we have to convert our SVG code to HTML. To do this, we’ll need a basic HTML text editor such as Visual Code Studio (you can download it for free here). You can also use your Windows/Mac default text editor if you prefer but tools such as VCS make working with the HTML code easier. Once the text editor is ready, paste the SVG code copied in the previous step and wrap it in the additional code, which would allow us to convert the raw SVG code into the HTML format.
<html>
<head>
<style type=”text/css”>
body {
margin: 0px;
}
</style>
</head>
<body>
SVG CODE GOES HERE
</body>
</html>
The “margin” excerpt of the code is used to remove extra white space from each side of the final graphic.
Now, let’s animate our graphic. Copy and paste the following code underneath the <g id=”Wave_Group”> part:
<animateTransform
attributeName="transform"
type="translate"
values="0 0; 659 0;"
begin="0s"
dur="15s"
repeatCount="indefinite"
/>
In essence, this code is going to move (“translate”) our graphic 659pt to the right (“values”) in the time span of 15 seconds (“dur”). Afterwards, the graphic will be moved back to its original location and the animation will be repeated. The animation will be looped indefinitely (“repeatCount”).
Now, all that’s left to do is to save your file as HTML (File -> Save As…).
Note: If you’re keen on learning how exactly SVG animations work, I recommend reading the following tutorial which will give you a thorough understanding of this subject: How to Use “animateTransform” for Inline SVG Animation
Step 4: Save Your File on a Server
Tableau Public requires web-based objects (which we’re going to use in order to place our animated graphic on a dashboard) to be publicly available and accessed through the secured HTTPS protocol. My server of choice was AWS Simple Storage Service (S3), which meets both of these requirements. Those who already have an AWS account are probably familiar with the procedure of uploading files to this server. For others, after setting up your own access to the service, the following tutorial might come in handy:
Many thanks to my husband, Lukasz who massively helped with this!
Note: AWS S3 is a low-cost, highly scalable and durable object storage services. For more, see Amazon S3
Step 5: Place Your Graphic on a Tableau Dashboard
Once your file is uploaded to the server, copy the relevant object URL of your graphic, place a “Web Page” object on your Tableau dashboard and use the link as the destination URL. You can now publish your dashboard to Tableau Public and admire the beautiful animation that you have just created!
Thanks for reading. If you have any questions, feel free to comment below or reach out to me on Twitter @bluedilphia.
Kasia Gasiewska-Holc
February 10, 2019


This is awesome, thank you very much for explaining the process. :)
ReplyDeleteAmazing article to create custom animations makeover. Thank you so much
ReplyDeleteHI, this is beautiful, but what if there is no server and just using Tableau public then can this be achieved?
ReplyDeleteThis is beautiful, but then how can this be achieved using just Tableau public? isn't there any other way?
ReplyDeleteThe visualization is on Tableau Public, but the animation is hosted on AWS S3. You can get a free AWS account and use their free tier for hosting content such as this.
DeleteOhh perfect... will definitely give it a try.. thanks Ken...you guys boost us to put in more efforts in our work! Cheers
ReplyDeleteAnimation making is a creative job but it also hard . I have seen the full post . So well .
ReplyDeleteCreative Work Explained in a very well manner. Great Job.
ReplyDeleteYou have explained everything in a very detailed and proper manner! Highly appreciated.
ReplyDeleteThis comment has been removed by a blog administrator.
ReplyDeleteThis comment has been removed by a blog administrator.
ReplyDelete