
QGIS for Tableau Users # 4: What’s Nearby?
In this post in the QGIS for Tableau users series, we’re going to tackle the classic problem of ‘what is nearby?’ While there are some features built into Tableau to help with this (e.g., field calculations for buffers and distance, as well as the spatial intersection join type)—there are some types of proximity analysis that they can’t do. But, some nice data prep in advance can help you calculate many of the attributes you might need to unlock some special spatial functionality in your Tableau workbook.
This
post covers:
Spatial
joins
- assign attributes from one spatial dataset to another based on how they
overlap in space. Tableau has point and polygon spatial joins built in,
but what if you need to know what POLYGON every POLYGON overlaps? That
isn’t in Tableau (yet).
Voronoi
or Thiessen polygons
- make some new polygon geometry to show which area is closest to any given point
Lookup
table for adjacent polygons - tell me every polygon that this
polygon touches? I want to select a county and see the sum of sales for
all adjacent counties to compare! (I won’t actually use QGIS for this, but will
show you a super fast way of calculating this with another neat little tool).
The Real Basics (Your Series Disclaimer
Message!)
This
post goes into how-to for specific tasks. If you need to take a step back
and see where to even start (setting up QGIS, basics of adding and working with
files, etc.) please refer back to QGIS for Tableau Users #1: Getting Started
There
are also several great QGIS tutorials that will provide a broader (non-Tableau
focused) introduction to the power of the software, such as QGIS Tutorials and Tips.
Now,
we’ll get back to our regularly scheduled blog post message about awesome stuff
you can do with QGIS!
Why Analyze What’s Nearby?
Maps
are great for making sense of spatial patterns—and your eyes are the first line
of attack in the exploration. But, sometimes you need attributes to back up what you’re seeing with your
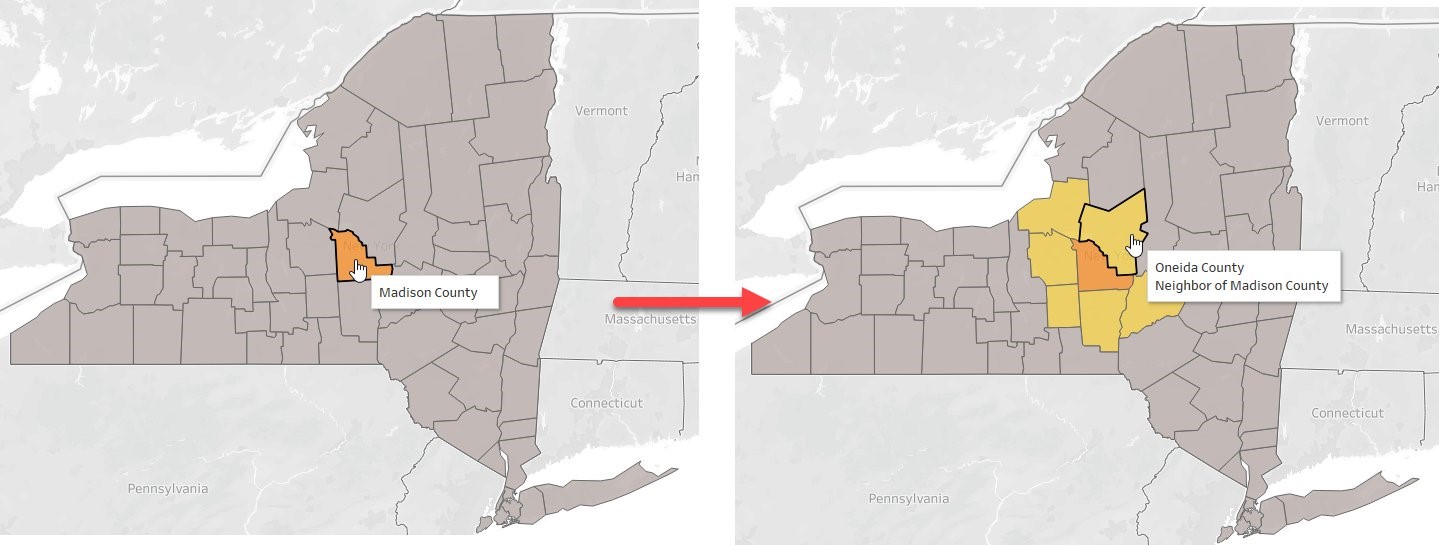
eyes. For instance, in the image below we can see the relationship between Madison County and it’s
neighbors...but we don’t have any attribute that would let us calculate
anything about those neighbors—for instance, maybe we want to know total number
of customers in that county compared to the average number in the neighboring
counties. To get that type of result, we need something that absolutely
links these locations together. So, even though we can see that they are neighbors, Tableau
can’t tell us that without help.
When You Don’t Need QGIS:
Most
of today’s post is on topics where you really can’t do them in Tableau at this
point in time—not even with some cheating. The things that you can do (or
at at least kinda) in Tableau are:
·
Use
the Tableau distance and buffer functions to find nearby locations (see this
post on Proximity analysis in Tableau)
·
Assign
spatial attributes based on overlap using the Spatial Intersection join
type in Tableau (2018.2 to 2021.2 support point to polygon intersections only;
2021.3+ support combinations of points, lines, and polygons).
·
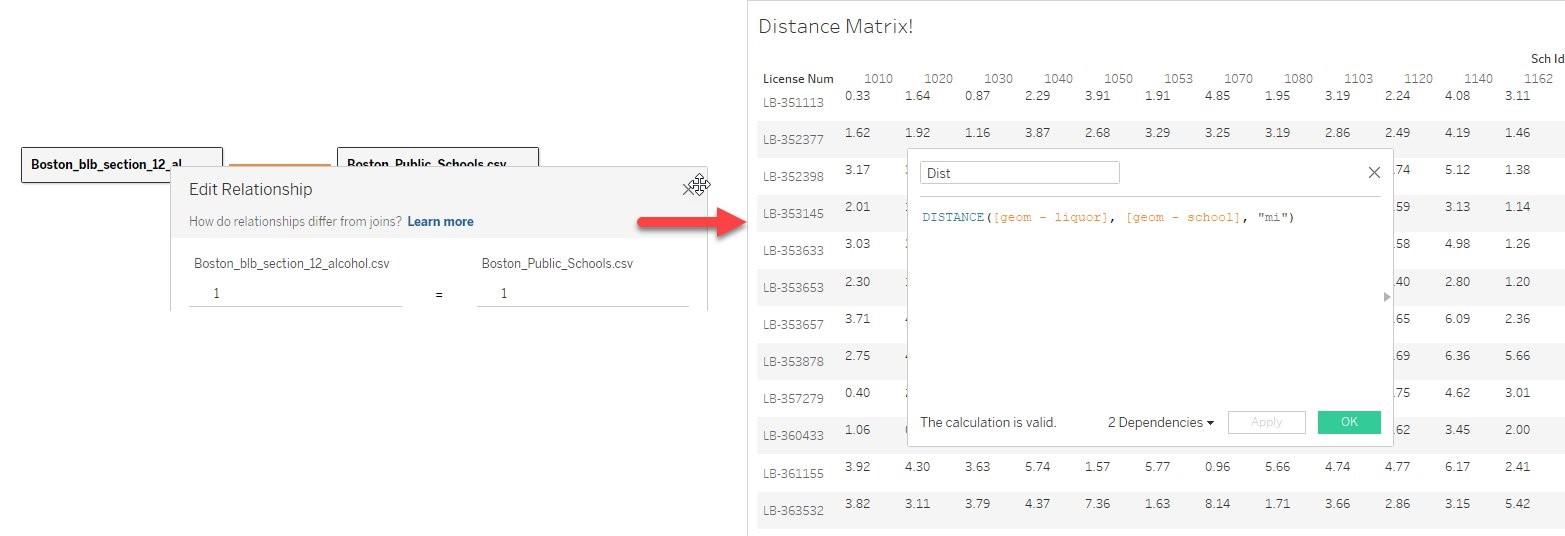
If
you want to make a table of distances from every point to every other point
(distance matrix). You can just join the table to itself in Tableau with
1=1 as the join calculation and then do the distance calculation.
Otherwise,
QGIS and other awesome spatial tools are your friend!
What I’ll Be Sharing
In
this post, I’ll walk through a few ways to set up your data to get it ready for
additional analysis and visualization in Tableau:
- Assign attributes from one dataset to another based on location (Spatial joins)
- Make polygons to find the region closest to any point in your dataset (Voronoi or Thiessen polygons)
- Make a lookup table with lists of all adjacent polygons
Spatial Joins
As
of Tableau 2021.3, Tableau supports spatial joins between just about any
combination of points, lines, and polygons. If you are working with an earlier
version of Tableau and need to do a spatial join between polygons and polygons,
or lines and polygons, for you will have to do that work outside of
Tableau. Since I’m writing away on fun things to do with QGIS, I’ll just
document how to do that here just in case you’re working with an earlier
version of Tableau. It’s worth at least a quick read, because I’ll include
ways to split your dataset at
the intersections. Tableau will just look for the intersection and mark
the entire feature as overlapping or not. With QGIS you can do the same,
but also break your lines or polygons based on where they overlap (‘cracking’
the lines or polygons into separate features). This comes in handy if you
want to be able to calculate area or length of just the overlapping segment,
for instance.
Essentially,
what we’re looking to do with the spatial join is just do a spatial check of
whether or not points, lines, and polygons share space...and if so, assign the
attributes based on their overlap.
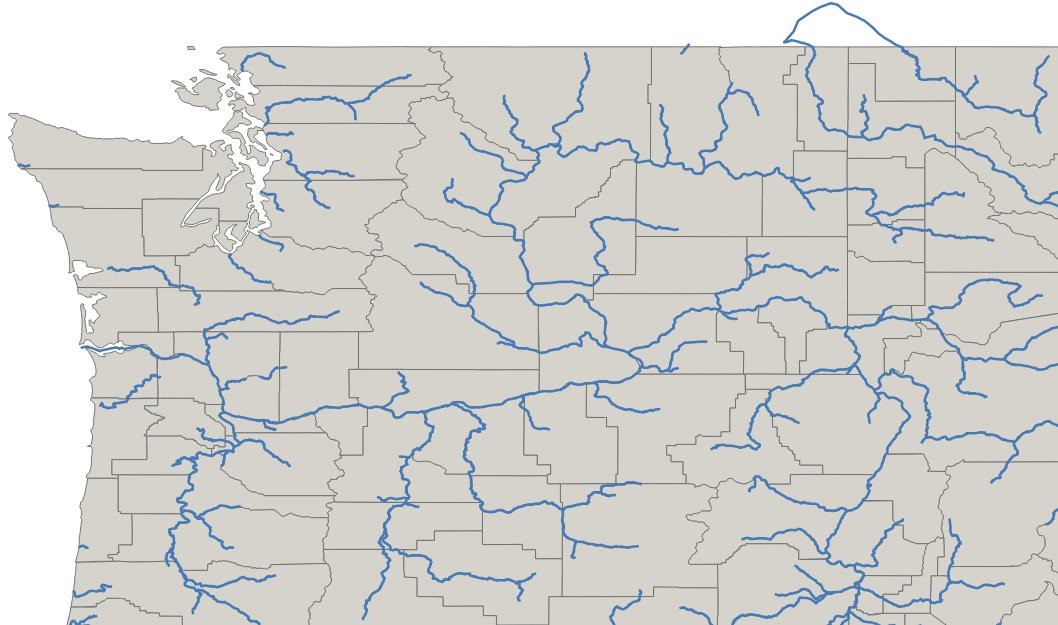
As
an example, if I had a set of rivers of the US from the National Weather Service and wanted to know which
county each river overlapped. I can see it
on the map, but I want each river to have an attribute so that I can select
rivers based on the counties they cross:
To
assign a county name attribute to each river, we have a few options
Vector
→ Geoprocessing
Tools → Union
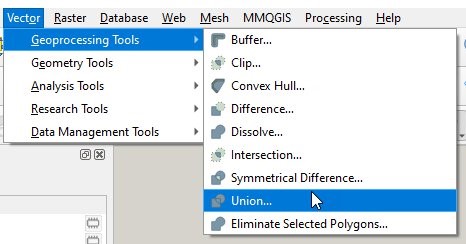
Using
Union you will combine multiple datasets to create a new dataset with separate
features for the overlapping and non-overlapping parts. In the case of our
rivers and counties, the rivers will be split at county boundaries returning a
separate segment for each county that they overlap. As part of the union,
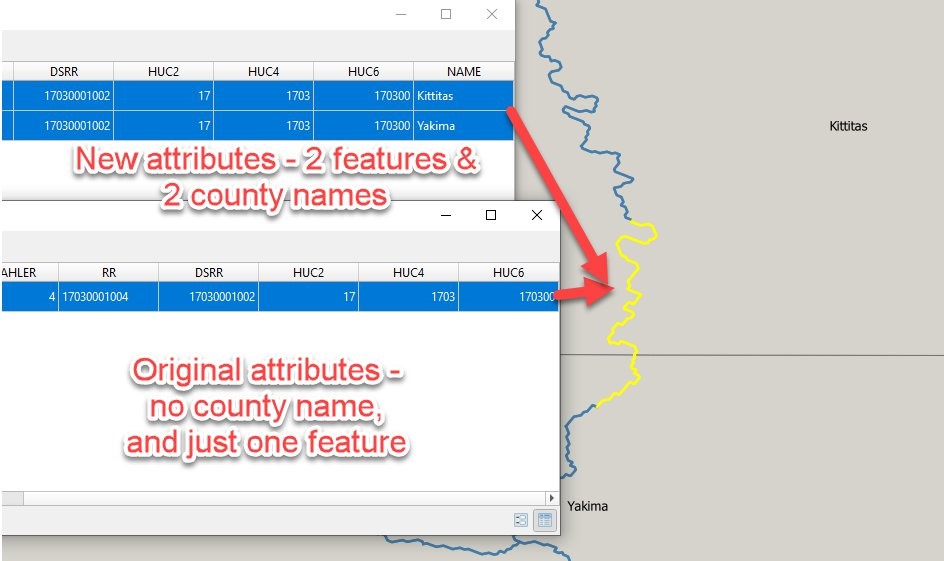
each feature will have the attributes of both files in the union. Here is
what it would look like for a highlighted line segment that crosses into two
counties. The original table had ONE line feature and no county name
attribute. The unioned result has TWO line features and the county name
for each county that the line overlaps.
Union
is great for anywhere that you want to ensure that you’ll return separate
geographies for each area of overlap!
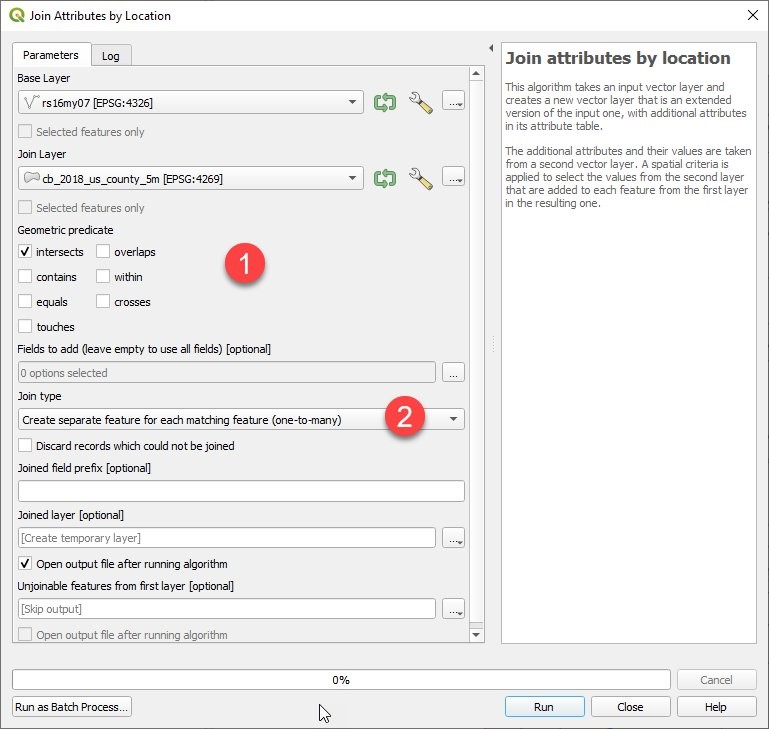
Vector
→ Data Management
Tools → Join attributes
by location
Using
Join attribute by location, you can choose (1) the specific type of geographic
relationship between the two layers (e.g., should rivers fall completely within
the counties? or just overlap? or intersect?) and (2) how you want the result
to be returned—do you make a new feature for every match (e.g., a river that
crosses multiple counties would return multiple records), or just the county
name that overlaps the most, or just the name of the first county that QGIS
encounters when it’s searching for overlaps?
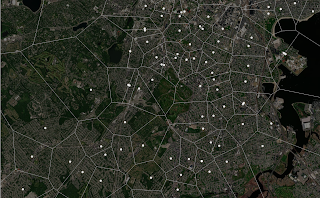
Voronoi or Thiessen Polygons
What
if you have a bunch of points and need polygons representing the entire region
that is closest to any
point? That’s an easy one—you need Voronoi polygons (or
you can call them Thiessen polygons...same thing)!
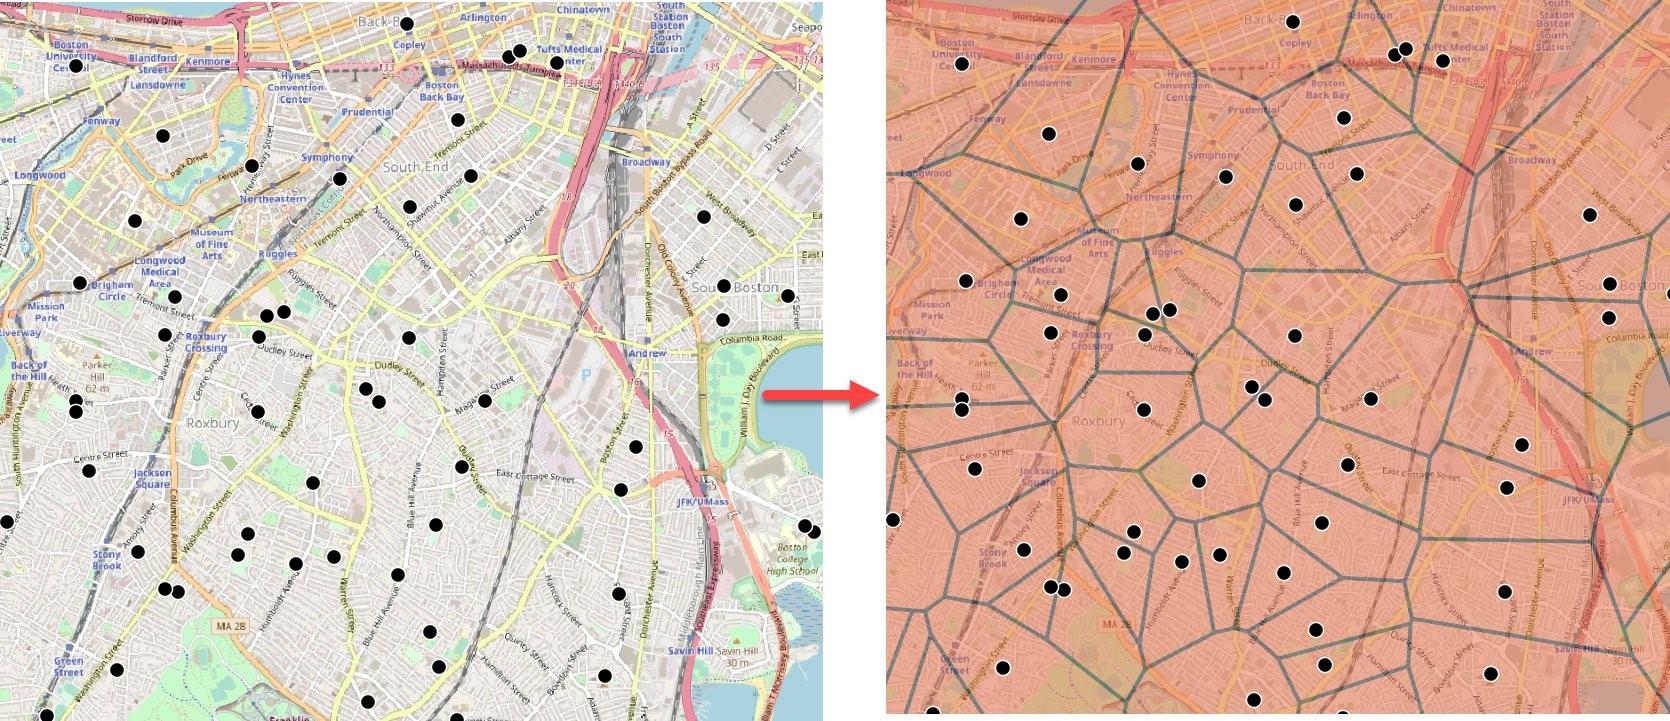
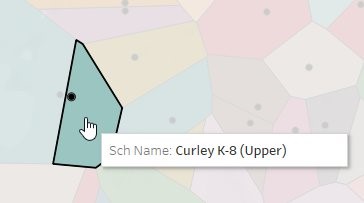
I’ll
demonstrate how to make these polygons with the Boston public schools (x/y in projected coordinates SRID:2249) dataset that I’ve used earlier in
this series of posts.
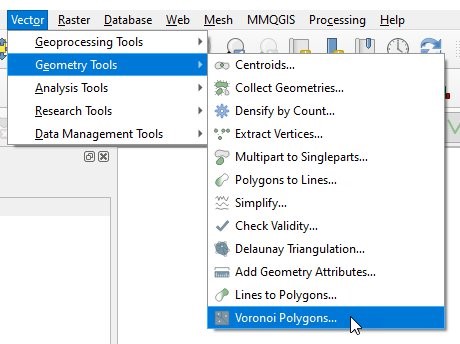
Just
open your point dataset in QGIS and click on Vector → Geometry Tools → Voronoi
Polygons...
You’ll
need to pick your buffer region (e.g., how big of a bounding box around the
extent of the data do you want...or should the polygons just go up to the edges
of the bounding box around all points in the dataset), but otherwise you can
just click run and see what happens!
If
the result looks like what you want, just right click and export to use in
Tableau. Each of the polygons will have all of the attributes of the point
that it was based on. Now you can use these polygons for any further
analysis! Since these are the polygons around schools, maybe you’d do a spatial
join in Tableau to find all of the students in the district in each of the
polygons around each school to check if they are assigned to the school that is
geographically closest.
Lookup Table for Adjacent Polygons
Periodically
on the Tableau forums, we get questions like this one about needing to find out all of the polygons that touch or are
adjacent to a selected location. That’s a fun spatial question! If
you’re working with 2021.3, you can actually do this with the spatial
intersection feature—just join the polygon dataset to itself and you’ll be able
to identify which polygons share an edge (the intersection will catch polygons
that overlap, but also polygons that
share edges/have borders that overlap somewhere).
However,
if you’re working with earlier Tableau versions, this isn’t something you can
do easily with just the Tableau tools. However, there are easy ways to
make tables of adjacency.
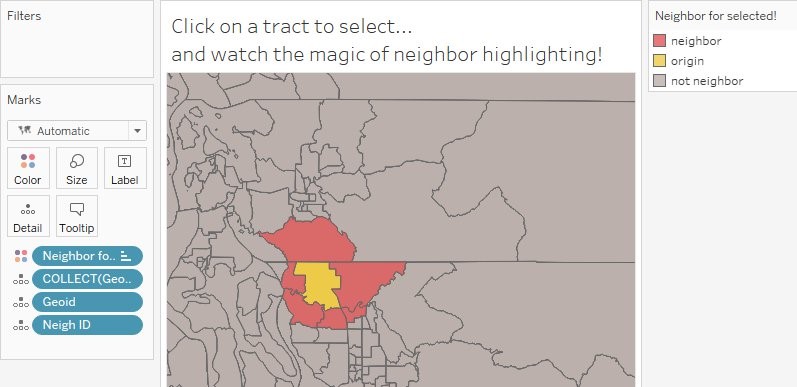
When
I say “table of adjacency,” I’m talking about a table with a list of matches
for every polygon that touches every other polygon. If a polygon has three
neighbors, there are three lines in the table with that polygon ID & the ID
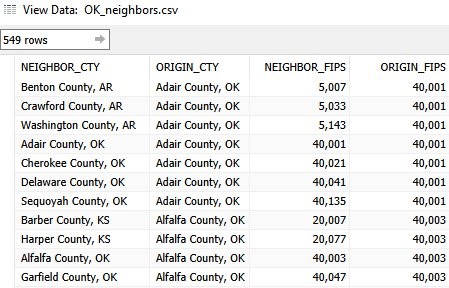
of each of the three polygons it touches. So, in this example from
Oklahoma, there are duplicates of each origin county (ORIGIN_CTY) to provide a list
of each neighboring county (NEIGHBOR_CTY). In the table here, I have two
types of location identifier: county/state name and the FIPS code (a unique
identifier that you can use to map in Tableau without using the county name field)
While
this series has been intended as a set of QGIS tutorials, QGIS is not my
favorite tool for this particular type of analysis. So, we’re going to
jump to a new and exciting option for a really
quick calculation of adjacency for any
set of polygons! As with all fun things geospatial, it’s all about
finding the right tool to get the job done (and to do it in a reasonably easy
and accurate way).
Note: If you happen
to just be working with US counties, the Census has a nice table of county adjacency that you can just download—you may need to do a little
cleaning to get it to fit your exact need, but the adjacency is already
calculated and ready to go! So, maybe you don’t even need to use any
special geo tools if that is your use case!
I
realize that Python isn’t everyone’s preferred option, but this is a nice quick
way to get some complex and useful results. For this problem, my tools of
choice are the PySAL and
GeoPandas Python
libraries. PySAL does the heavy lifting and GeoPandas makes it easier for
me to manipulate the result and dump it out into a table.
Here
is the quick script example that demonstrates how to make the matrix. With
this little script we generate the matrix and then export it as a table for use
in Tableau.
from libpysal.weights import
Queen
import geopandas as gpd
# where is the spatial file
shp_path =
"tl_2019_53_tract.shp"
# read it into a geopandas
geoDataFrame
gdf =
gpd.read_file(shp_path)
# use a named ID Variable
(GEOID is the unique ID in my test file)
w_queen_id =
Queen.from_dataframe(gdf, idVariable='GEOID')
# run through some results
and make a table!
# maybe cleaner ways to do
this, but this was fast for me
rows = []
for key in
w_queen_id.neighbors:
for id in w_queen_id.neighbors[key]:
rows.append([key, id])
# write the results to a csv
df = gpd.GeoDataFrame(rows,
columns=["originID", "neighID"])
df.to_csv(r"neighbor_list.csv")
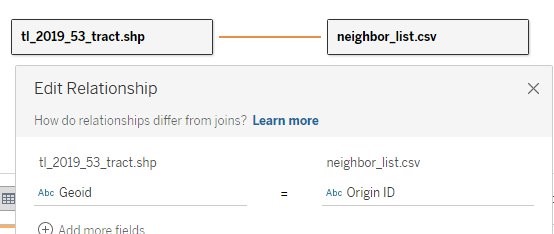
Using the Table in Tableau
It’s
just a quick relationship between the tables in Tableau! All I have to do
is take my spatial file and connect it to the list of neighbors generated with
PySAL. The link between them is the ID that I used in generating the
neighbor list (GEOID) and the Origin ID field in my neighbor_list table.
After
that, it’s just setting up the interaction in Tableau. I have a workbook on Tableau Public that you can download to check it out!
Wrap-Up
And
those are some basic (or maybe kinda advanced) techniques that I use to explore
spatial proximity/relationships between my data to help with my analytics in
Tableau.
For
now, this is the last in my little series of QGIS to enhance the spatial
analytics options that you can do in your Tableau workbook. I’m happy to
talk more and think about other fun ways to manipulate spatial data! Feel
free to reach out on the Tableau Community Forums or to follow more of the random Tableau spatial thoughts
that I share on Twitter (@mapsOverlord)...or
to share the great maps that you’re making in Tableau!
Sarah
Battersby
November 29, 2021


No comments: