
Make Your Tableau Bins Dynamic
I find histograms to be fascinating—both in the insights that they can bring us and in the various complexities we run into when creating them in Tableau. If you’re a regular reader of our blog or you happened to catch Kevin and I at Tableau Conference 2022, you may remember that I’ve addressed this topic in the past. In our TC22 presentation and in How to Build Lovely Histograms in Tableau, I provided some of my favorite tips for building nice histograms in Tableau. But that blog glossed over something that probably deserves a bit more attention—the bin size. Instead of letting Tableau choose a bin size for me, I created a parameter so that users can choose their own bin size. I like this technique as it allows the user to explore the data by experimenting with different bin sizes. But there are some instances where you’d be better off setting the bin size yourself or using something more dynamic and not letting the users touch it. For instance, perhaps your users are new to data visualization and have no idea what bin size to choose? Or what if you apply filters to your chart, which causes those bin sizes to be nonsensical? Or what if your data changes significantly over time, making the bin sizes inapplicable?
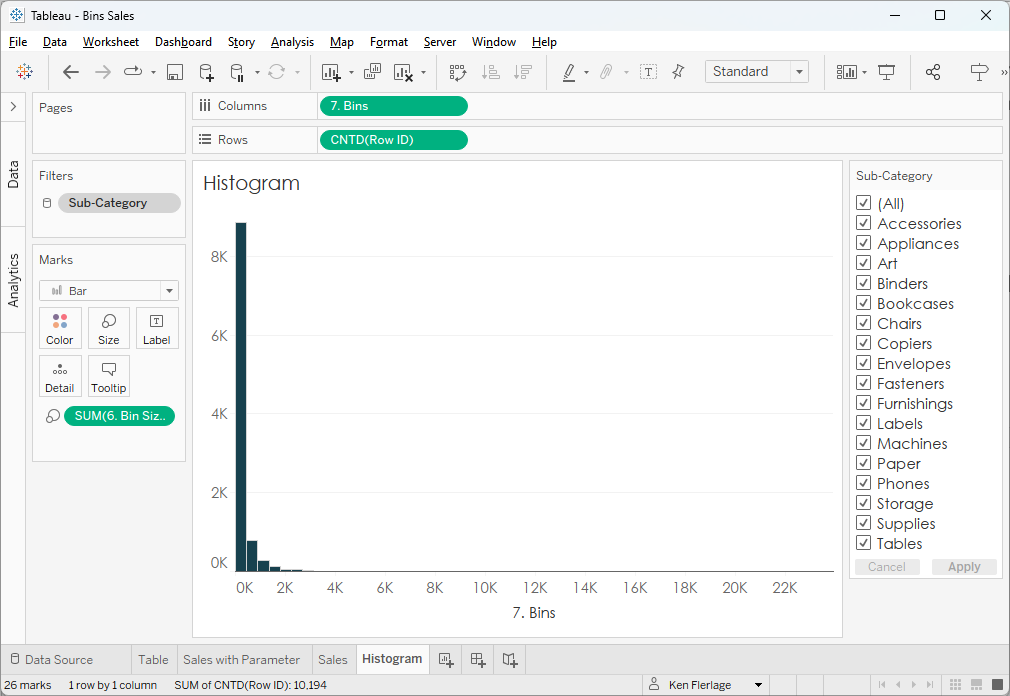
Let’s look at an
example. Below I’ve created a histogram showing the number of rows binned by
sales. I’m using a parameter value of 400 for the bin size.
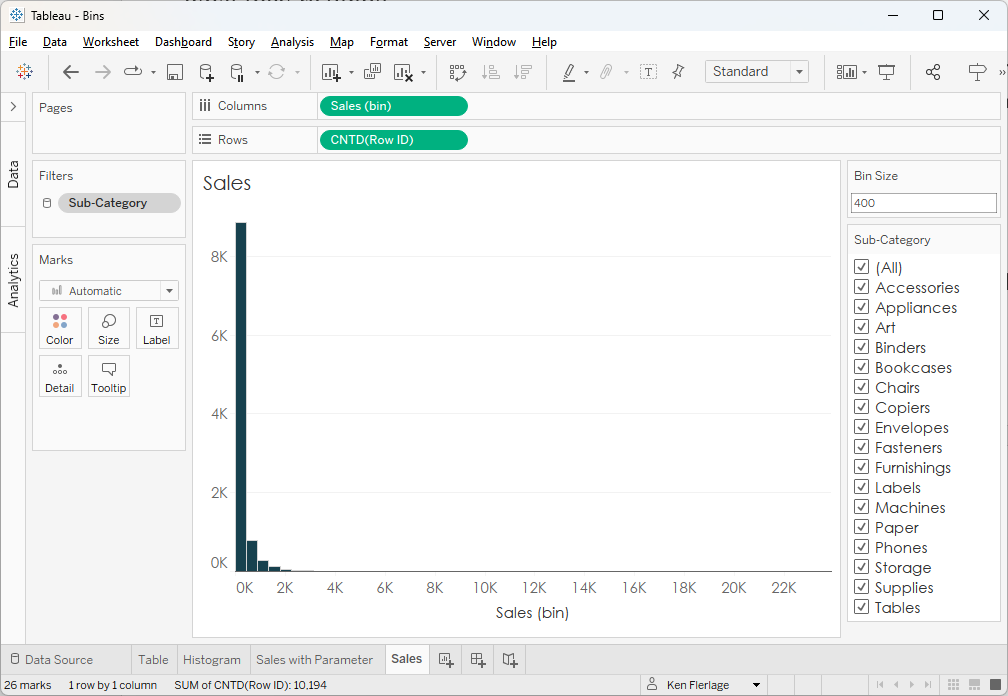
When we’re
looking at all sub-categories, this bin size might make sense, but what if we
filter down to a specific sub-category? For example, let’s look at Envelopes.
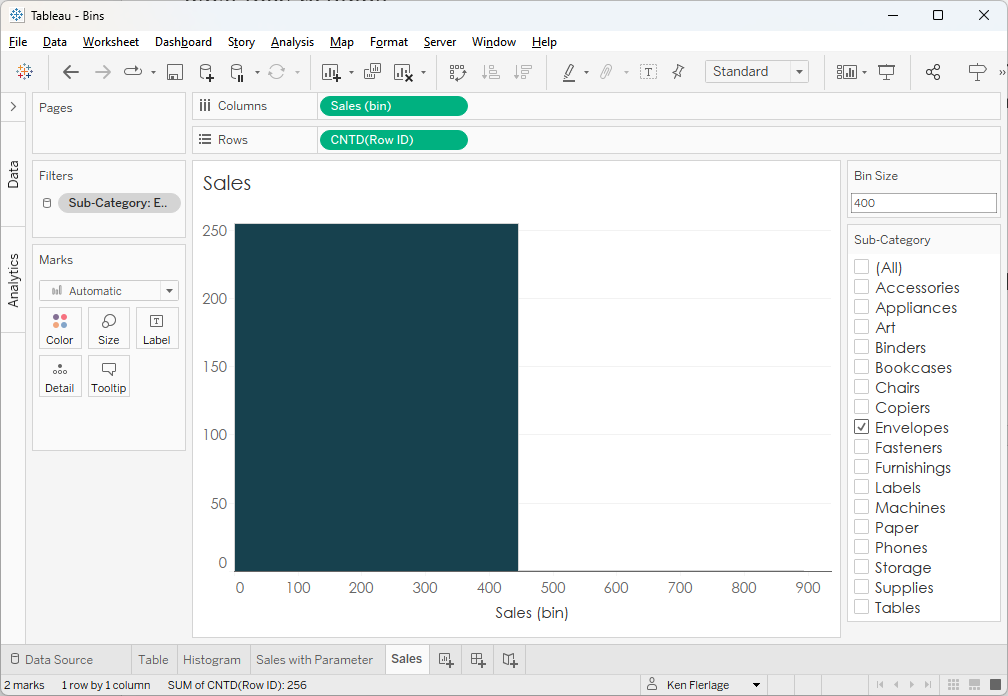
Envelopes are
comparatively cheap, so it’s not surprising that sales of envelopes almost always
fall within that first bin of 0-400. In this case, it might be better to choose
a bin size that is more applicable to the data in our view. With the bin size
parameter, our users can change it manually, but if they are filtering a lot,
the constant editing of the bin size could be a burden—especially if our users
aren’t quite sure what they’re doing.
So, in these
situations, it might be better for us to create a dynamic bin size that
automatically adjusts based on the data in our view. This is the exact problem
I recently addressed on a post on the Community Forums. And, today, I’ll share a technique for
auto-adjusting dynamic bins in Tableau.
Calculating the
Bin Size
OK,
so let’s give this a try and see what we can do. We could, of course, just let
Tableau choose the bin size for us. So, let’s create bins on Sales…
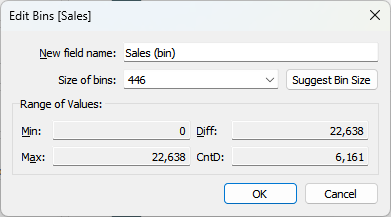
Tableau automatically
chooses a bin size of 446 for us. Can you see the problem already? It’s
creating this value by looking at the entire data set and then it’s setting
that as a static bin size. But tomorrow your data might completely change,
making this value no longer applicable. Or, as we showed earlier, your users
might filter the data, limiting the usefulness of this static value. So, how
can we can choose the value Tableau suggests but also make it dynamic?
Well, if we knew
the math that Tableau uses to calculate the bin size, then we might be able to calculate
it dynamically, right? The good news is that the math Tableau uses is known.
Jeffrey Shaffer’s blog, Bin There, Done That: A Discussion of Bins in Tableau gives us the exact math:
Bin Size = (Max
Value – Min Value)/Number of Bins
Number of Bins
= 3 + log2(n) * log(n)
…where n is the
unique number of values in that measure.
Let’s do this in
small chunks of calculated fields. We’ll start by counting n—the number
of unique values in our measure.
1.
Distinct Values
// Number of unique values of the measure.
COUNTD([Sales])
Now, since we
have the value of n, we can calculate the number of bins.
2.
Number of Bins
// Formula to get number of bins is 3 + log2(n) * log(n)
// log2(n) = log(n)/log(2).
3 + LOG([1. Distinct Values])/LOG(2)
* LOG([1.
Distinct Values])
Next, we can find
the min and max values of the measure, then find the difference.
3.
Min Value
// Minimum value of profit.
MIN([Sales])
4.
Max Value
// Maximum value of profit.
MAX([Sales])
5.
Difference
// Difference between min and max.
[4. Max Value]-[3. Min Value]
Then we can apply
the Bin Size Calculation
6.
Bin Size
// Bin size = (Max Value - Min Value)/Number of Bins
// Use LOD to make sure this value works across all levels of
detail.
{FIXED : [5. Difference]/[2. Number of Bins]}
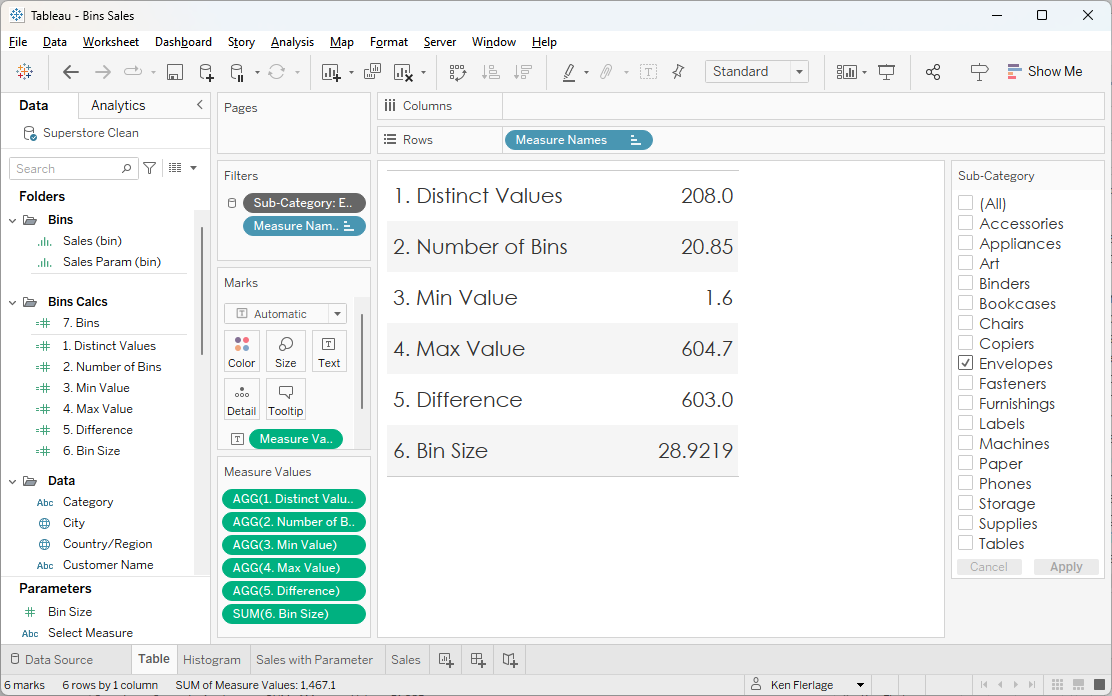
Now let’s look at
the value of each of these variables.
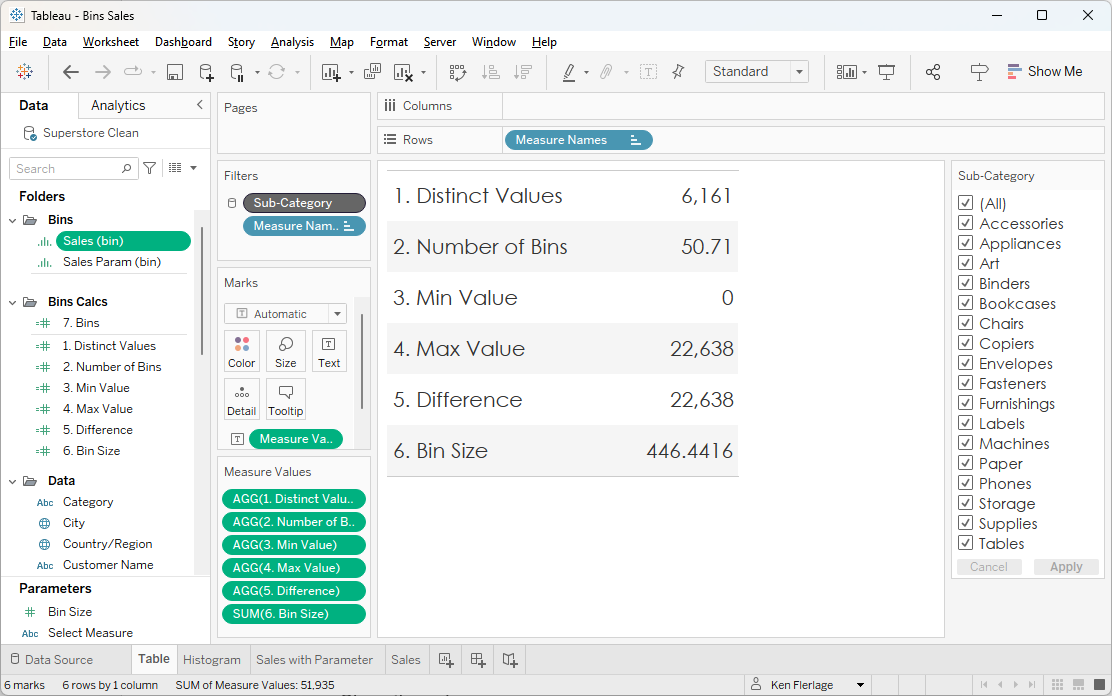
As we can see
here, our bin size is approximately 446. That should look familiar as it
matches the bin size that Tableau chose for us automatically. That’s great news
as it validates our calculations! However, unlike the number Tableau chose for
us, this value is now dynamic and will adjust to the data in our view. So, if
we filter to Envelopes, we’ll get a different bin size.
Note: Since the
Bin Size calculated field uses an LOD, the filter on Sub-Category has been
changed to a context filter so that it computes before the LOD in the Order of Operations.
As we can see, we
now get a much smaller bin size of approximately 29.
Using it with Our
Bins
Now
that we have the bin size, we need to use it in our bins. But we immediately
run into a problem. Built-in Tableau bins only give you two options—a static
value or a parameter. Unfortunately, neither of those options will allow us to use
a calculated field. We could tinker with dynamic parameters, but those only
update when the workbook is opened, so I guess we’re just stuck—but hey, it was
a good effort, right? Of course not!! As detailed on my other histograms post,
we can leverage the “Bring Your Own Bins” technique developed by Joe Mako,
which I first learned about from Jonathan Drummey’s blog. This
technique entails the use of a relatively simple calculated field instead of
built-in bins. The calc looks like this:
INT([Value]/[Bin
Size])*[Bin Size]-IIF([Value]<0,[Bin Size],0)
Where
Value is our measure and Bin Size, of course, is our bin size. Using
Sales as our measure, we now have this:
7.
Bins
// Bring your own
bins.
INT([Sales]/[6. Bin Size])* [6.
Bin Size]-IIF([Sales]<0, [6. Bin Size],0)
Now we can use
this instead of our built-in bins field:
Note: Be sure to
apply some of the techniques addressed in my other blog, including dropping Bin
Size on the size card and changing the mark type to bar.
Now we have
something very similar to what we created at the very beginning. However, as data changes or we
change filters, the bin size will automatically adjust. Let’s select Envelopes
to see what happens.
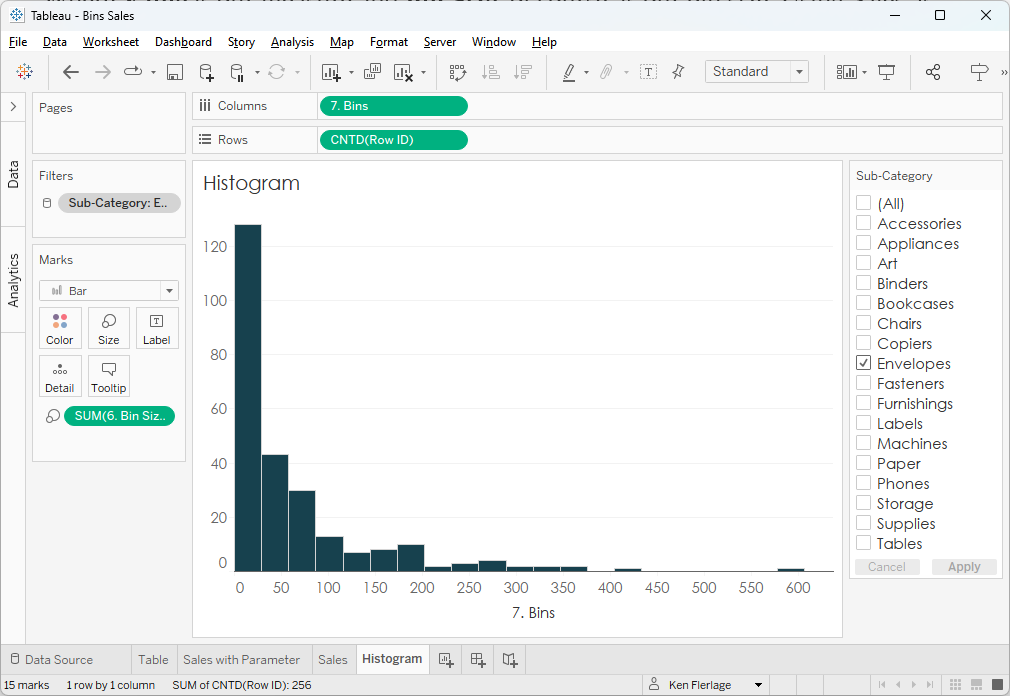
Our bin size has
now adjusted to 29, giving us a histogram that makes much more sense when only
viewing Envelopes than the one with a bin size of 446.
Wrap-Up
I
personally had a lot of fun working through this problem. While this blog was
definitely quite wonky, I think that there are many scenarios where this technique
makes a lot more sense than choosing the initial recommended bin size or using
a parameter. It may not be the best solution in all cases, but I’m hopeful that
it will come in handy in a variety of situations.
Thanks
for reading. If you have any questions or thoughts, please feel free to leave
them in the comments section below.
Ken
Flerlage, June 26, 2023


what is CNTD(row ID)? what's row ID?
ReplyDeleteThanks for this awesome walk-through ! I followed this process but was not able to successfully recreate what you outlined with my own data. My "7. Bins" calc appears as a "SUM(7.Bins)" in my Columns shelf and I only have . Did you aggregate [Sales] measure prior to using it in the calculation? What's the data-type for the "7. Bins" calculation ?
ReplyDeleteWhen you drag the Bins field to the Column shelf, you'll need to right click the pill and change it to a dimension.
DeleteKen, this is a great work-around for dynamic bins! I do have a question - is it possible to have the width of each bar match the range of values within the bin? For example, the range of values in my first bin is 0 - 2,000. I'd like the bar for this bin to extend from 0 - 2,000 on the x-axis, instead of having the bar sit at 0
ReplyDeleteThe bar should start, on the left, at 0, and end at 200 on its right. If you're not seeing that, then there might be something wrong. First thing I'd check is to make sure the bins field (on columns) is continuous, not discrete. If that's not the problem, feel free to email me. flerlagekr@gmail.com.
Delete