
Why You Need an Analytics Platform (and Why Excel is Not Enough)

In the past few years, I’ve written almost solely about Tableau, but this post is a little different. I’m going to step back and speak to a different audience at a much higher level and try to give you some reasons why you need to invest in a solid analytics platform.
Imagine you are one of the
following people:
- An Executive Decision-Maker
- A Board Member Who Wants to
Grow the Company
- A Department Manager Trying to Make
Better Decisions
Or, perhaps, you have some level
of responsibility for providing data to these decision-makers:
- An Analyst with Solid Excel
Skills
- A Beginner Who’s Just Completed
Some Data Literacy Training
Given this blog’s focus on
Tableau, you probably haven’t been here before. You probably don’t even know
what Tableau is. And you might be wondering why you need it or, for that
matter, why you need an analytics platform at all. You have your enterprise
systems that run the company and your people are good with Excel, so why do you
need anything more? To explore that question, let’s start with a scenario…
The Scenario
In this scenario, imagine you are one of the people responsible
for providing data to the decision-makers. You might be a guru who can make Excel
do all kinds of incredible things. Or you might be a beginner who’s just completed
a series of data literacy training. Or, more likely, you are somewhere in
between.
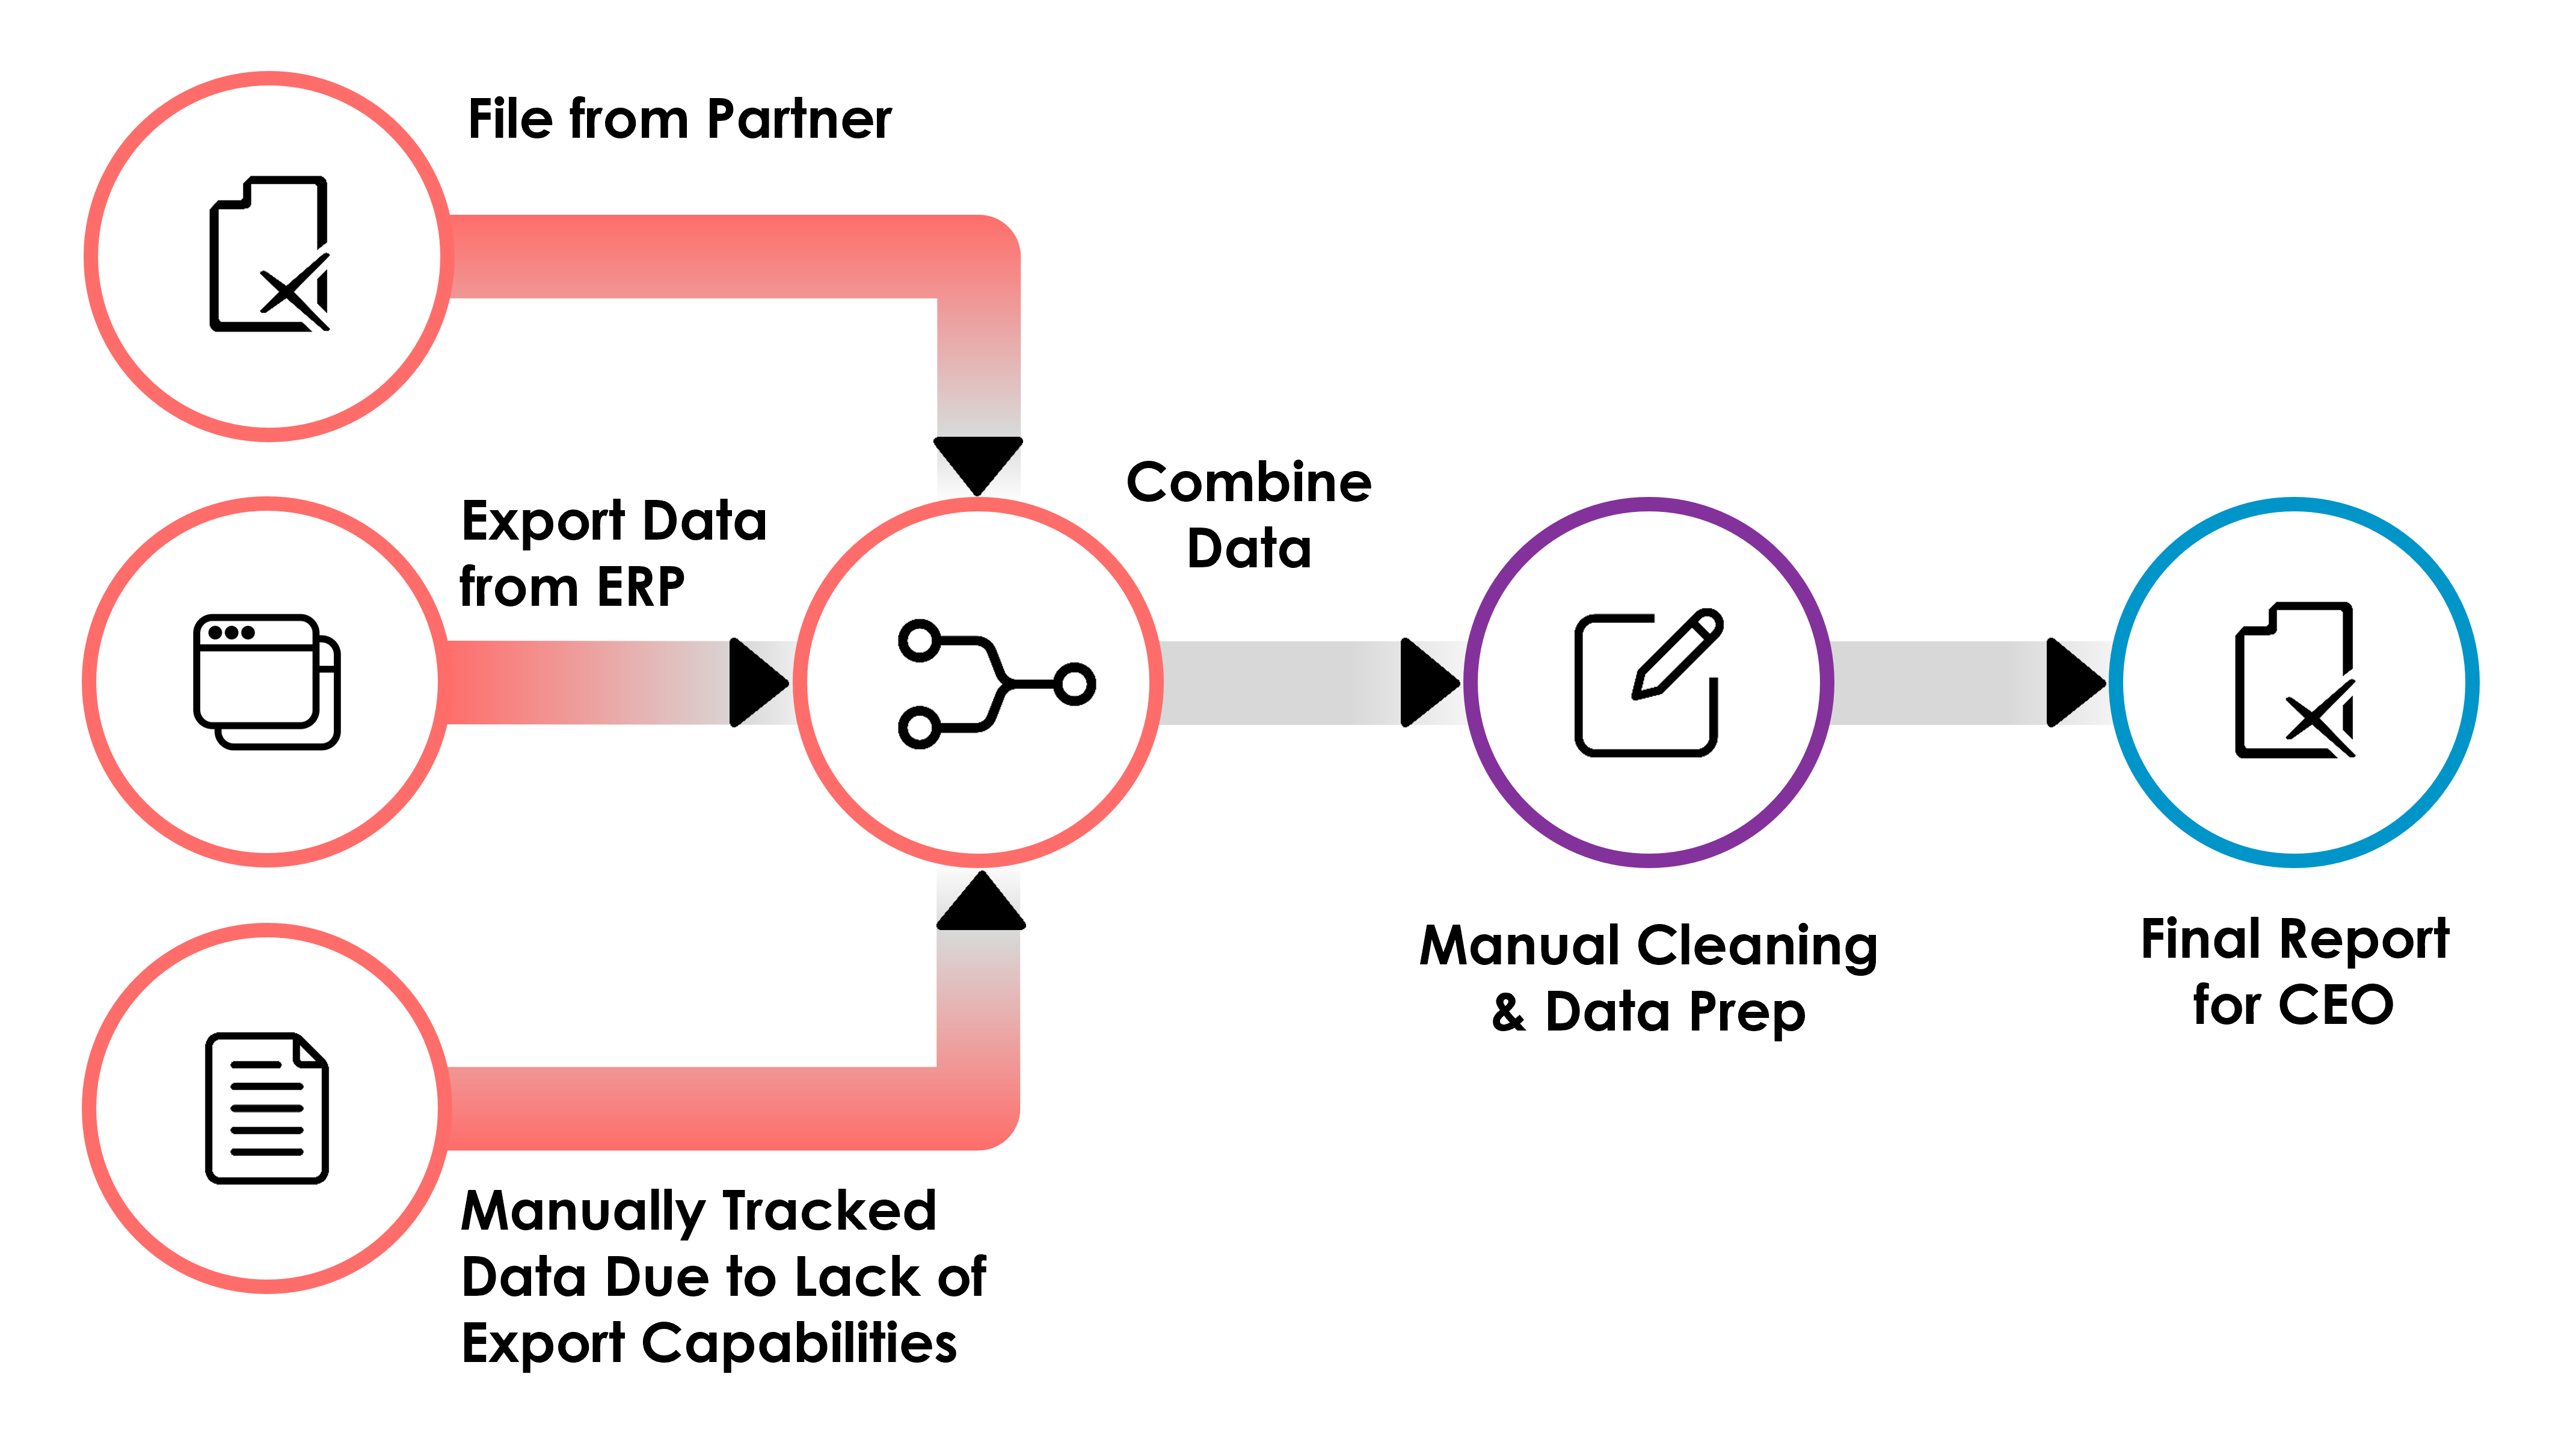
Now imagine that you have a partner that provides you with some
data on a regular basis—it could be inventory data, information about their sales
pipeline, or any number of other useful data. Your CEO needs a report using this
data twice a month to help inform various decisions. Data-informed decisions,
you say!! Well, that’s exactly why you’ve worked to build your data literacy skills,
right? So, how might you provide this information to your CEO? You start by
talking to that partner and asking that they send the data twice a month. Once
you have the data in hand (it’ll most likely be in Excel format), you realize
it needs a bit of cleaning and data prep before you can use it in the CEO’s
report. You clean the data in Excel, diligently documenting your steps along
the way, then use that data to produce an Excel-based report.
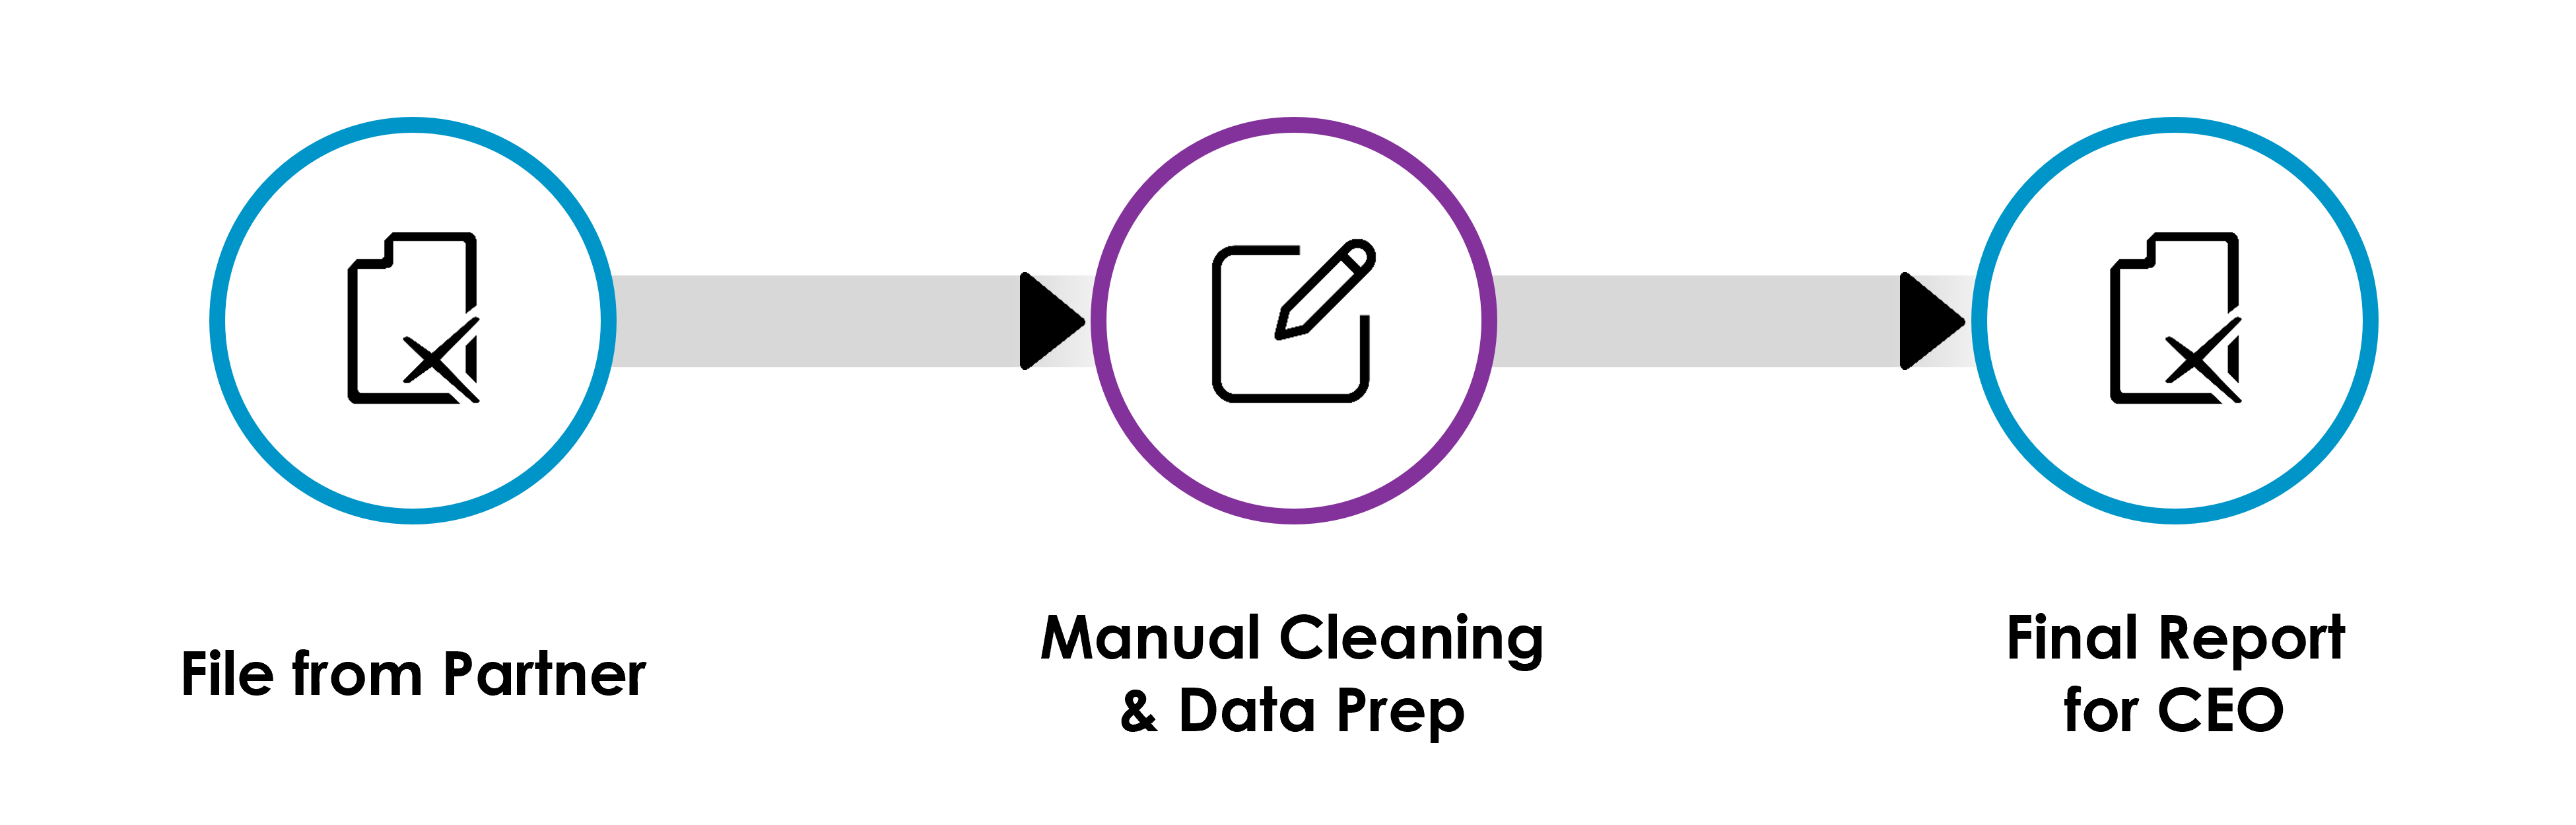
Fortunately, the cleanup process
isn’t too complicated and you’re able to produce the CEO’s report relatively
quickly. In all, it’s only taking you one hour to get the information to your CEO.
Since she needs it twice a month, that’s only two hours per month. What’s best
is that your CEO is absolutely thrilled—the report has enabled her to identify
some problematic trends and she’s already taking proactive measures to address
them.
Well done! Seriously...you've been
able to apply your skills to help the organization make data-informed decisions
that were previously made purely on gut instinct. That is what data skills are
all about!!
Complication # 1
But, as you probably know, things
are rarely this simple. So, let’s complicate the scenario slightly. After using
your report for a while, your CEO asks if you could add in some Item Master
data from your Enterprise Resource Planning (ERP) system. That information will
provide additional context that will allow her to slice the information in
different ways and further tune her decision-making process. This is a great
thing as it means that your report is getting used and your CEO is now starting
to ask better, more detailed questions. Our goal should always be better answers to better questions so this is an exciting development and you’re
eager to meet her needs.
But you don’t work with the ERP
system that much, so you start researching the best ways to get data out of it.
You find out that it has a database, so you start trying to figure out how you
can connect to that database. Unfortunately, the database administrator doesn’t
like people connecting to the database and, even if they were to allow that,
the tables and fields within it have incredibly cryptic names. The item master
table name is F4101 (who could have guessed that?), it has over 200 fields, and
the fields are names are things like: IMITM, IMLITM, IMAITM, IMDSC1, IMALN,
IMSRP1, IMUOM1, IMATPAC. Note: This is a real example, taken from JD
Edwards, but virtually all ERP systems have similarly cryptic table and field
naming. This is because the databases generally have thousands of tables and
they needs some standard naming conventions in order to create consistency.
To make things worse, these types
of systems are designed to be able to quickly process the creation and updating
of data—they are not built for analytics—so they use a relational database
model. Because of this, there are another dozen or so tables that also contain
Item Master related data. You spend a week trying to figure out how to bring
all this data together, but your mind is blown, and you decide that the best
option is to simply export the data from the Item Master application in the ERP
system. You only get the partner data twice a month, so it shouldn’t be a big
deal to just export that data from the ERP twice a month as well, right?
OK, so now that you have your
Item Master data, you need to combine it with the partner’s data then perform
your cleaning and data prep. You find ways to combine the data using lookups and
macros in Excel. That’s a little tricky, but you document your steps and you’re
able to produce the report for the CEO.
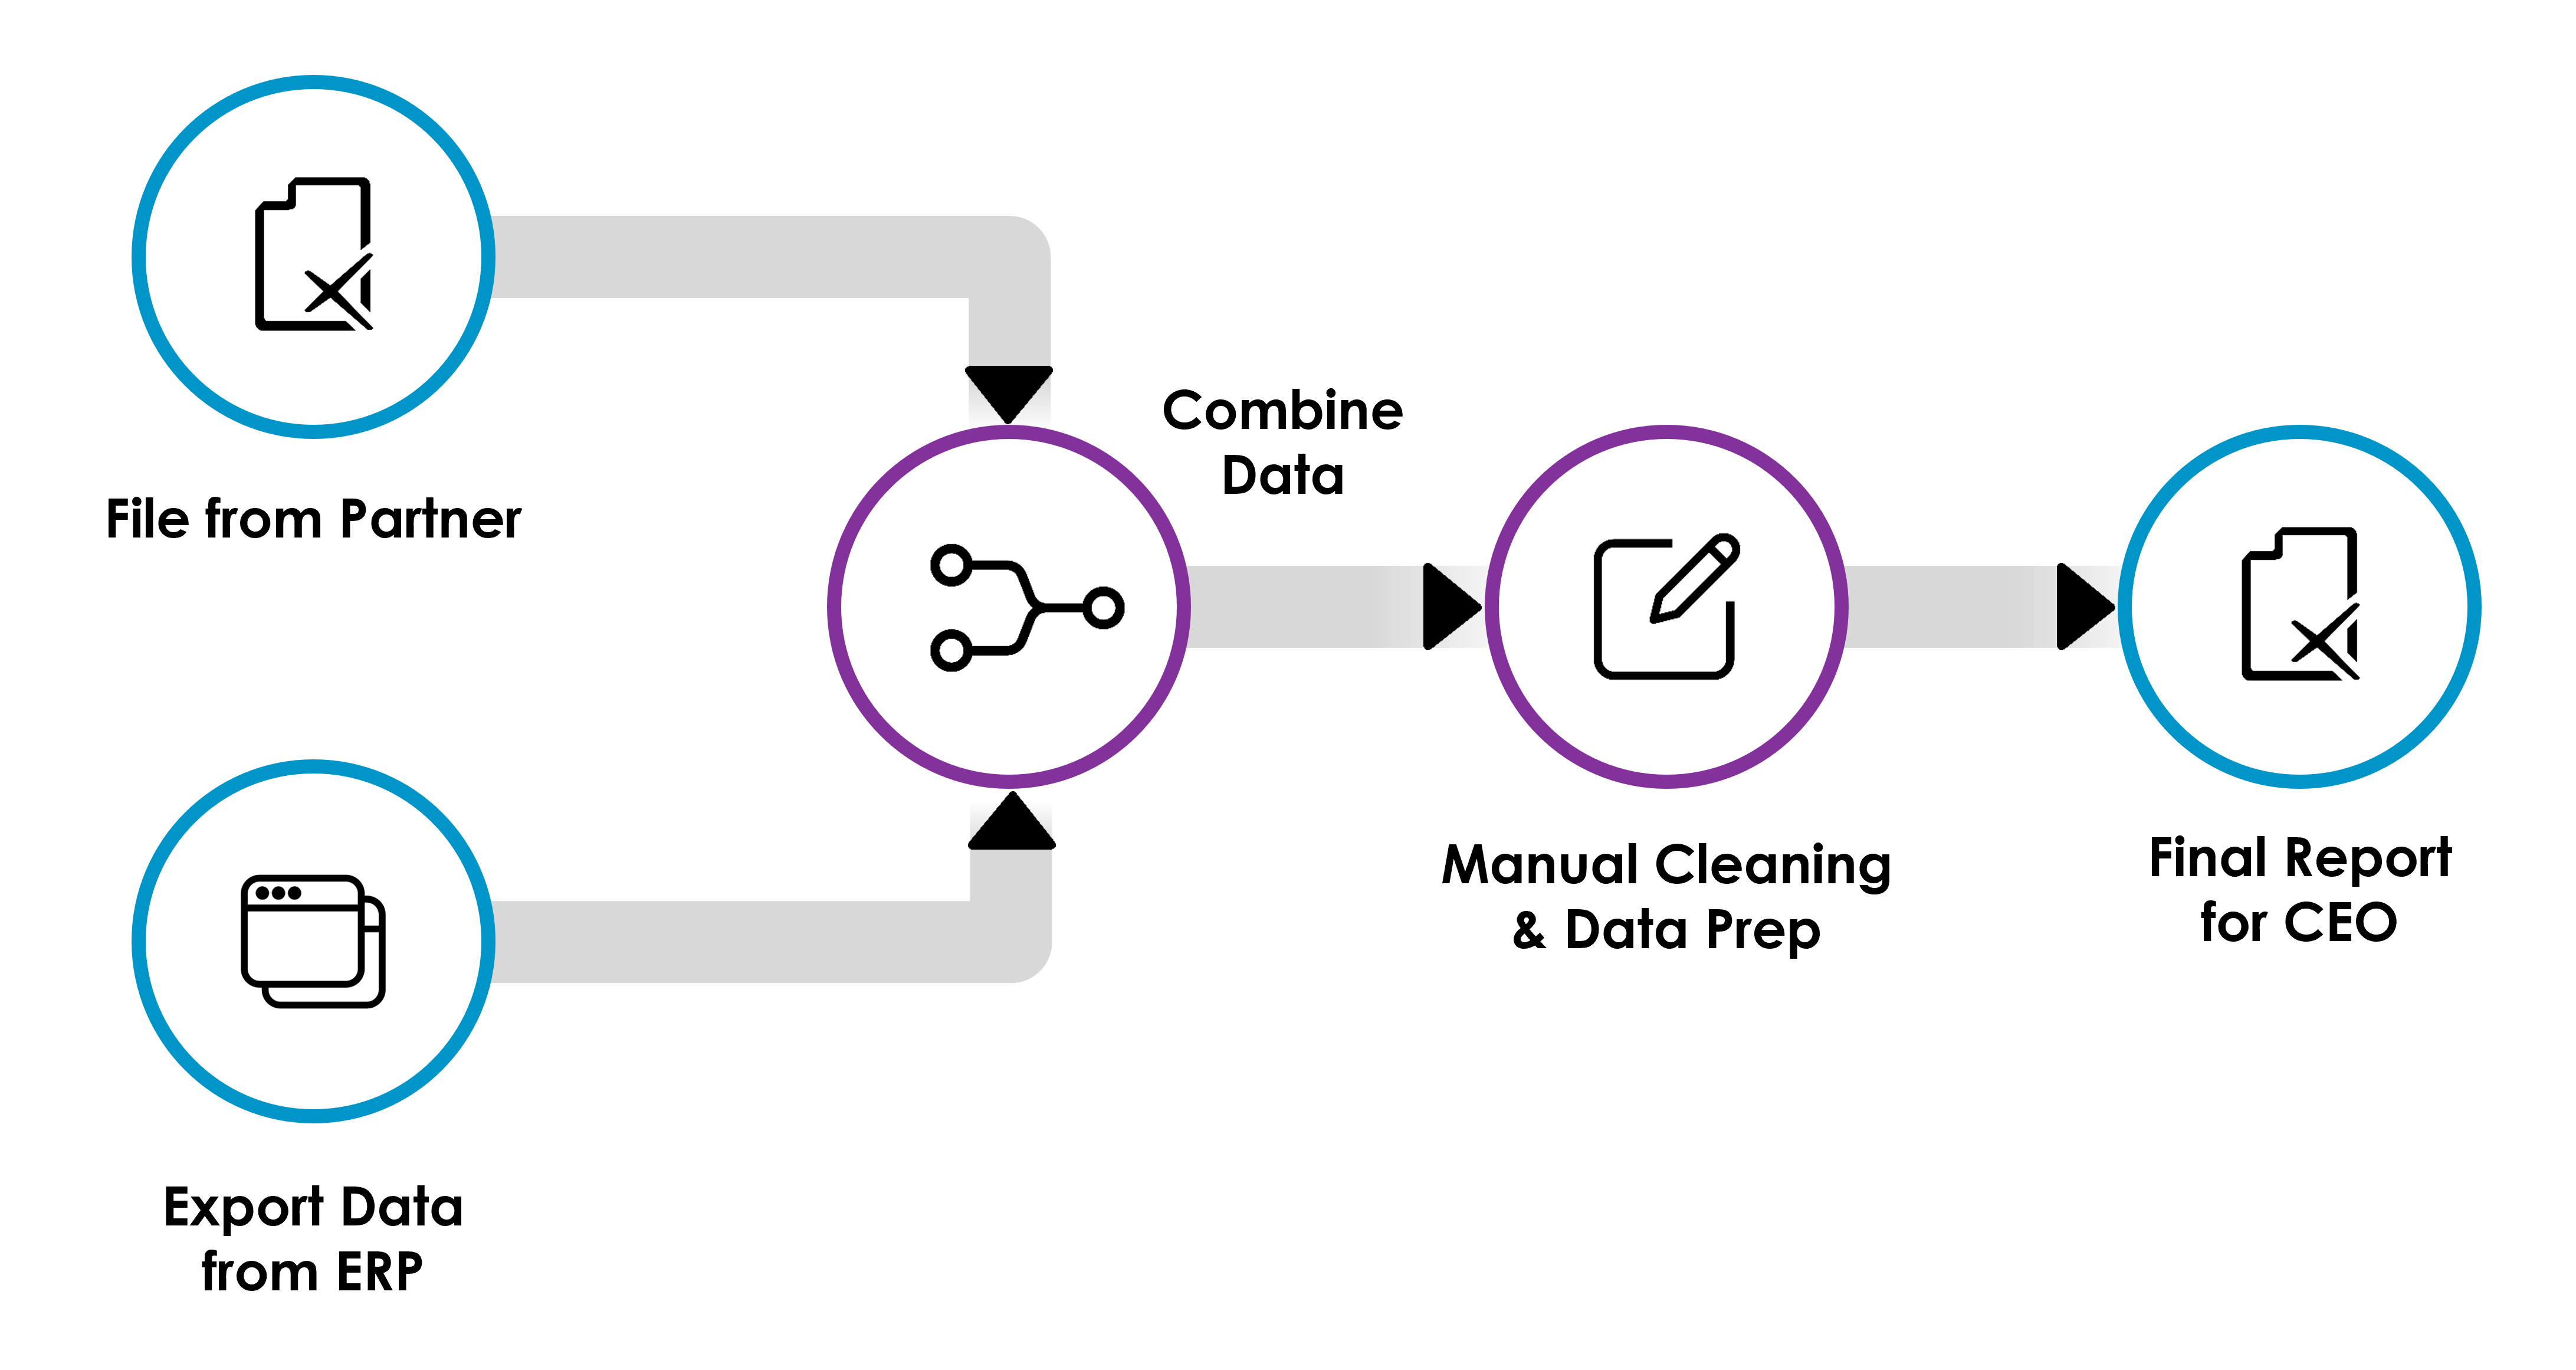
Those additional steps added a
bit of time to the process—it now takes two hours instead of one—but you only
need to do it twice a month so no big deal. Your CEO is thrilled and puts the
new report to work right away!
Complication # 2
Given that the last section was
titled “Complication # 1”, I’m guessing you’re not surprised to hear that I’m
going to add another complication. After a couple of months using the updated report,
your CEO asks you to add another new data set to the report. You’ve never heard
of the system that has the data she needs since it’s pretty niche and only
maintained by a couple of people. So, you reach out to the owner of that system
to see if it has a database you can connect to. Unfortunately, it’s a cloud-based
software-as-a-service solution and doesn’t allow that. So, you ask about
export capabilities. Unfortunately, it’s a rudimentary system and doesn’t have
such capabilities. So, what do you do? Your options are quite limited, so you
do the only thing you can—you decide that you'll need to track the data
manually in a spreadsheet so that you can pull it into your reporting. Now, in
addition to receiving the data from your partner and exporting the item master
from your ERP, you now need to manually transcribe the data into a spreadsheet.
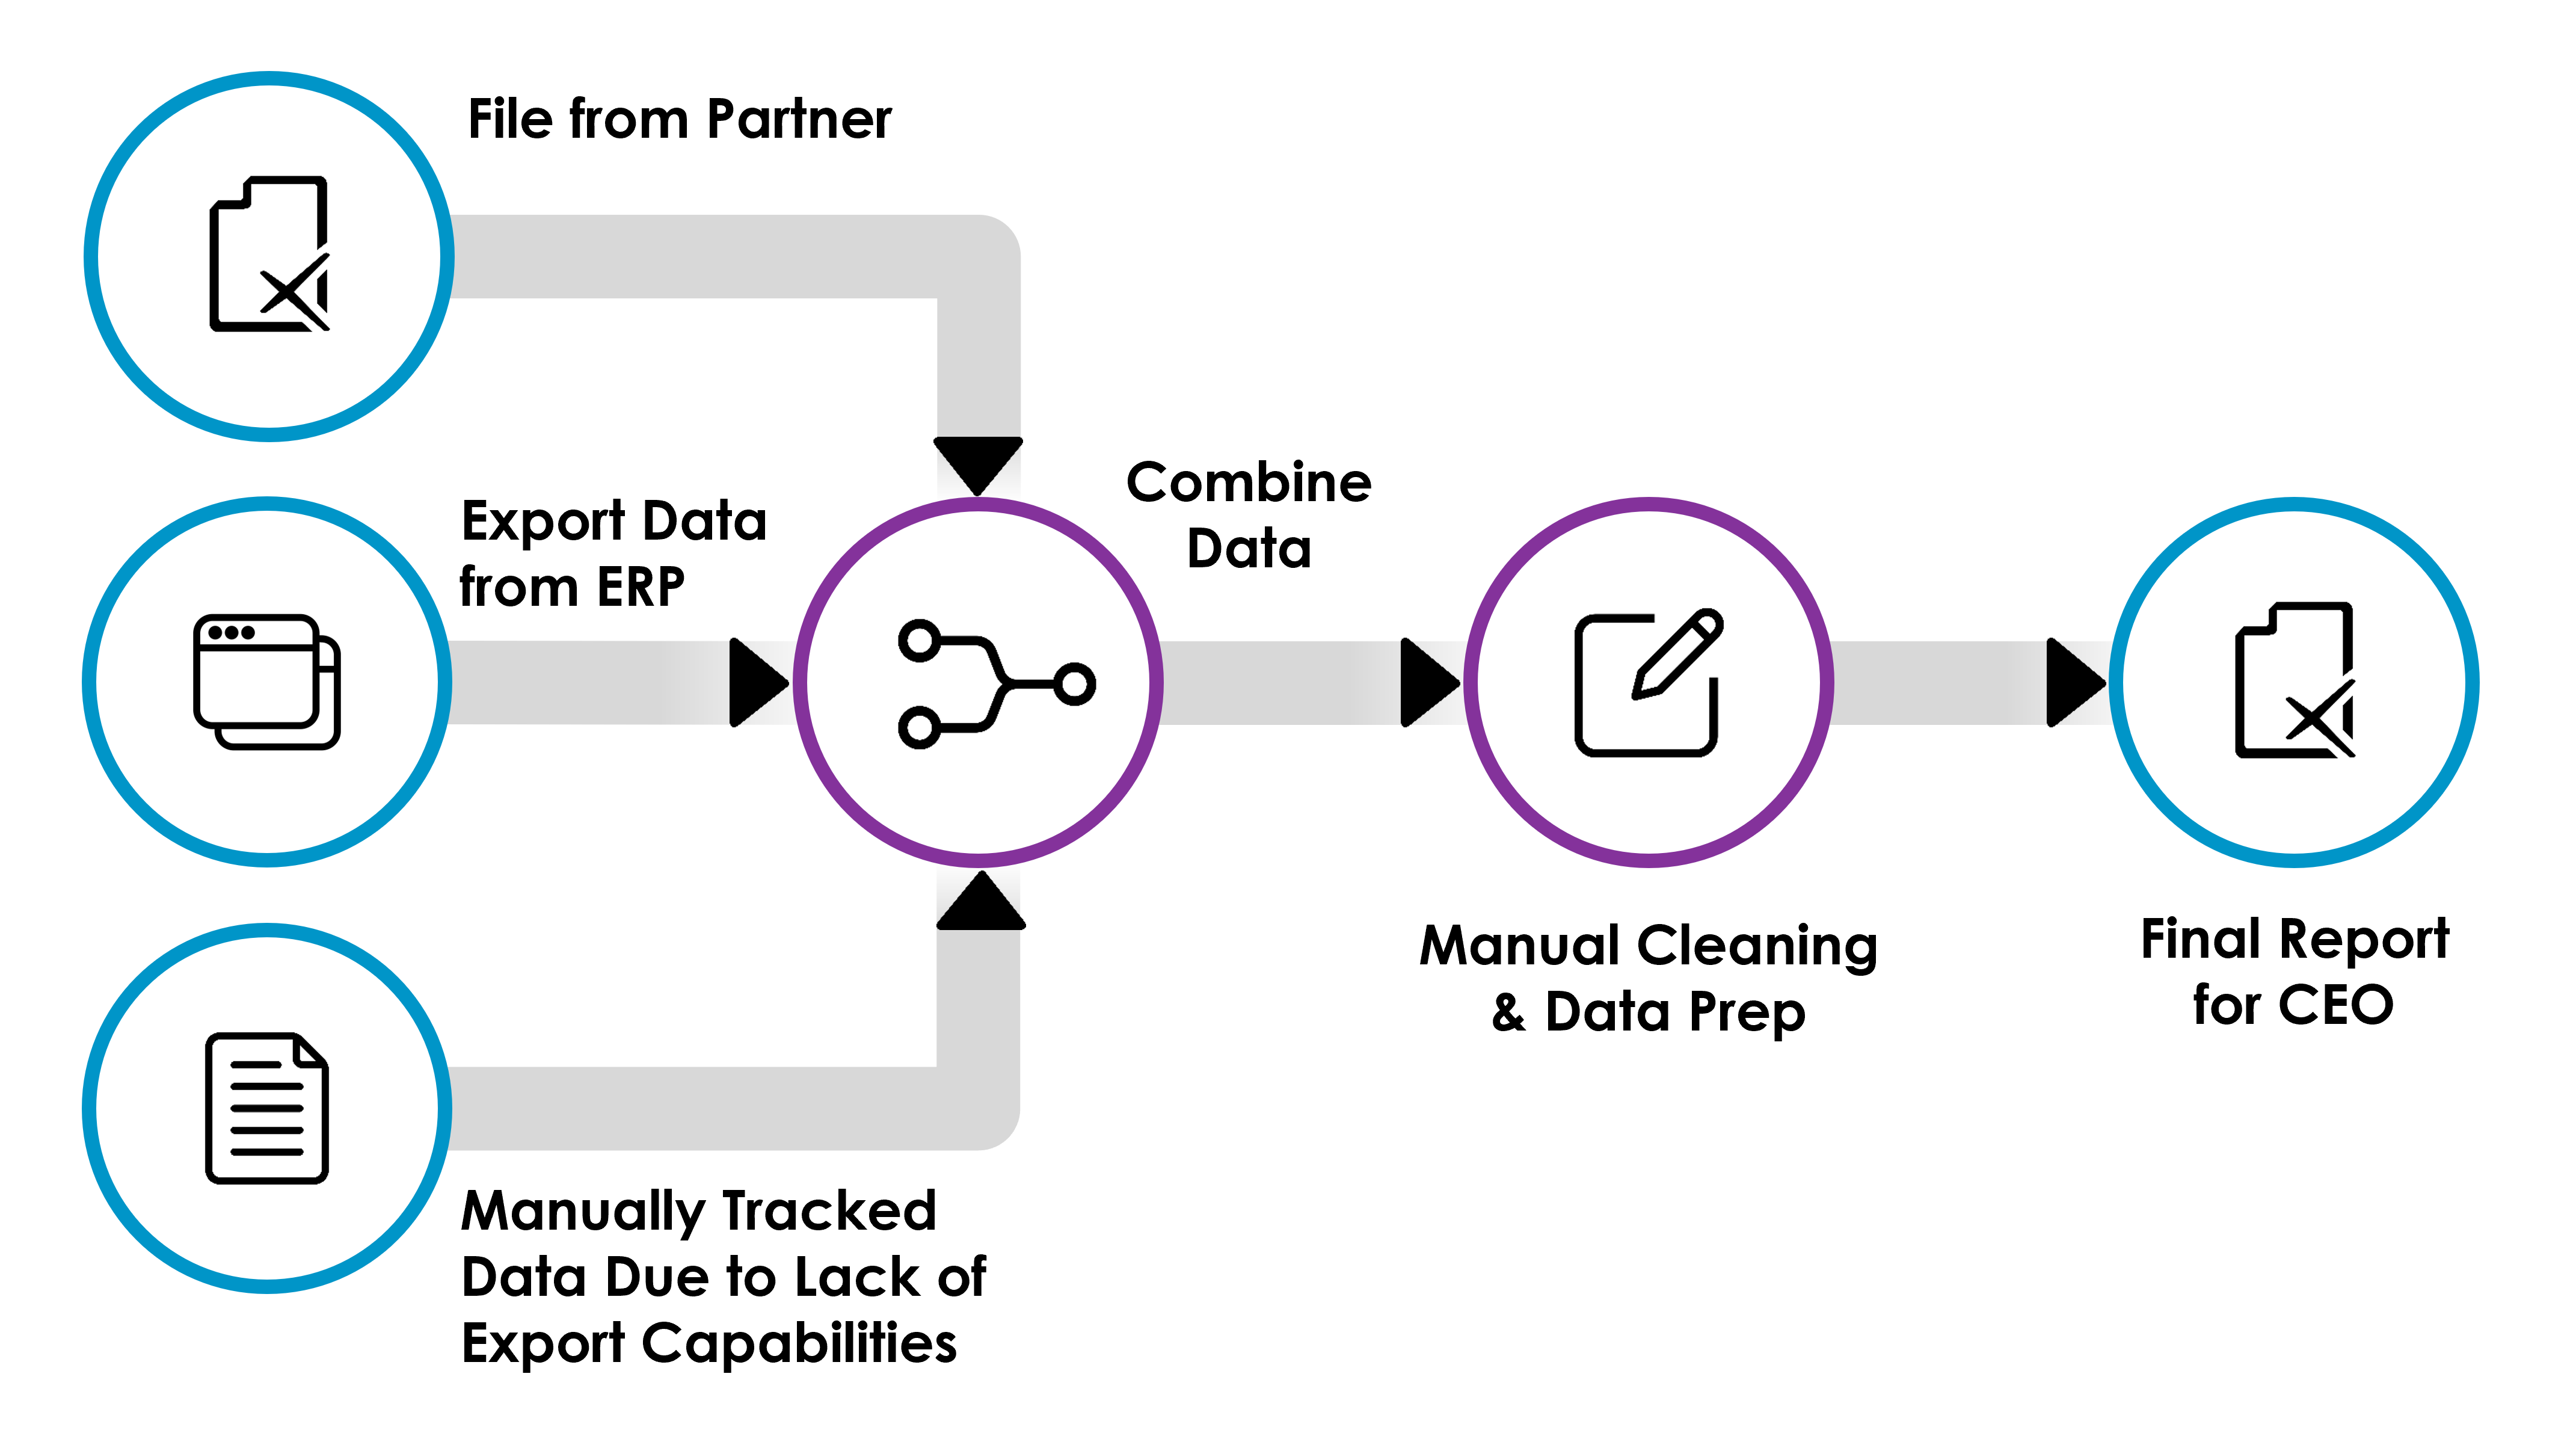
This adds another hour to your
process, making it 3 hours. But, again, it’s only twice a month, so it’s not a
big deal. And your CEO is thrilled so it’s absolutely worth it!
Complication # 3
Your CEO thinks you’re a miracle
worker and is using the report to make better decisions than ever before. She’s
been able to use it to solve dozens of strategic supply chain problems and now
wants to use it to solve more operational problems as well. She’s finding
this difficult since she only gets the report twice a month. So, she asks if
you can start providing it more frequently…ideally, every day Monday through
Friday.
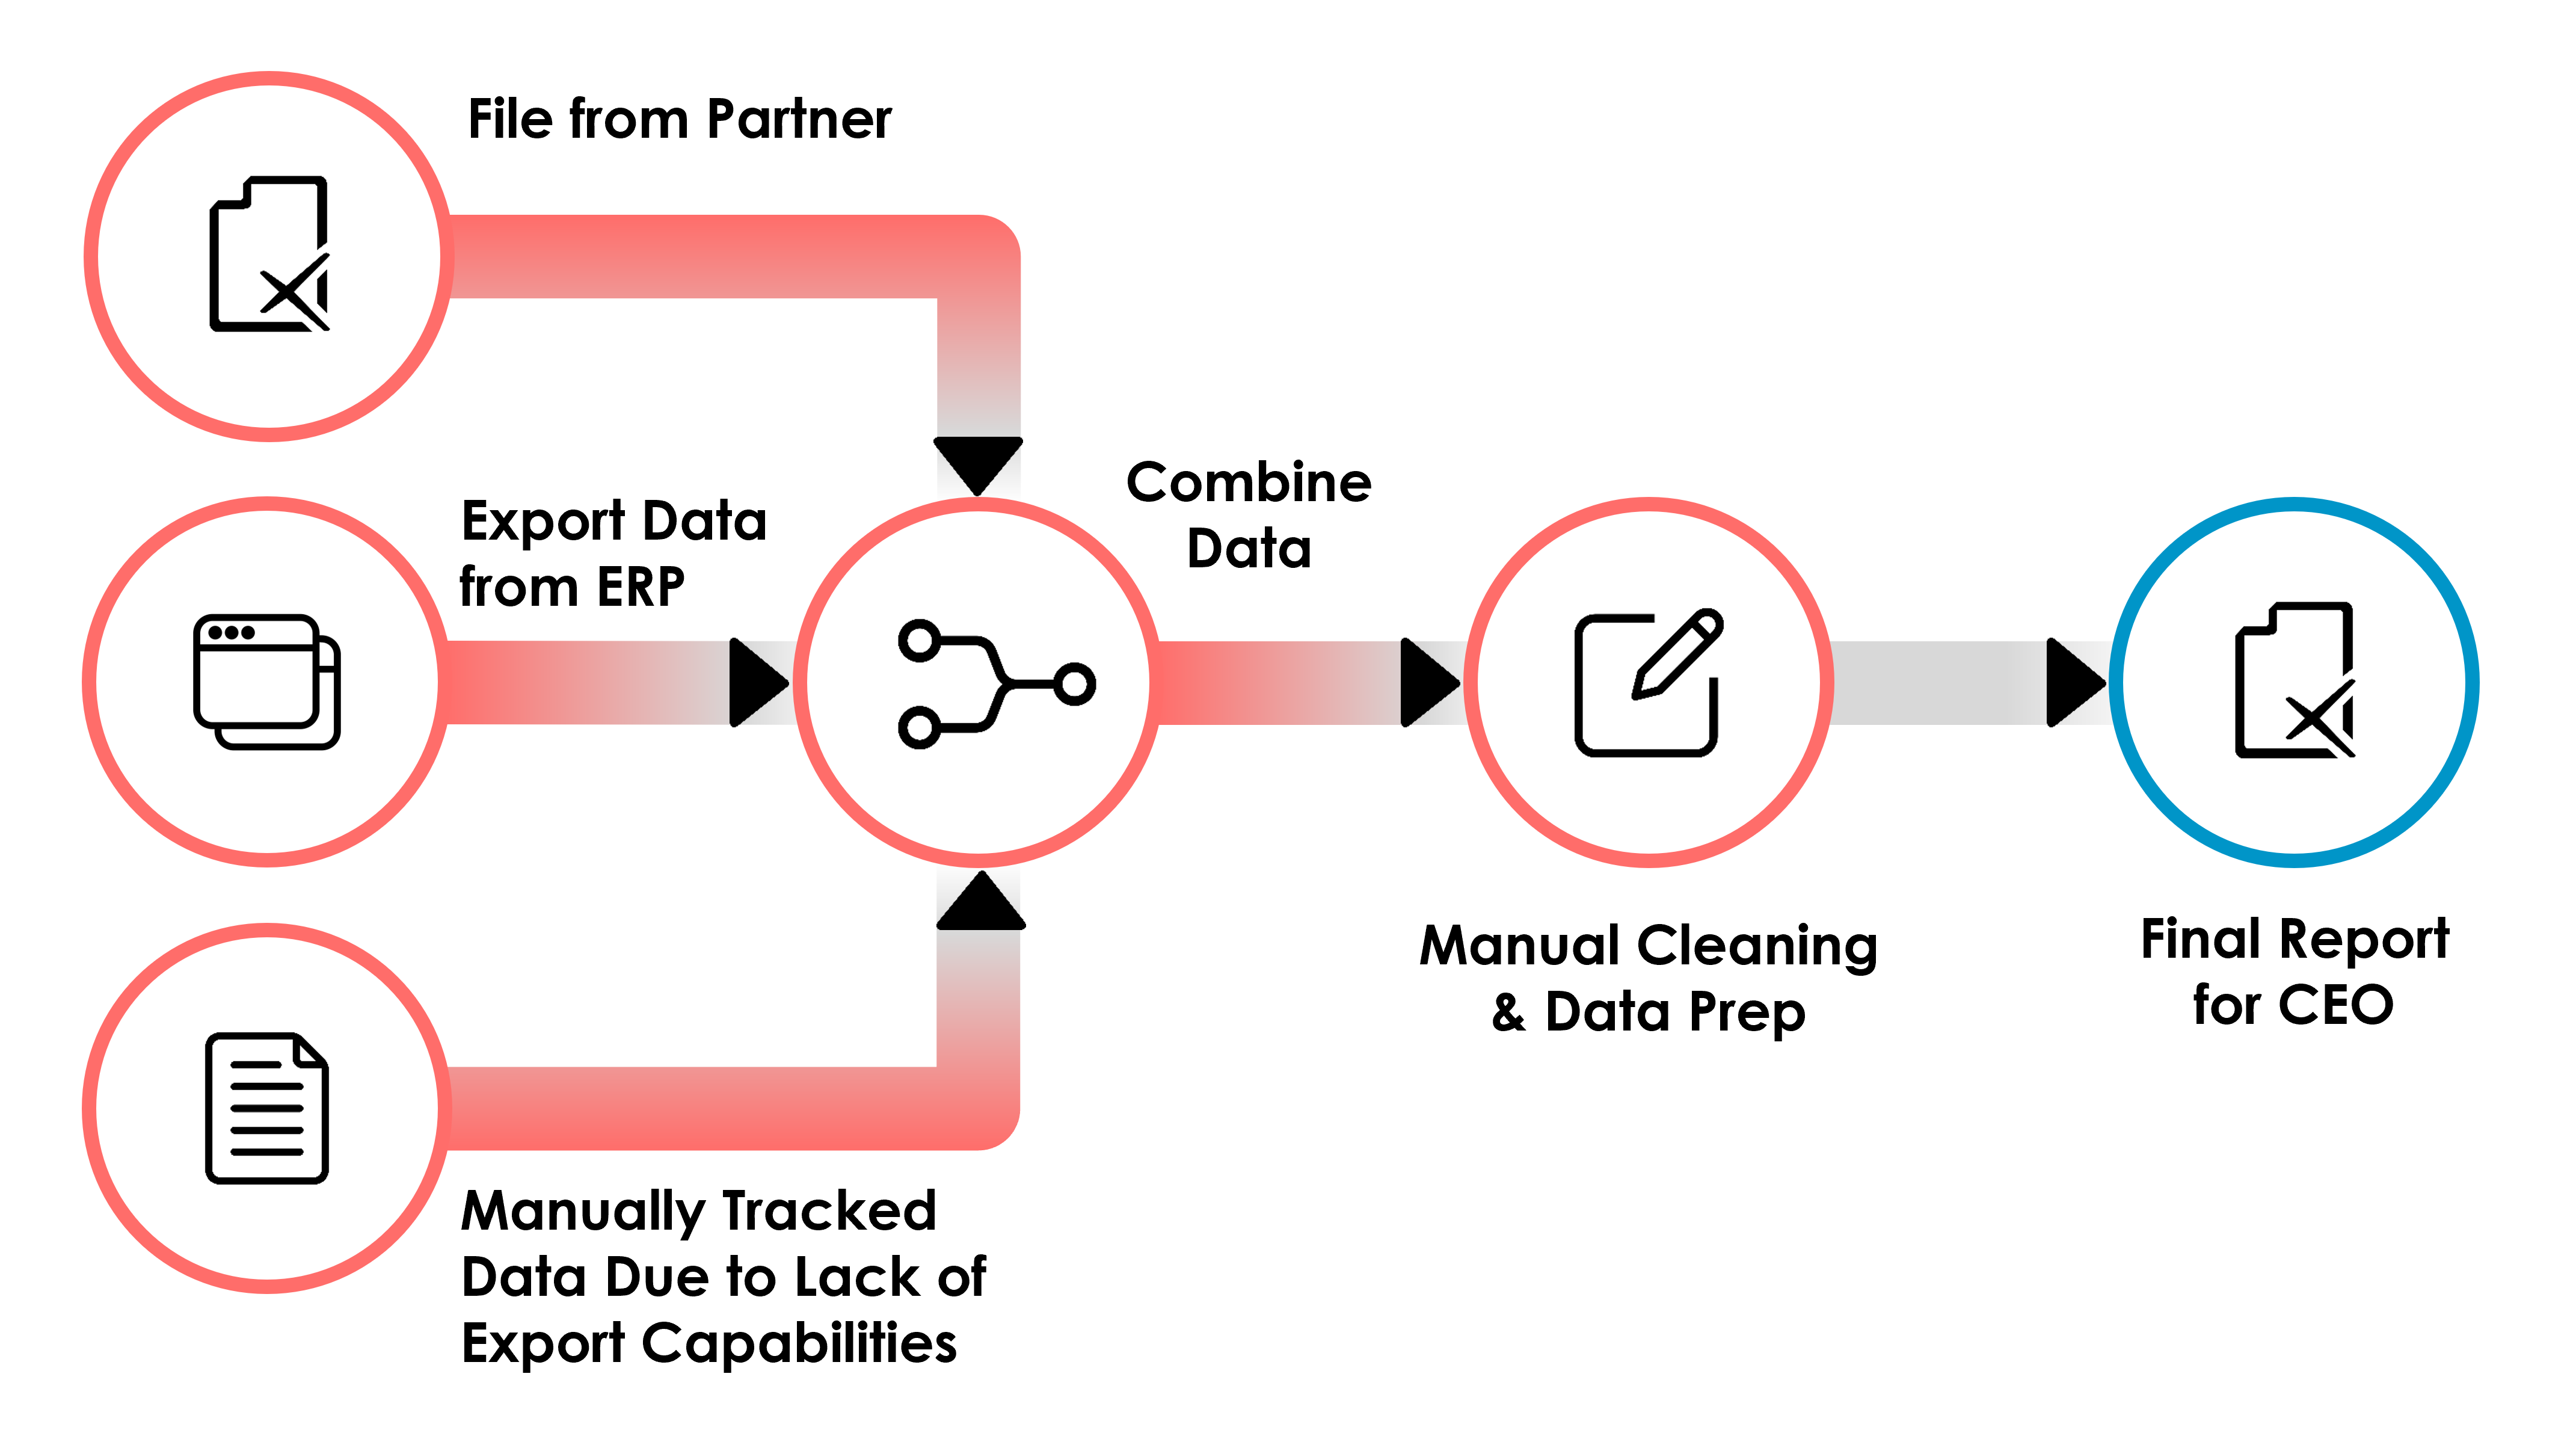
The report takes 3 hours to
create, which so far, has not been a problem since it’s only twice a month. But
can you really do it daily? That’s three hours every single day!! You’re now in
a bit of a bind, so what do you do? Unfortunately, there aren’t a lot of
options. You decide that you have little choice, so you start going to work
early to produce the report and still leave enough time for the rest of your work. Fortunately,
you were able to get the partner to provide you with a tool to extract their
data yourself, so you no longer must wait for them to send it to you—you can
just download it whenever you need it.
In the end, you’re able to
provide your CEO with the report she needs Monday through Friday of each week. It's
a pain, but she is thrilled so you're happy too. She’s making much more timely
and accurate decisions than ever before. But then your CEO runs into a problem.
The partner added new shifts on the weekend and that’s having a big impact on
their supply chain. By the time Monday comes along, the data is already stale.
So, as you might have guessed, she asks if you can provide this report to her
every day, including weekends and holidays.
So, now you are creating this
report every single day—365 days a year—and spending three hours every
day. It’s almost become your entire job. And what if you want to take a
vacation? What if you get sick? This manual process that was initially no big
deal has consumed your entire life and there’s seemingly no escape.
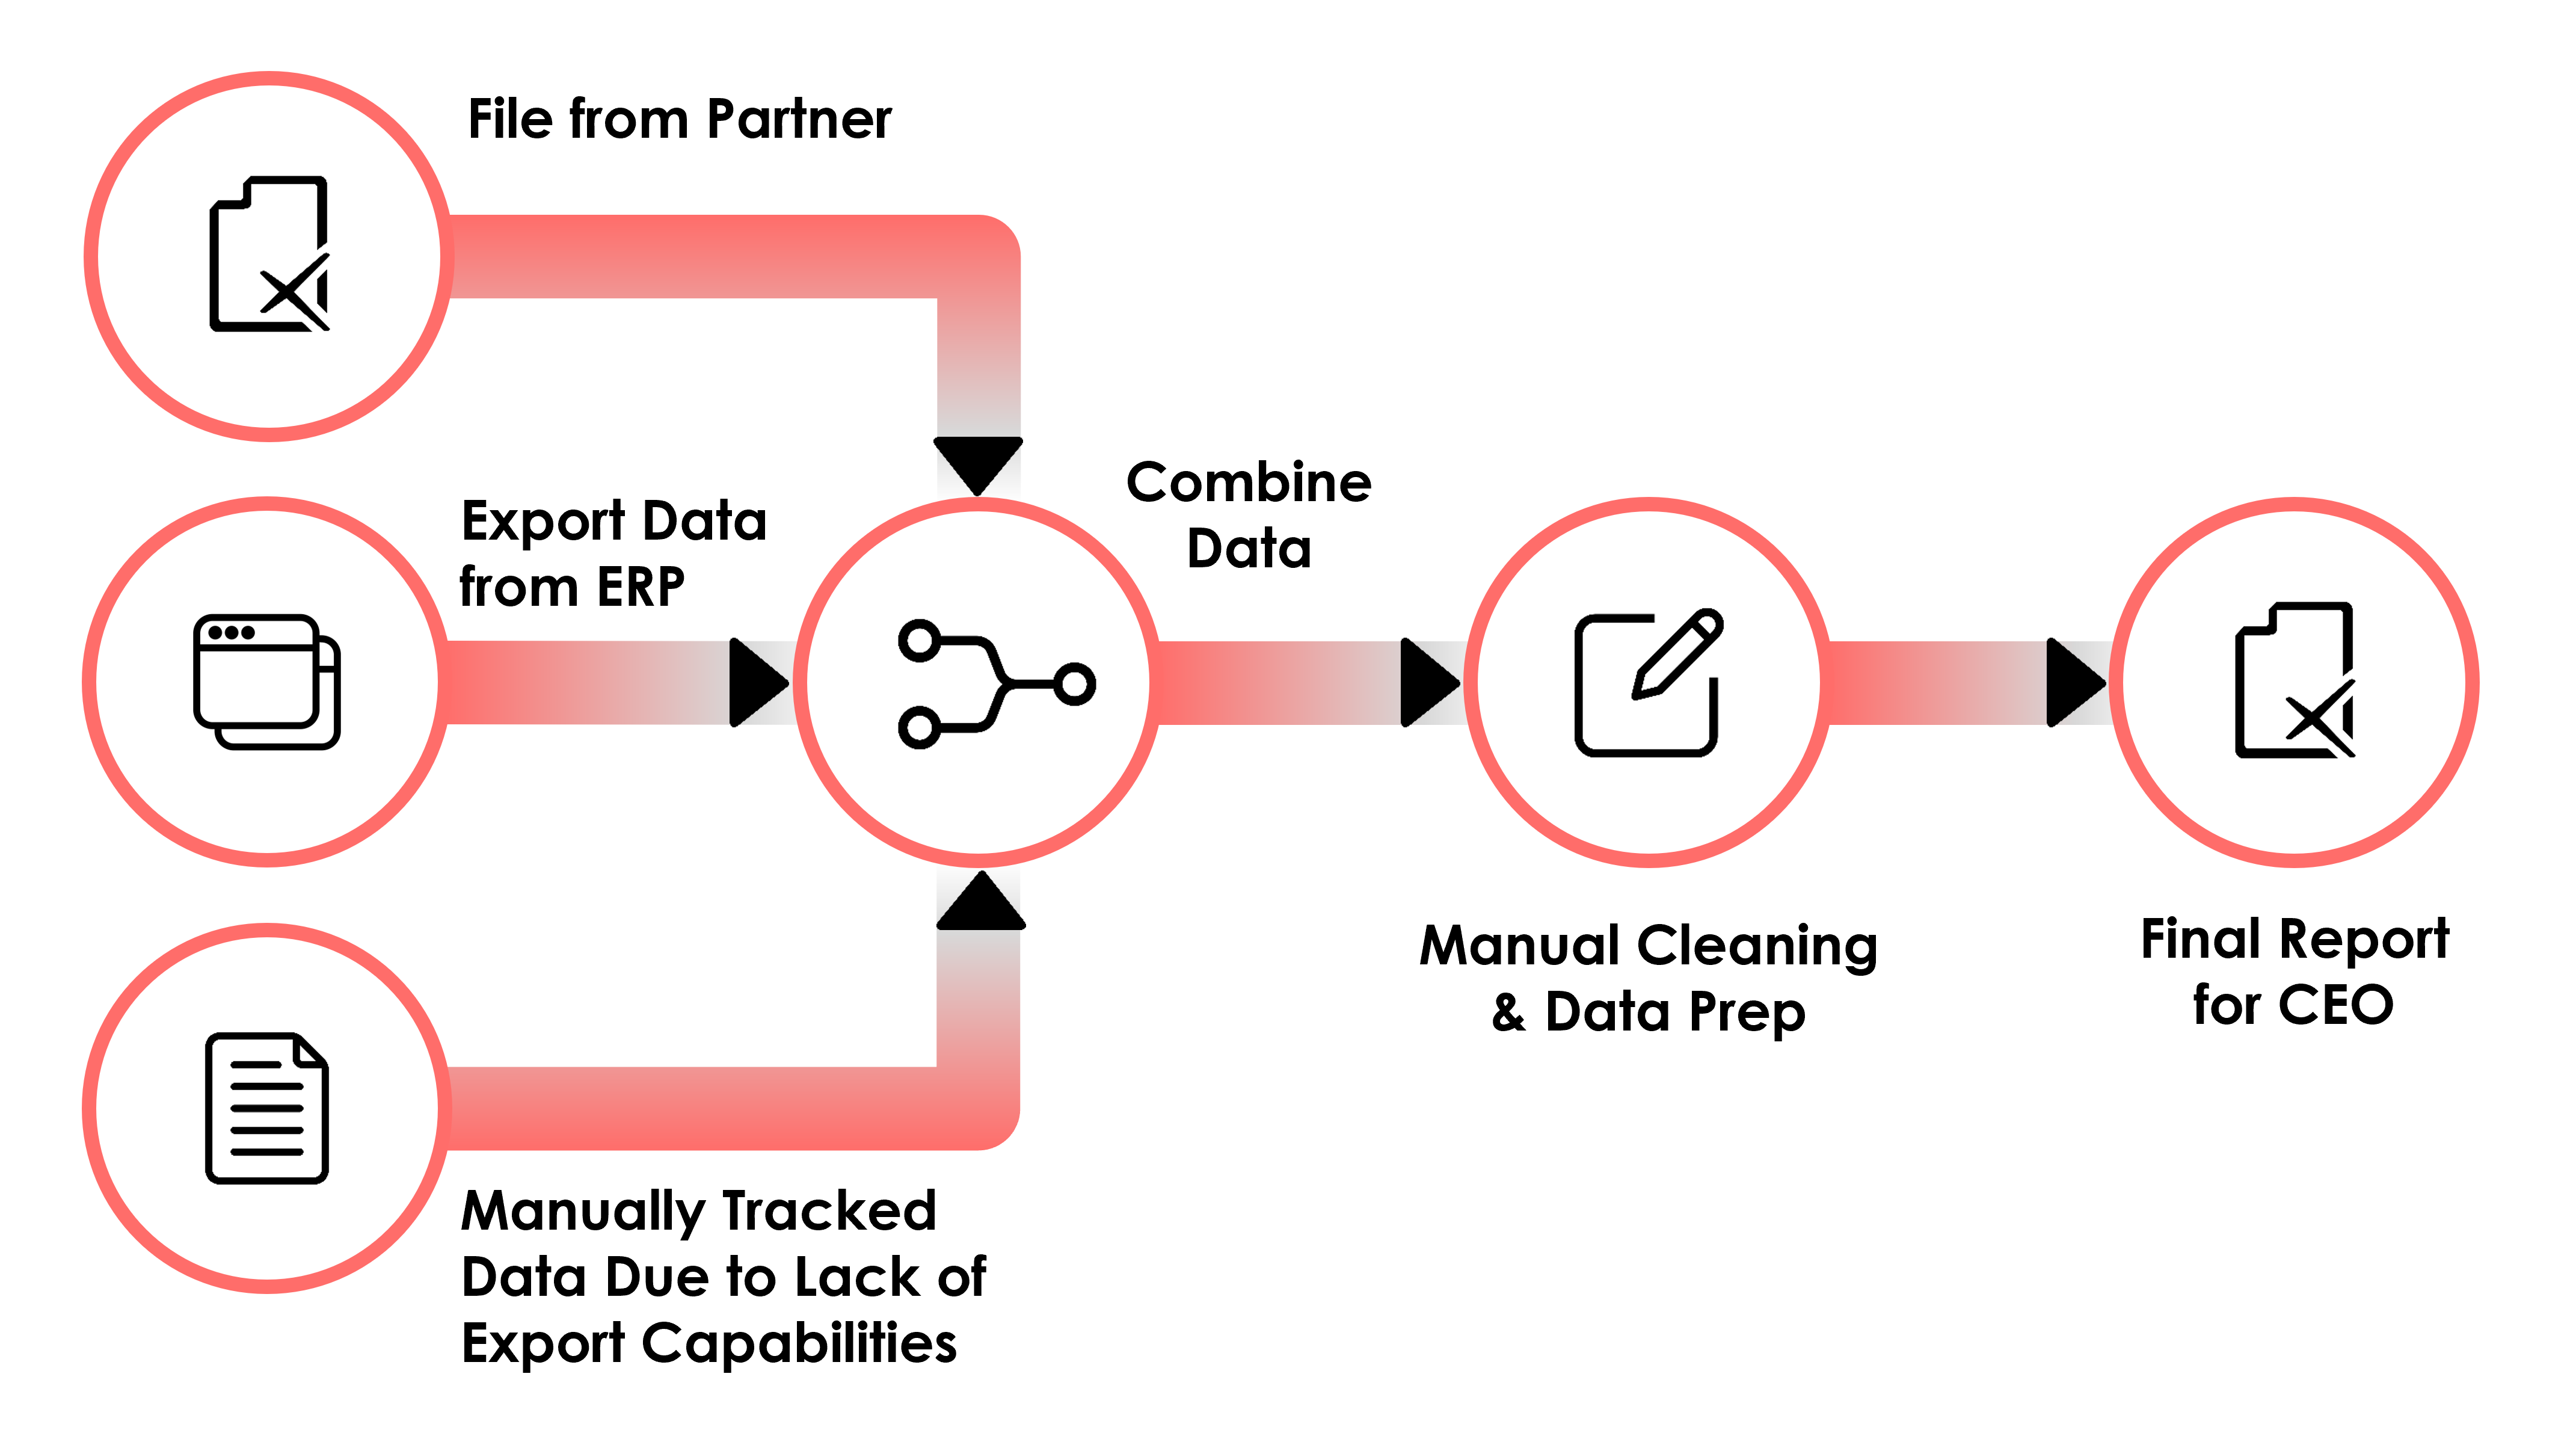
And guess what? You’re not the
only one! All the other analysts, in all the other departments, are doing the
same thing. They are pulling together data from disparate systems in order to
create similar reports for the CEO and other decision-makers. Those folks are
extracting similar data sets to you and spending the same amount of time performing
the same cleaning and combining tasks as you. And many of the
reports they create even use some of the same metrics. Are they calculating
those the same way as you? There’s a high likelihood that they aren’t, which,
at best, will lead to a lack of trust in the data from leadership and, at
worst, could lead to poor decisions based on misunderstood data.
In short, while we have been able
to use our data skills effectively, it’s led to a nightmare scenario that is
completely unsustainable for you and the organization.
A Potential Solution…
If you’ve ever worked with data,
then you know this is not just a hypothetical scenario. I’ve seen this exact
scenario play out many times in my career. Even if your organization is really
good with data, you almost certainly have at least a few pockets of this type
of manual data work. You may even be in this exact same situation right now. Or
you might be a leader who is struggling to get clean, accurate data on a timely
basis.
So, what are we to do? How can we
solve this problem?
What if, instead of manually
processing this data via exports and Excel formulas and macros, we could
introduce some automation into this process? We’d start by automating the
extracting of data from each of our source systems…
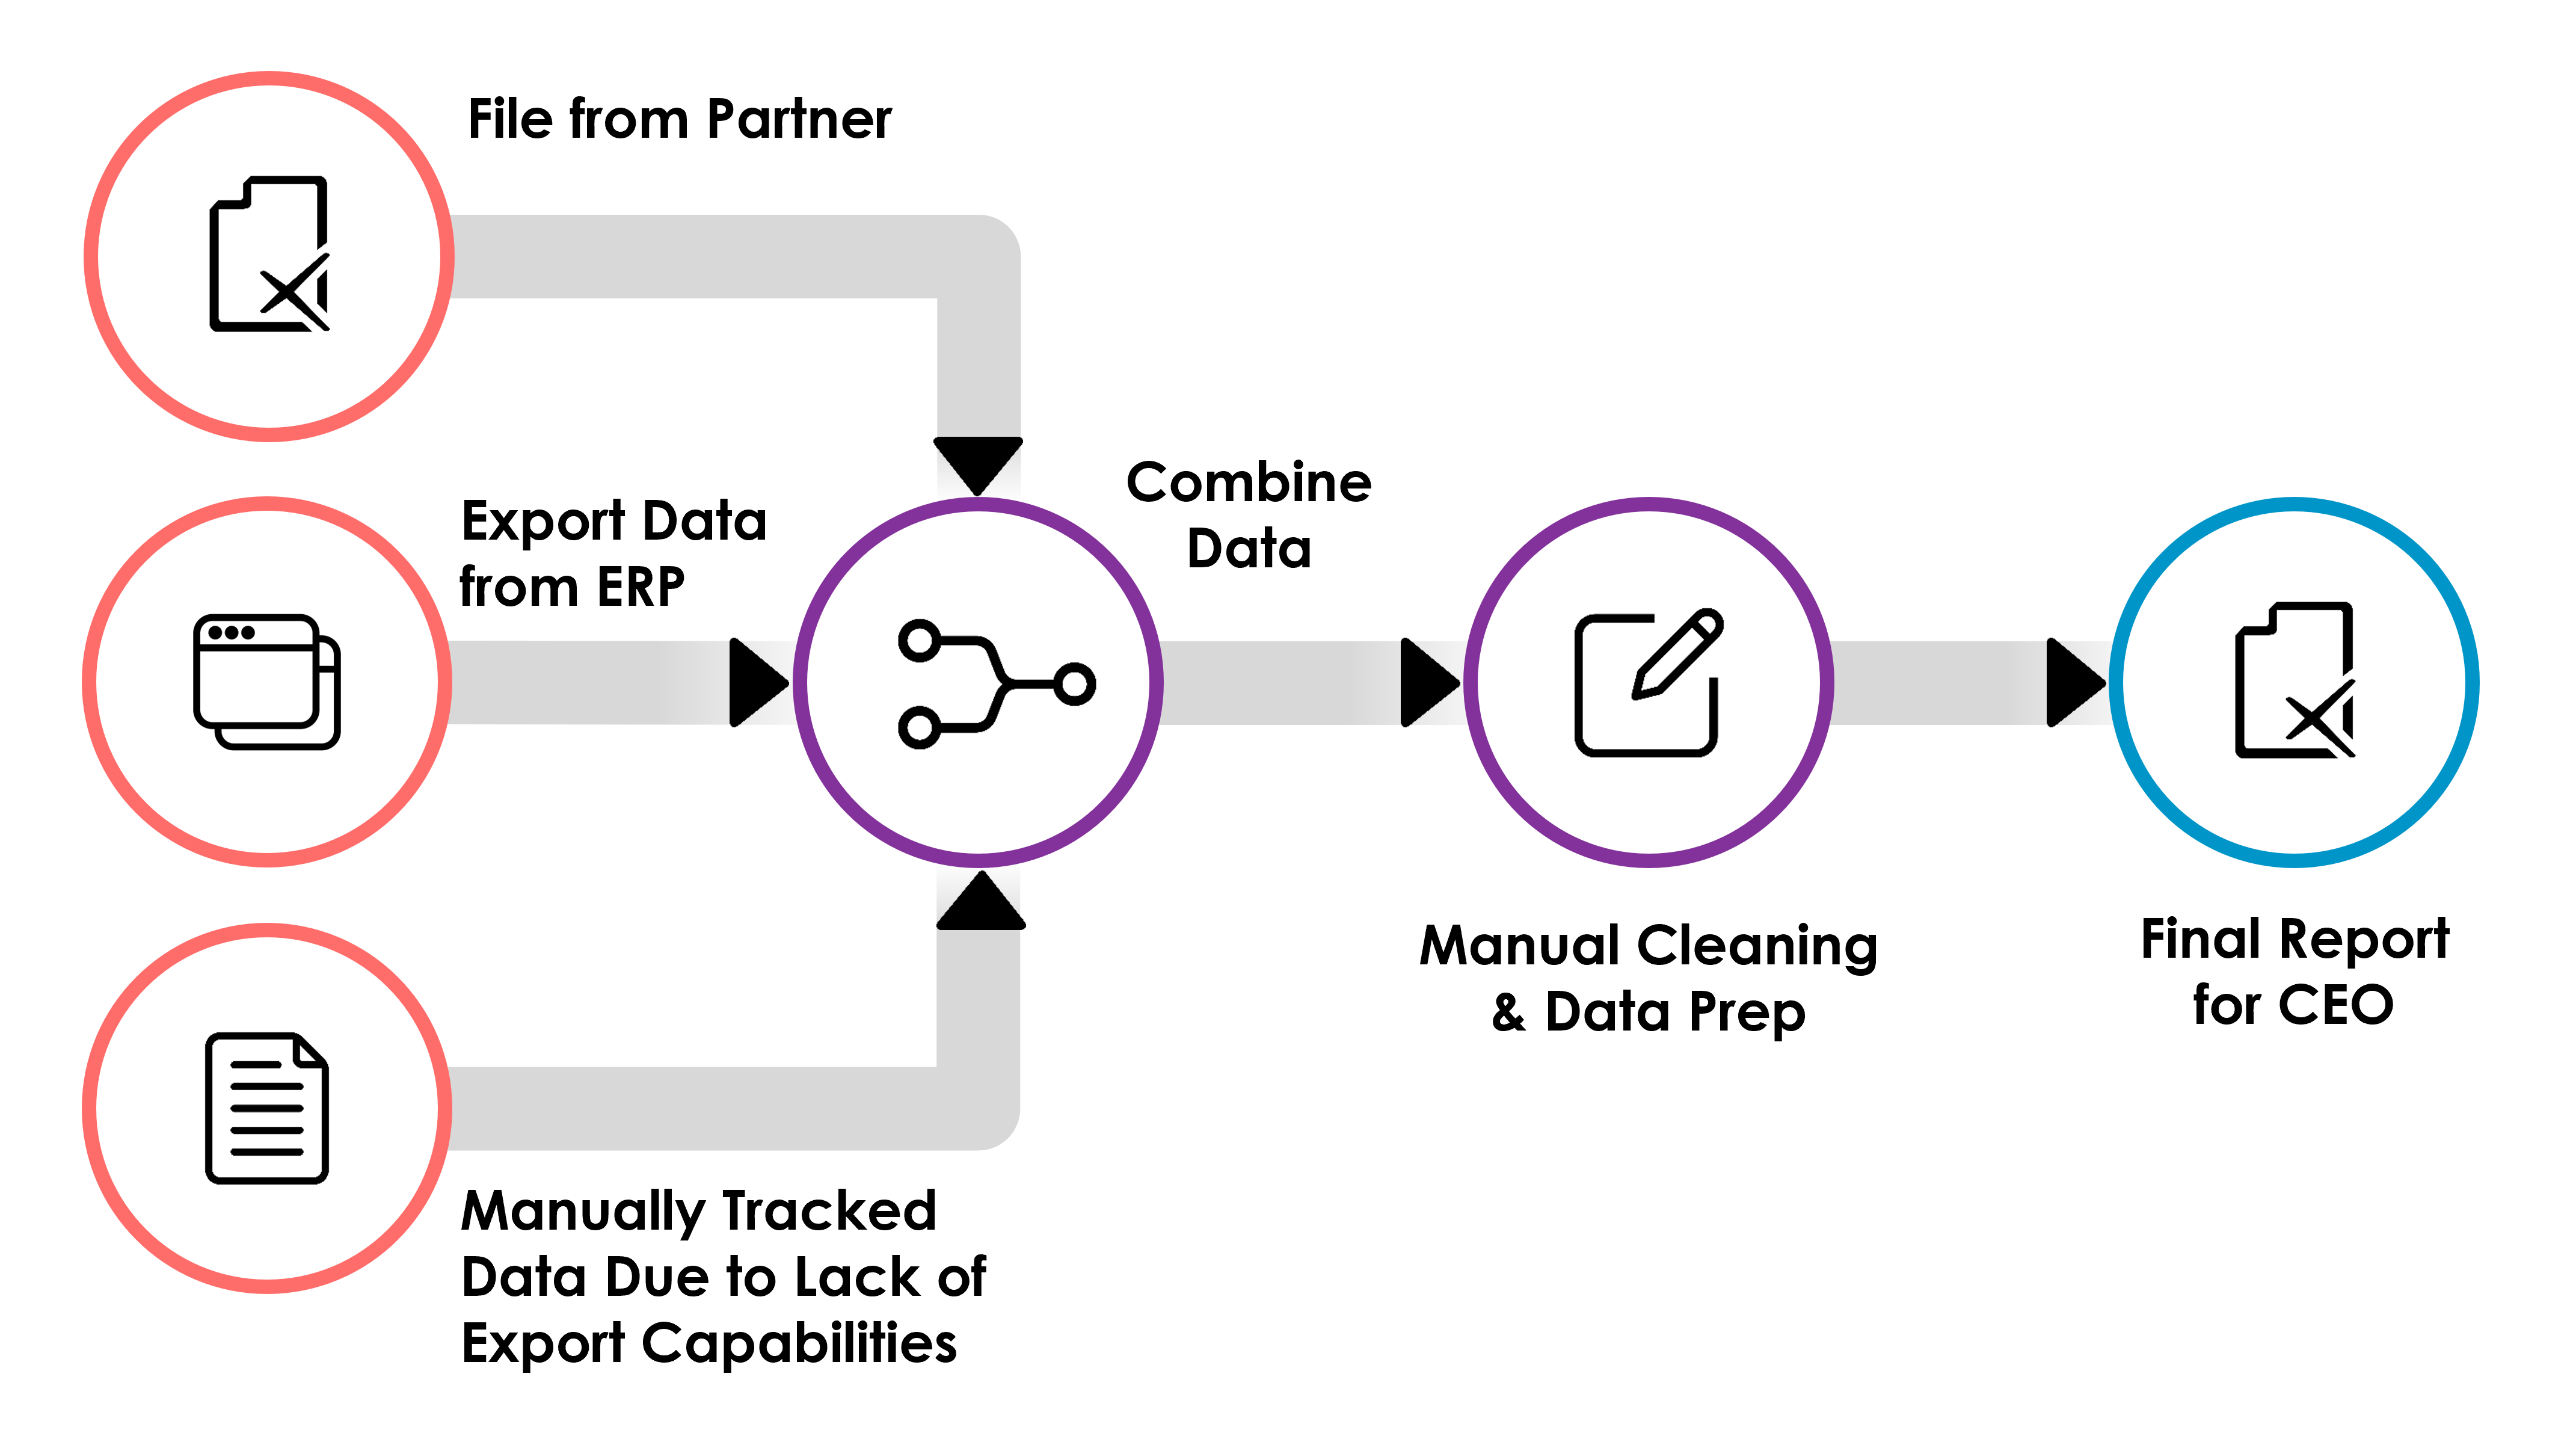
Then we’d automate the process of
combining that data together…
Next, we’d automate all those
manual cleaning and data preparation steps…
Finally, we’d automate the CEO’s report…
And, if we are feeling ambitious,
we could even schedule that report so that it’s delivered to your CEO’s email
every single morning.
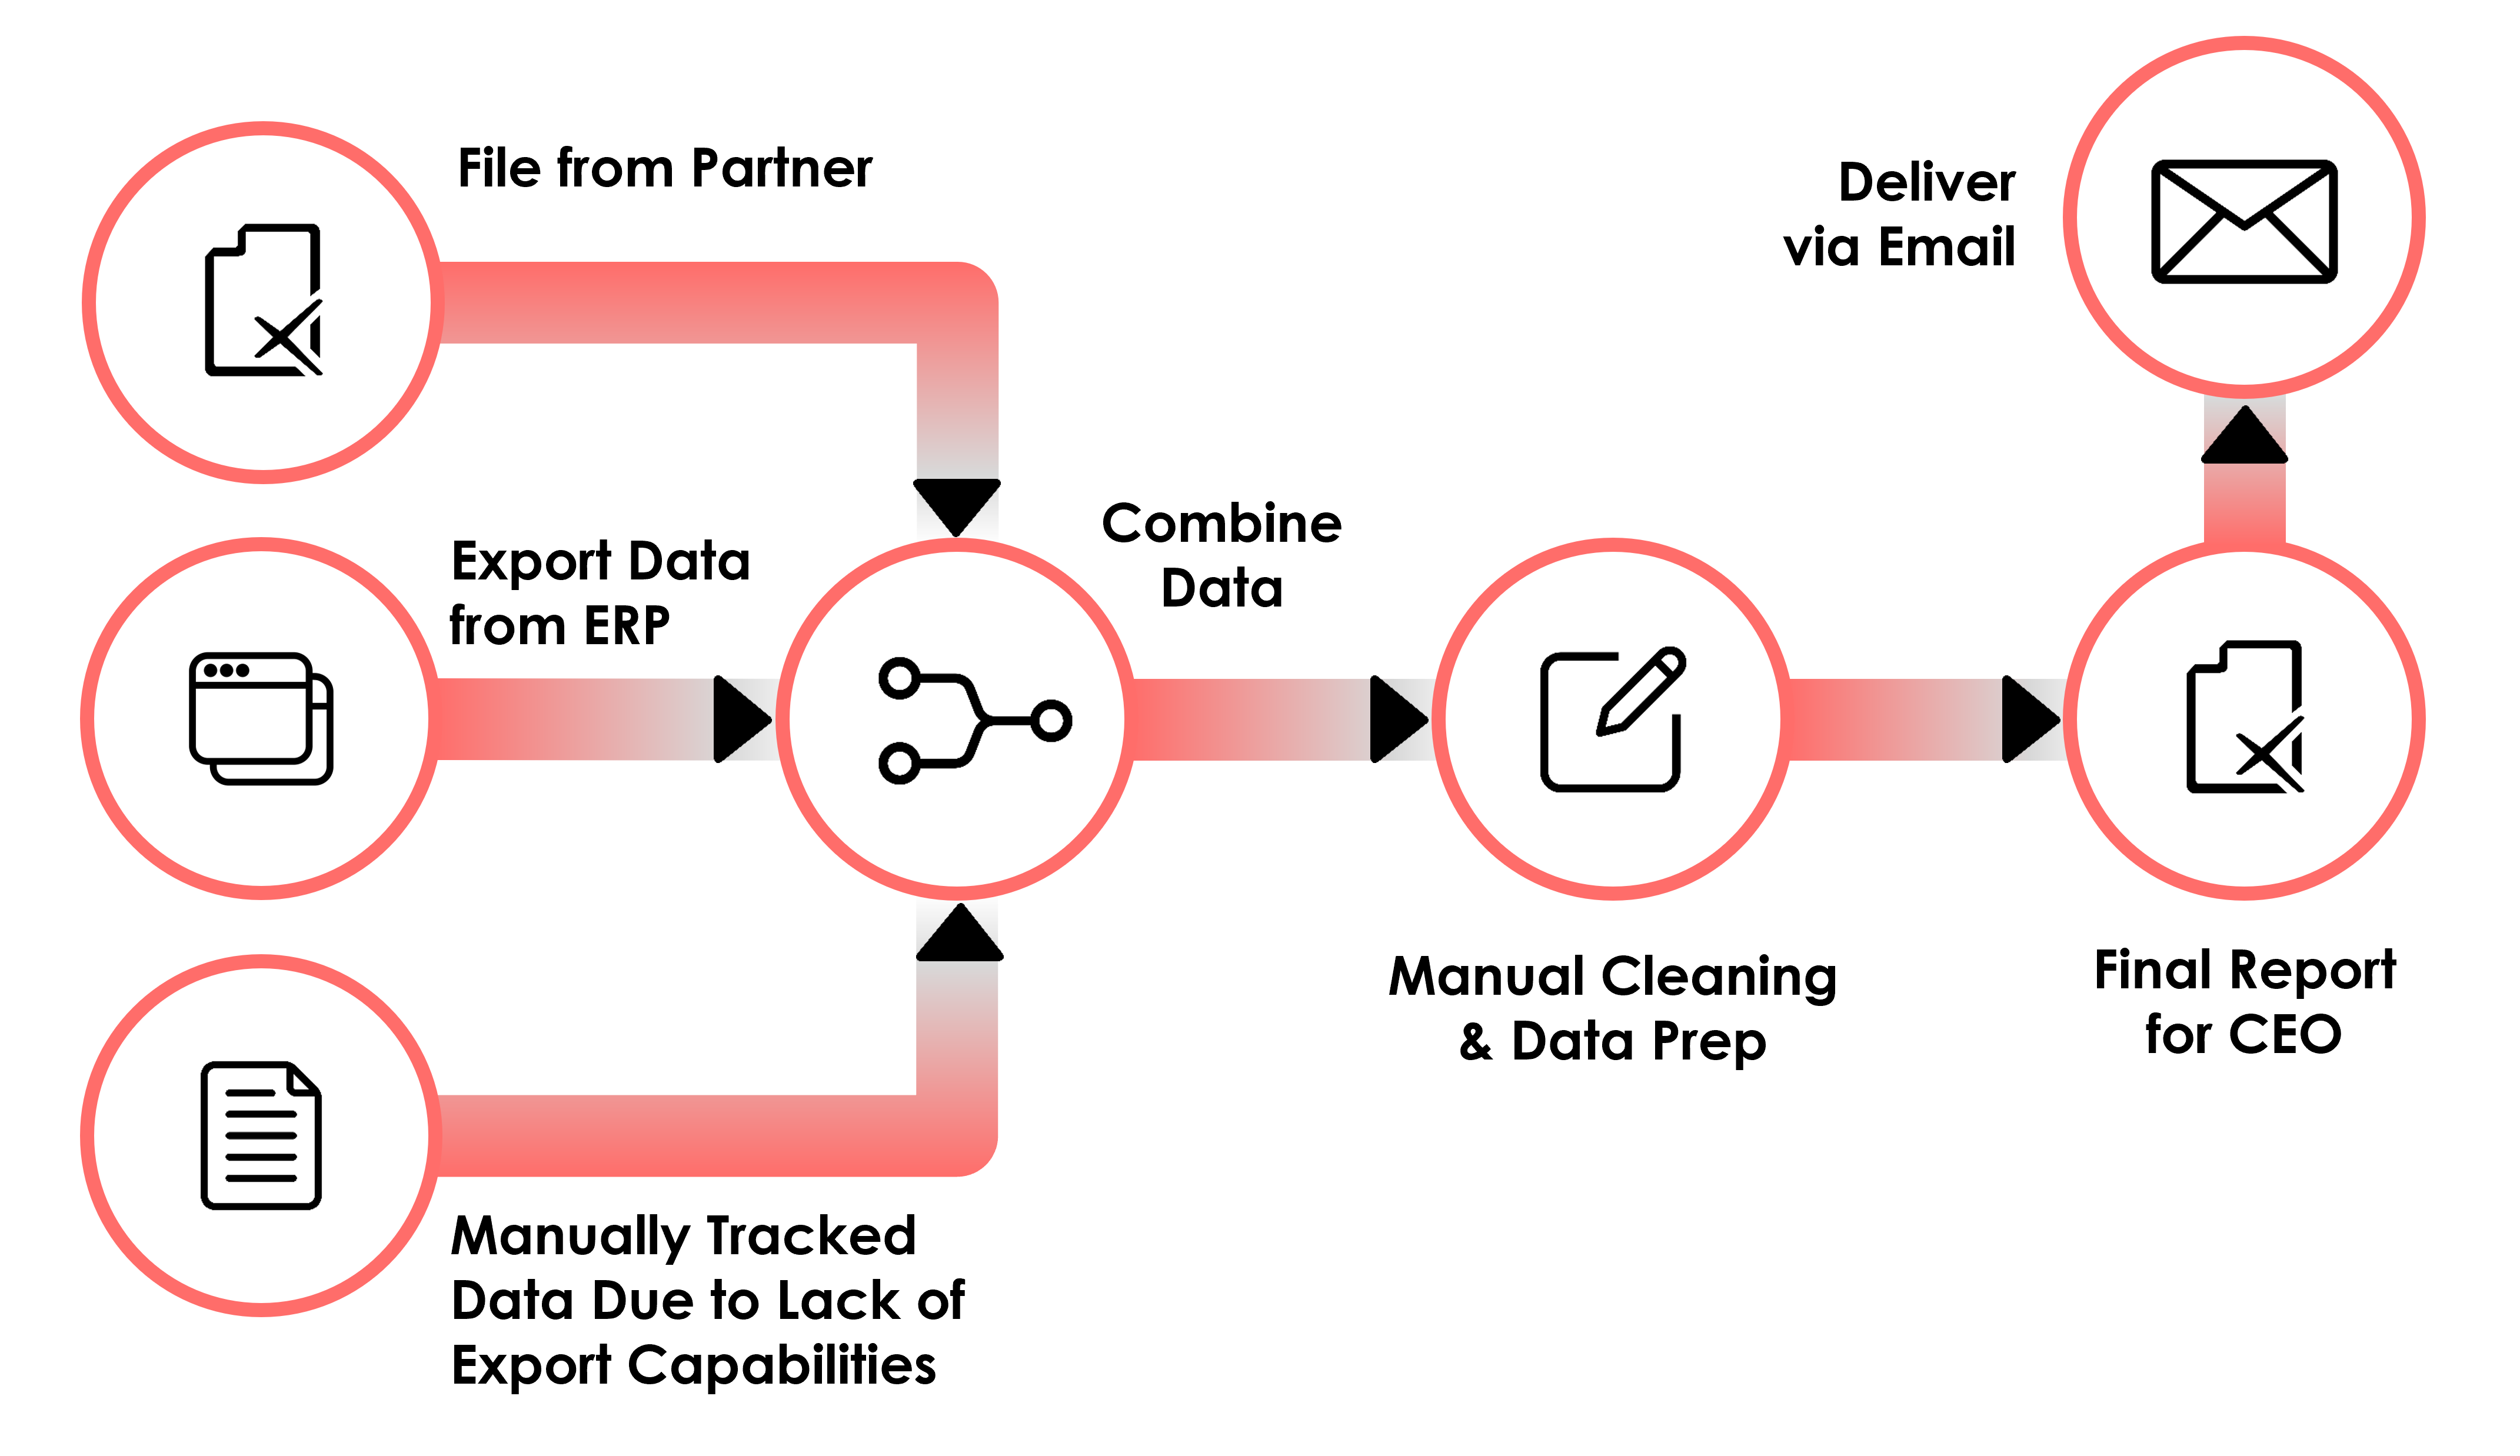
What would be the impact of all
this automation? We will have taken a process that consumes 3 hours a day, 365
days a year and converted it into a fully automated process that requires
exactly zero hours of your time. The report is waiting in your
CEO’s inbox as soon as she walks in the door every single morning. But that’s just
the beginning. This automated process delivers additional benefits as well:
1) Reuse – Anyone doing
similar processes or using similar data sets can now just use the ones you’ve created.
You have not only freed up your own time, but many others’ as well.
2) Ease of Use – If we do
this right, we can take cryptic table and field names and change them into something
people will understand. We can also combine all those relational tables into a
smaller set of tables that contain all the important information, modeled in a way
that makes it more conducive for reporting.
3) Improved Quality – Your
manual processes in Excel leave room for mistakes. Once the automated process
has been built and validated, these manual steps are removed, significantly
reducing the possibility of errors and enhancing overall data quality.
4) Improved Consistency – Metrics
and other calculations are created once and
standardized so there is no risk of people
defining things differently than others.
5) More Time – You (and
others) now have more time to focus on more value-added tasks. This leads to a
more productive workforce but also helps to reduce costs since you won’t need
to hire additional people.
Analytics Platforms
This 100% automation may seem too
good to be true, but it's not. This is why we need an analytics platform. If
you look up the term, “analytics platform,” you’ll get a variety of
definitions. When I discuss an “analytics platform,” I’m speaking quite broadly
about a unified solution of technologies that allow you to acquire, combine,
clean, and transform your data, then to explore, analyze, visualize, and report
on it. While this space is constantly changing, an analytics platform typically
consists of three primary components which could be made up of one or more
technologies. Sometimes all three come together as part of a single packaged
solution (though, in practice, I’ve rarely seen any package that does a good
job of all three needs). Those components are a Data Pipeline, Data Platform, and Business Intelligence. Let's explore each of these further.
Data Pipeline
Data pipelines allow us to
automate all the movement and transformation of data. Historically, these tools have been called ETL
(Extract, Transform, Load), but you’ll also hear the terms Data Prep,
Data Transformation, Data Pipeline, and several others. Using
the example we shared earlier, we’d use these tools to extract data from the
source systems, combine the data together, and perform the necessary cleanup
and data prep. Typically, we’d also use these tools to model the data in a way
that is easier to understand and structured to be more conducive for analytics.
The combined, cleaned, conformed, modeled data is then pushed into some sort
of data platform (see the next component). Unfortunately, many of these tools
are not yet capable of reading data from the APIs provided by many web and
cloud-based platforms, so other tools or programming languages, such as Python,
are often integrated to provide this capability.
Data Platform
“Data Platform” is a generalized
term to describe some sort of platform to store the data processed by a data
pipeline. Historically, data warehouses have been the primary way to store data
for analytics purposes. These are best for handling highly modeled and
structured data. For this reason, they are great for providing a “single source
of the truth” to business users. However, they don’t do a good job of handling
the explosion of unstructured and semi-structured data. To deal with this, we’ve
seen the growth of data lakes or technologies that combine data warehouses and
data lakes into something called “data lakehouses.” But regardless of the
technologies used, the data platform provides a place where you can bring
together data and make it available to business users, analysts, and data
scientists.
Business Intelligence
So, now that we have clean, reliable,
easy-to-understand data, what do we do with it? That’s where business
intelligence (BI) tools come in. Business intelligence tools provide an
intuitive interface for analyzing, reporting, and visualizing data. Traditional
BI platforms tended to be somewhat bulky and not particularly easy to use. They
also focused much more on simple “list” reports or crosstabs. Modern
platforms, such as Tableau, tend to focus more on visual analytics since
visualizing data is much more effective for identifying insights than raw data. Almost
all BI tools now have the capability to create charts, dashboards, infographics,
as well as more traditional types of reporting. They generally allow you to
share reports or dashboards with end users via several different methods, as
well as provide powerful tools for exploratory analysis and data mining.
Because they are usually built with intuitive interfaces (some more than
others), they enable virtually anyone in an organization to use them—a concept referred
to as “self-service.” Self-service analytics means that subject matter experts
can analyze their own data and find their own insights to inform better
decisions. While it’s typical to have a core team of experts, self-service
tools allow the work to be distributed across the enterprise, reducing bottlenecks.
Modern BI platforms have also begun to integrate advanced analytics—machine
learning, artificial intelligence, natural language processing, etc—in order to
provide increasingly powerful toolsets.
Automation, Automation, Automation
What all these components have in
common is automation. Once a data pipeline is created, we can simply schedule it
to run on a regular basis. When it fails, we’ll get notified and can address
any problems, but most of the time, it just runs on its own—completely unattended.
We pretty much just schedule it and forget it. Up-to-date, clean, modeled
data then lands in our data platform, ready to be used by the business
intelligence tool(s). And the BI platforms are automated as well. Once fresh
data is available, reports automatically use that data. You can even schedule a
report to be emailed on a specific schedule or configure alerts when a metric
reaches some target. The automation possibilities are endless.
Recap
So, why do you need an analytics
platform? And why is Excel not enough? The simple answer is automation. By
implementing the key components of an analytics platform, we’re able to
automate previously manual processes. And that automation provides us with many
other benefits including the ability to reuse the data created, data that is
easier to use and access by business users, improved data quality, improved
consistency, and countless hours of saved time, allowing you and others to
focus on more value-added tasks.
So, if you or others in your
organization are spending a lot of time manually extracting, combining,
cleaning, modeling, and reporting your data, please please please consider a
move to a data analytics platform. I promise that you—and your organization—will
be glad you did!
Ken Flerlage,
August 21, 2023


Great post!
ReplyDelete