
A Guide to Embedding Tableau # 3: The Embedding Playground

In my previous two blogs on the topic of embedding, I introduced you to the basics of embedding, then shared several embedding examples. My goal was to make embedding easier for non-programmers. Little did I know that, while I was writing these blogs, Tableau was working on a tool to make embedding easier for everyone. This new tool is the Embedding Playground. It went live on August 1 and is now available to everyone wanting to embed Tableau workbooks. The Embedding Playground provides a simple, largely point-and-click interface to build your embed code. In this blog, I’m going to walk you through the tool. I’ll show you the basics of how to use it and then we’ll apply it to the three examples I’ve provided previously. Finally, I’ll show you how to extend the tool by creating powerful interactions.
Why Embedded
Analytics?
In the first blog, I briefly touched on the what and why of embedding
and embedded analytics, but looking back, I fear that I wasn’t quite as
thorough as I should have been. Embedding is a powerful tool in analytics, so
I’d like to take a moment to dive a bit deeper into why it’s important and
provide a handful of use cases.
Embedded analytics allows us to provide powerful decision-making
analytics tools to our users—be they internal or external—by providing those
analytics in the flow of their work. In many cases, this is done in such a way
that users don’t know (or even care) that they are working with Tableau because
the workbooks leverage standard branding and design elements, personalization,
integrated security has been enabled, and interactions have been created
between the app and the visualizations themselves. Ultimately, the embedded
analytics look, feel, and operate just like everything in the application.
By using Tableau to provide these embedded analytics, you’re able
to leverage your investment in Tableau’s enterprise analytics platform. This
means you can leverage existing skill sets, leading to faster time to market
and an ability to more quickly react to your customer’s requirements.
You also get the full power of the Tableau platform, including real-time
analytics, enterprise-level security, and so much more. And you can even
provide people with self-service using embedded authoring!
Use Cases
The use cases for embedded analytics generally fall into two broad
categories—external and internal.
You
would build external embedded analytics to provide
analytical content to your customers, prospective customers, partners, or
other constituents. In many cases, this type of embedding would be done via an
application or web portal that you provide to your constituents. In such cases,
the number of users may not be large, but the impact
is incredibly high, providing decision-making tools at users’ fingertips. Organizations might also embed public analytics into their website to
attract prospective customers or provide data for the public good. Here are a
few examples of external embedding:
1) A bank that wants to provide real-time analytics on each
customer’s spending within their app and/or online banking platform.
2) A software-as-a-service (SaaS) platform that wishes to provide
analytics to users across the platform.
3) A university that wishes to provide prospective students with
information about graduation and retention rates.
4)
A governmental organization that shares public health information (such as
COVID infection data) with citizens.
Internal embedded analytics are generally focused on employees
within an organization. Like external, they are intended to provide critical decision-making
tools to users in the flow of their work. Users don’t have to close out of one
system and log into the BI platform to get access to that information—it’s
right there when they need it. This helps to increase data literacy and create
a data-informed culture across the organization. Some examples of internal
embedding are:
1) A company that wants to embed some analytics into its
internal ERP system.
2) An employee HR portal that provides employees with useful
analytics about pay, PTO, etc.
A Tour of The
Embedding Playground
So now that you have a more complete understanding of what
embedded analytics is and how it’s used, let’s take a look at the Embedding
Playground. The tool allows you to quickly generate the code needed to build
embedded content. As I’ve addressed in previous blogs, writing this code is not
for the faint of heart. It requires someone with knowledge of HTML and
JavaScript as well as knowledge of Tableau and the Tableau
Embedding API v3. Unfortunately, there aren’t a lot of those people out there. The
Embedding Playground tries to make it easier for us non-programmers to embed
our content, but it also simplifies the lives of programmers by giving them a
great head start.
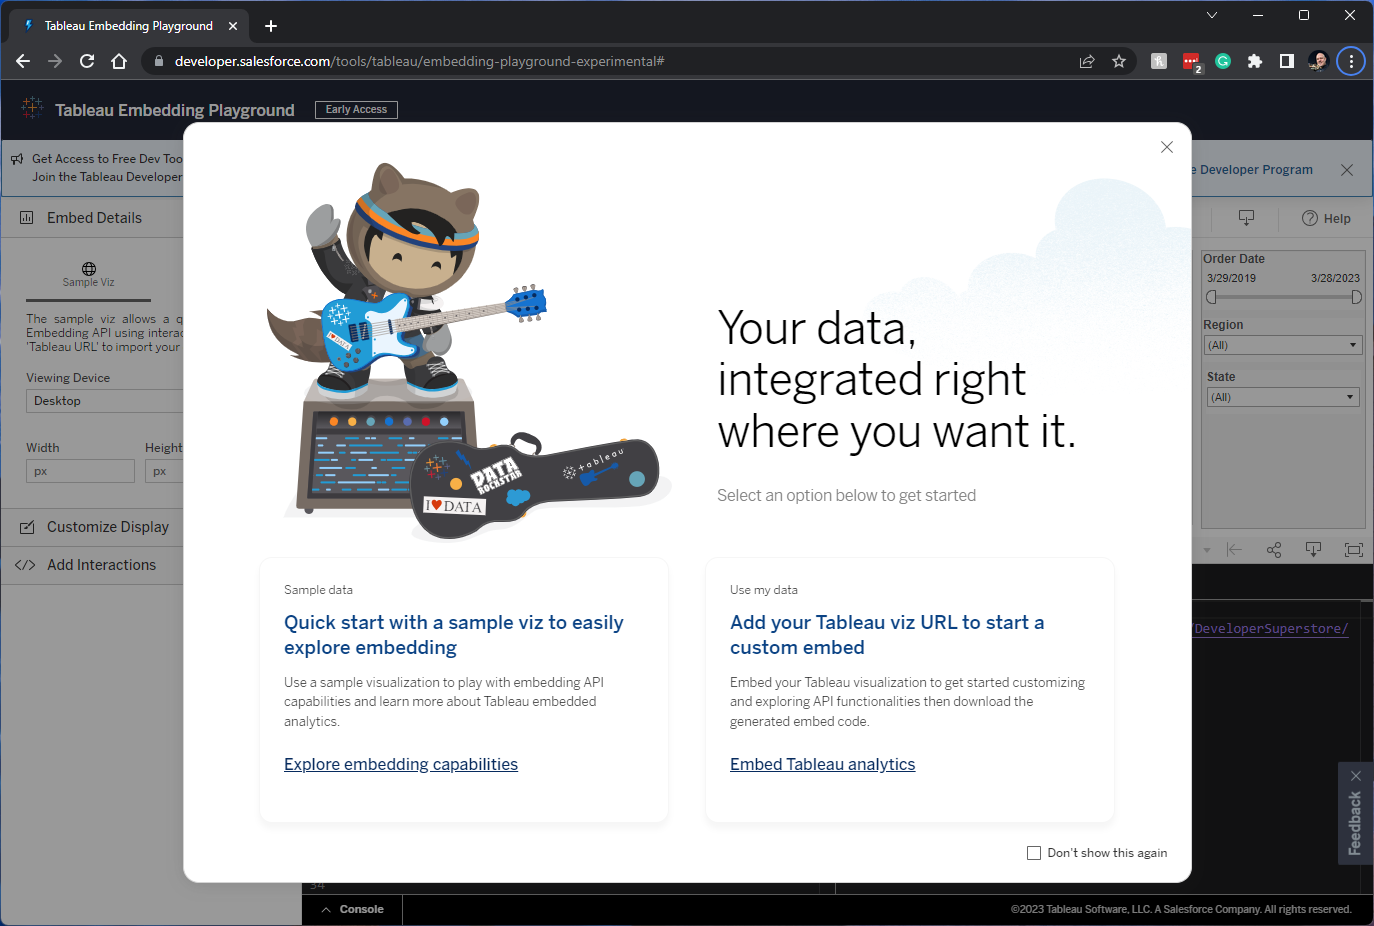
When you first open the tool, you’ll be greeted with a start
screen that will guide you through the basics. You can choose the quick start
which will use a sample workbook and allow you to explore the options. Or you
can choose to use your own URL.
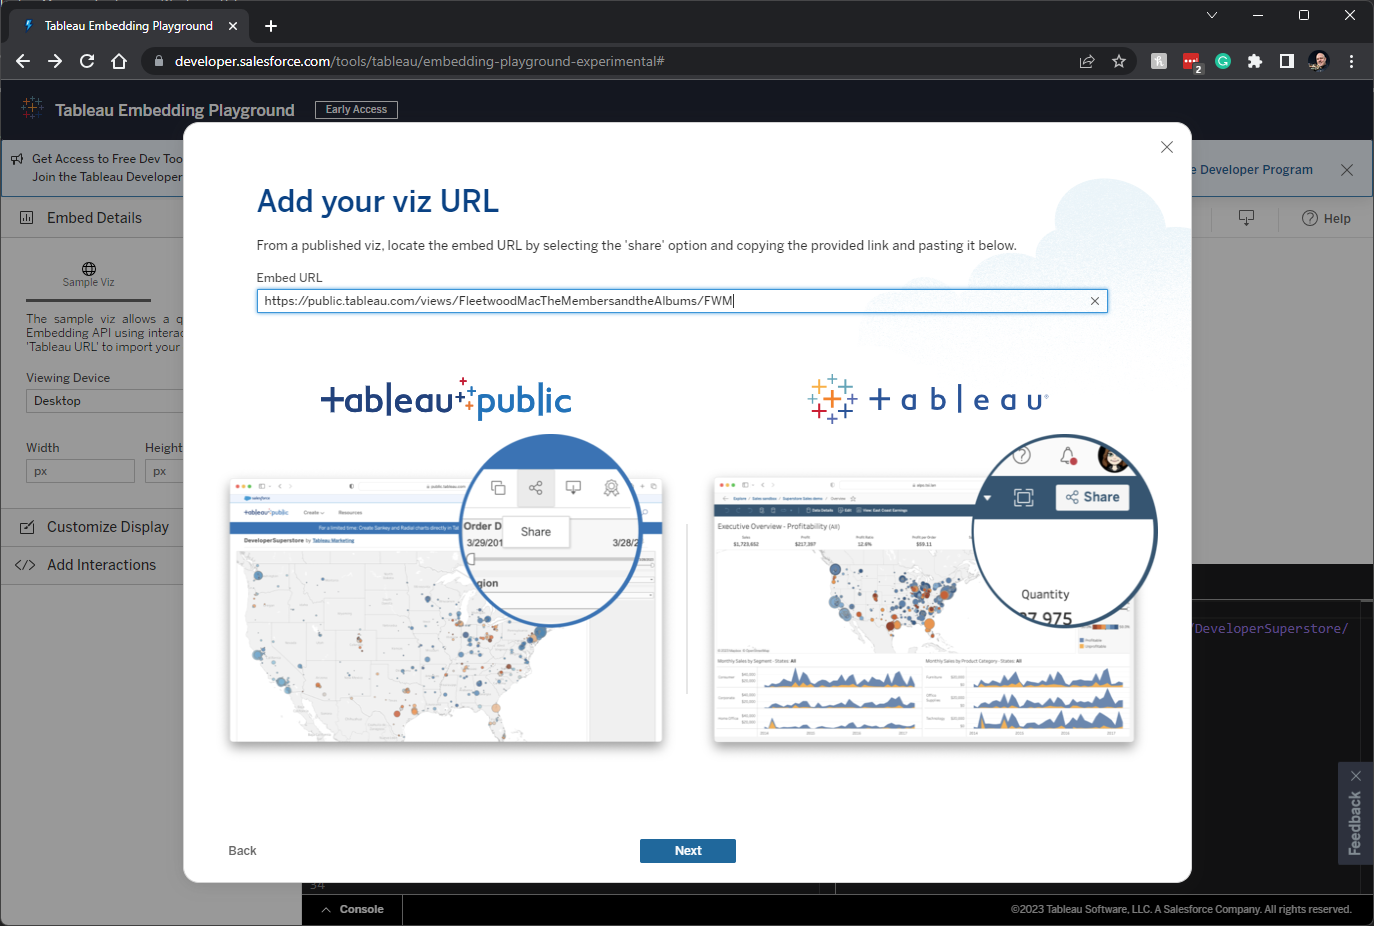
Let’s choose to use our own URL. The tool works with Public,
Cloud, and Server, so open your workbook, click the Share button then copy the link. Paste that link into the tool, then click Next.
If you’ve used a workbook from Cloud, you’ll be prompted to set up
a Connected App.
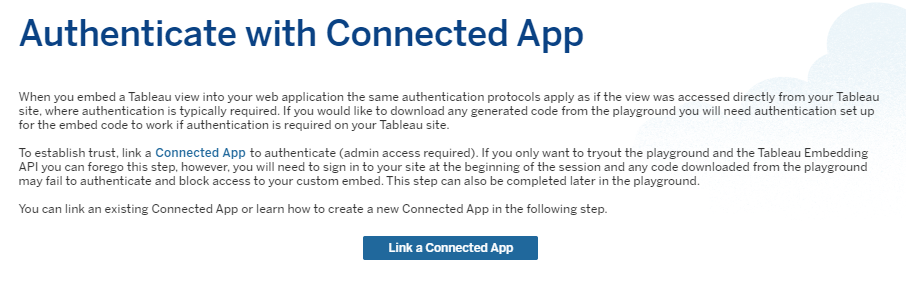
As of January 2022, Connected Apps allow you to set up secure,
seamless, integrated authentication between your app and Tableau Cloud. It does
this by facilitating a trust relationship between Cloud and your application,
enabling things like single sign-on. The trust relationship is established and
verified through an authentication token that uses the JSON Web Token (JWT)
standard. This uses a shared secret provided by the Tableau connected app and
signed by your external application.
There is a lot more to Connected Apps and setting them up—you can
learn more by visiting Configure
Connected Apps with Direct Trust.
Once you’ve set up your Connected App, the Embedding Playground will walk you through the
process of adding it to your embed.
Important! The setup of a Connected
App provides you with three keys—Client ID, Secret ID, and Secret Value. The
combination of these is basically your password. It is critical that you always create your token on the server.
When generated server-side, you’ll get a token that is short-lived and specific
to a single session. This means that hackers cannot do anything with it. Tokens generated client-side are not
secure. Tableau’s GitHub account
has examples for creating these
tokens
using several languages including C#, Python, Java, and JavaScript (via Node.js).
Okay, back to the Embedding Playground…Once you’ve entered a URL,
you should have something like this.
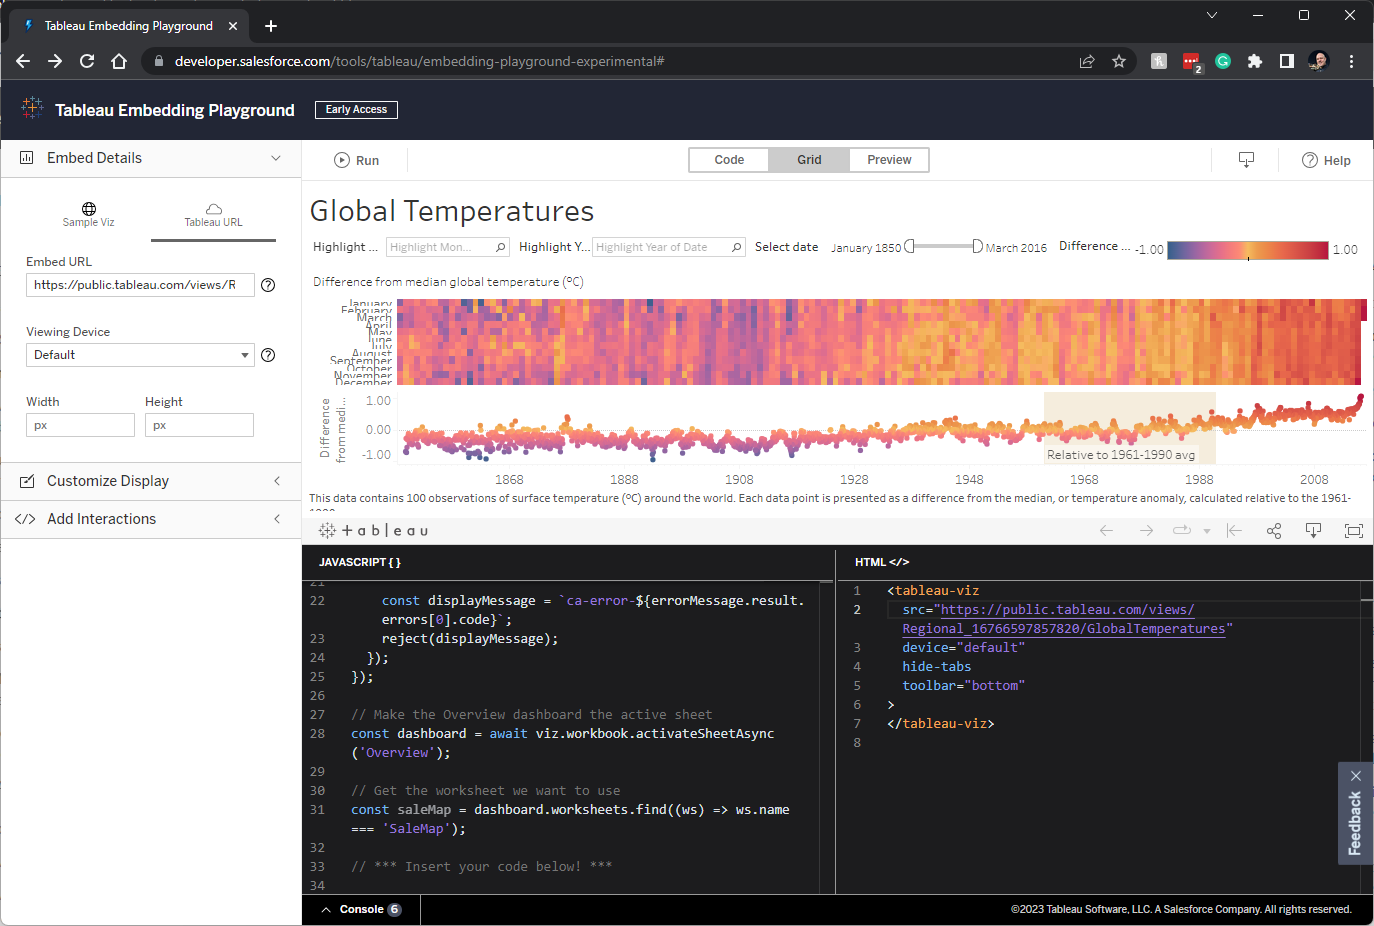
On the left, you’ll see the URL you entered and some other
options. You can select from different Viewing
Devices if you like or just go with “Default.” You can also set a specific Width and Height. If you leave these empty, it will default to the dimensions
of the viz itself. Take note of the small help icon to the right of
these—clicking these will provide some useful guidance to help you make the
right choices.
Clicking Customize Display
will give you the option to show tabs or to change the toolbar location.
Note:
One of the toolbar locations is “Hidden.”
When using Tableau Public, you cannot hide the toolbar entirely, but the Hidden
option will hide some of the buttons.
Below the Customize Display
pane are interactions. Let’s skip these for now and come back to them later in
this blog.
Across the top, we have a few different options. Clicking Run will update the preview to account
for any change you’ve made. The buttons in the middle allow you to show only
the Code (Code), only the Preview window (Preview) or both (Grid). On the right
are a button for downloading the code and one for accessing help. Clicking the
download button will give you two options—Download
Code and Copy Embed Code. Both
will give you the same code, but the Copy option will copy it to the clipboard,
while the download option will download it as an
HTML file. The examples I’ll share shortly were downloaded directly from the
tool using these options.
Note:
As detailed previously, there is a difference between creating raw HTML with
embedded content and embedding that content within a web platform such as WordPress, Drupal, or Wix. The code the Embedding Playground provides is the
full HTML. If you’re embedding this content in a web platform, you don’t need
all of that. Refer to the first blog in this
series for
more details on this topic.
And, of course, the code is at the bottom. It has two
components—the JavaScript code on the left, which is what calls the Embedding
API, and a bit of HTML on the right. The JavaScript is
fully editable, so if you’re comfortable with coding, you can use the generated
code as a starting point and add your own tweaks. Or, if you like, you can
download the code and open it in your favorite editor. That said, I prefer
keeping it in the Embedding Playground because it allows you to easily preview
your changes as you go. If you make a change in the editor and want to go back,
there is no Undo button, but you can use CTRL+Z (and related commands) to undo
those changes, just like any other editor.
Examples
In the last
blog, I shared examples of three common scenarios, showing you how to
use iFrames, the JavaScript Embedding API v2, and the JavaScript Embedding API
v3 for each. So, today, I’m going to show how to do each of those using the
Embedding Playground. I’ve created complete working HTML examples which I’ve
posted on GitHub.
I’ve also uploaded these to flerlageapps.com so
you can open and interact with them. Finally, I’ve created snippets of just the
embed code via “pens” on codepen.io.
These pens allow you to see just the embed code and view the results of that
code. In addition, these pens allow you to play with the code (similarly to the Embedding Playground) so
you can experiment with your own embeds. As we go through each example, I’ll
share a link to the code on Github, the working HTML page on flerlageapps.com,
and the pen on codepen.io.
The three scenarios I’ll be addressing are as follows:
1) Fixed-Sized – A
dashboard that uses fixed sizing—essentially a static height and width.
2) Device Layouts – A
dashboard built using Tableau’s Device Designer. Essentially, these contain
what amounts to separate dashboards for different target platforms—each with
its own unique height and width.
3) Automatic or Ranged
Sizing – Dashboards that are built with automatic or ranged sizing, which
allows them to automatically resize to fit the page.
Fixed-Size
Embedding
As in the previous blog, I’ll be using my viz, The
Widening Divide. The dashboard has a width of 1500 pixels and a height of 2000
pixels. Our goal is that the embed will look like the following image, with the
workbook centered on the page. We’re centering because, in my experience, it
tends to make more sense than left or right alignment.
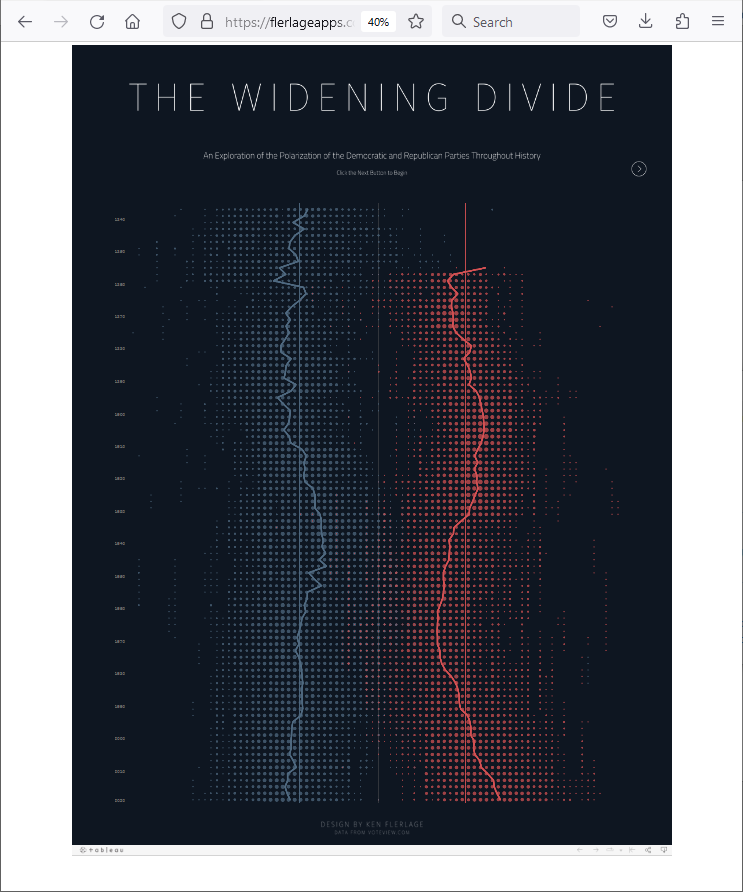
Zoomed to 40% so we can see the entire dashboard.
Creating this embed is quite simple as we just need to get the
Share URL from the workbook and paste it into the Embedding Playground. You can
use either the “desktop” or the “default” option for the Viewing Device. With just those simple steps, you’ll have working
embed code!!
I did, however, find a couple of things I did in the last blog
that isn’t yet available in the Playground—specifically, editing the title of
the HTML file and centering the embed. To change the title, I changed the text
within the title tags near the top.
To center, I added a div around the
HTML portion of the embed as shown below. You’ll just need to change the max-width to the width of your
dashboard.
Note: There are many ways to align elements in web design, so this is just one of many
approaches for centering this content. And, to be entirely honest, I’m not sure it’s
the best or most efficient–but it works!
Near the end of the code, the Embedding Playground also creates a few lines of code to set the active sheet and get the worksheet you want to use.
For simple embeds like this one, we don’t need it (though it won’t hurt either). Just to keep things clean, I’ve removed it. If we were to include additional interactions to the embed, then we would typically need this code. If you do that, just be sure to update the names of the dashboard/sheet.
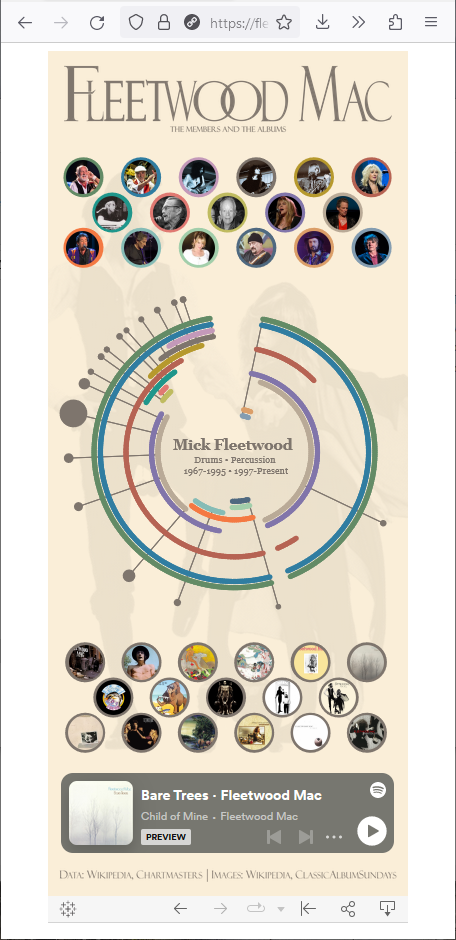
Device
Layouts
For this example, I’m using my viz, Fleetwood
Mac: The Members and the Albums. The dashboard has two
device layouts—Desktop and Phone. The Desktop layout has a width of 1100 pixels
and a height of 1600 pixels. The Phone layout has a minimum width of 375 pixels
and a height of 845 pixels. Our goal is that our embed will display the desktop
view when displayed on larger screens and the phone view on smaller screens.

Zoomed to 50% so we can see the entire dashboard.
Like the last example, it’s super easy to create this embed using
the Embedding Playground. We paste the Share URL into the Embedding Playground
then select the “default” option for the “Viewing Device.” This will allow
Tableau to trigger the device-specific layouts as needed.
Like the last example, I changed the title and removed the
unnecessary code at the end. To center the embed, I used the same technique as
I used for the fixed-size embed. Just be sure that max-width is set to the maximum possible width of the embed
(typically the width of the desktop layout).
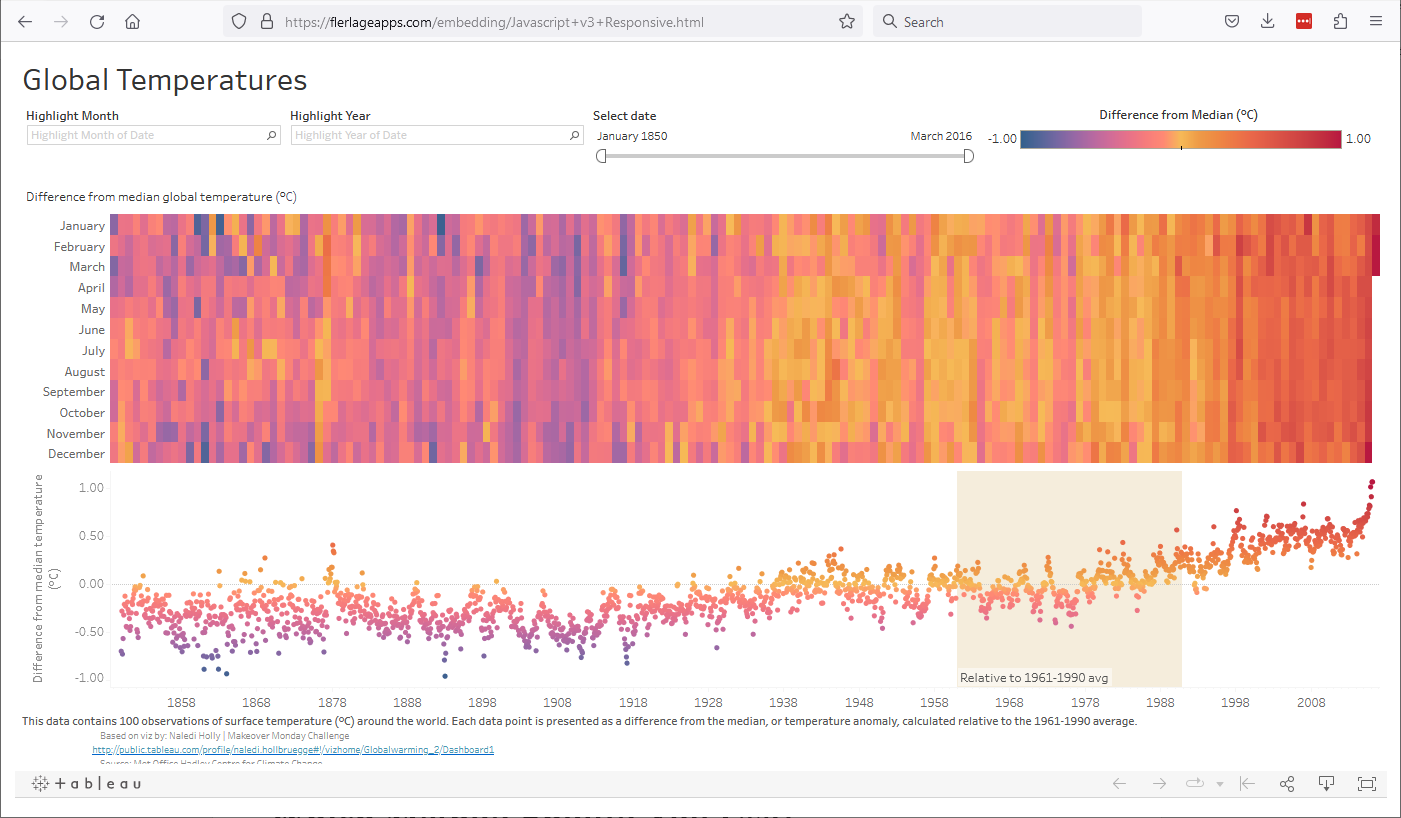
Responsive
Embedding
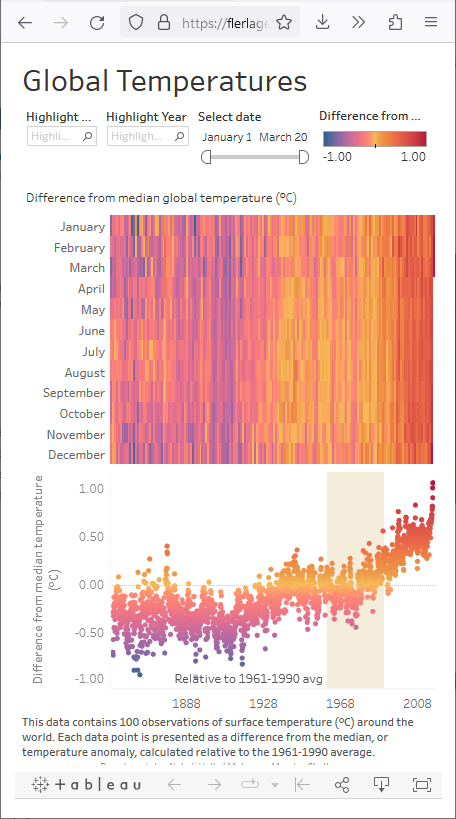
For this final example, I’m going to be using a
version of Tableau’s “Regional” accelerator. Specifically, I’ll be
using the Global Temperatures dashboard which is based on the original work Naledi
Hollbruegge for Makeover Monday. The dashboard is set to automatic sizing.
Our goal will be to have the content fit the browser window, automatically
updating as we change the window size. Here are a couple of examples of how it
should look at different sizes.
Once again, the Embedding Playground makes this super easy. We
paste the Share URL it into the Embedding Playground then select the “default”
option for the “Viewing Device”.
Unfortunately, I did find that, while the width automatically
adjusts to account for changes to the window size, the height does not. To
address that, we’d likely need to add some enhancements to the code, not unlike
what I shared in my previous blog. It is important to note that the Playground
is only meant to provide a starting point. In some cases, it will meet your
needs perfectly, while in others, you may need to add a few of your own
enhancements.
Interactions
Now let’s talk about interactions. The examples I’ve shared here focus on somewhat basic use cases. But the Embedding
API version 3 provides so much more functionality we can apply. That’s where
the “Add Interactions” feature comes into play. If you expand this drawer, you’ll get
options for “Worksheet”, “Dashboard”, and “Workbook”. Drilling further will
provide options for adding context menus, exporting, filtering, mark selection,
and parameters. We can use these interactions to create interactivity between
our application/website and the viz itself.
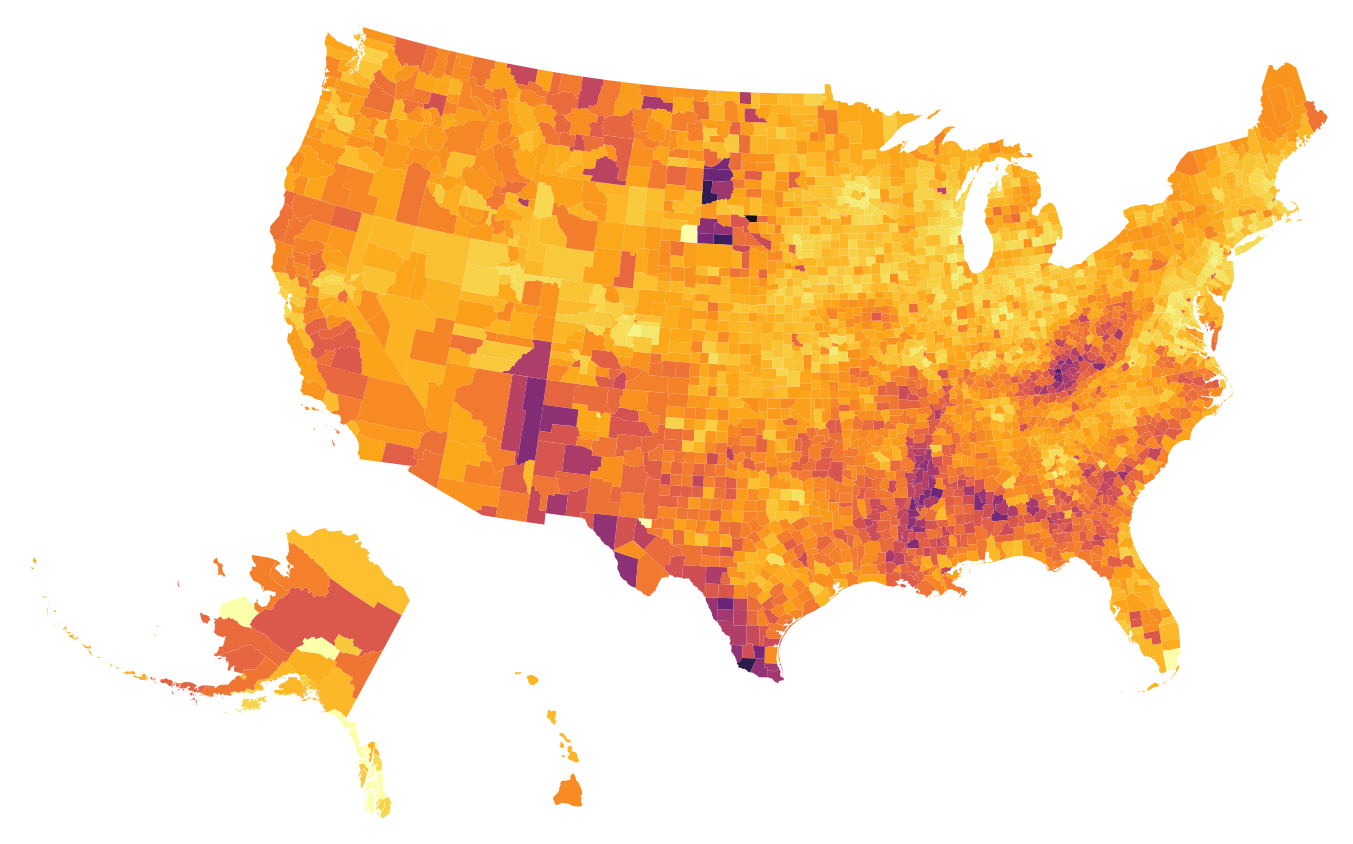
For example, let’s embed a map
showing poverty rates.
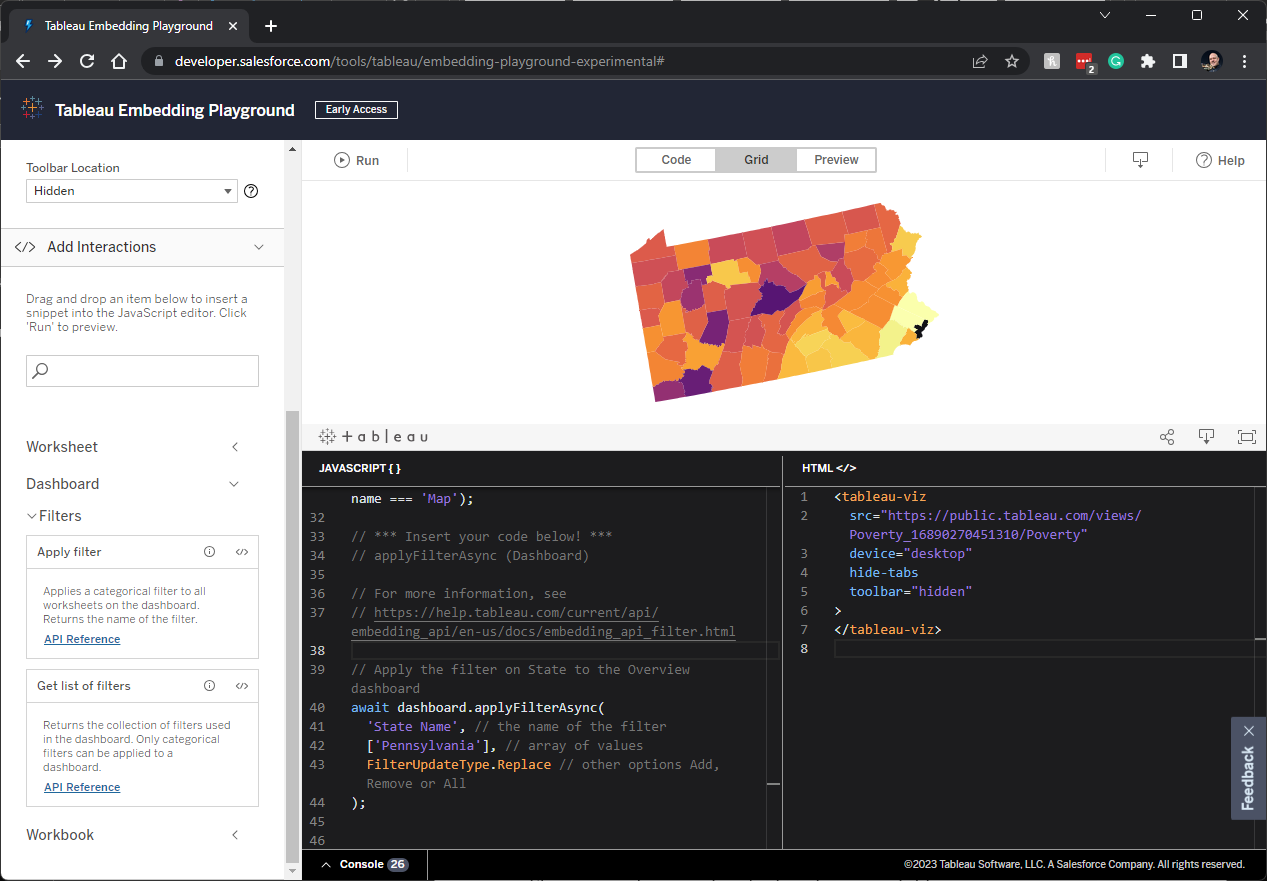
Perhaps you want to allow the users of your app to filter by
state. To do that using the Embedding Playground, scroll to the bottom of the
JavaScript code window to where it says “// *** Insert your code below! ***”.
On the left panel, select the Dashboard
interaction type, then drag over the Apply
Filter interaction. This will create some template code for applying a
filter.
Let’s
filter our poverty viz to show only Pennsylvania. The
state field in our poverty viz is called State
Name so, we’ll edit the code as follows:
Note: The above
only shows the snippet of code that was actually changed.
Now, when we click Run,
it will filter to Pennsylvania.
But you’re probably wondering why we’d do that in code? If we want
to give the user the ability to filter the viz, why not just display the filter
on the viz? Yes, you’re exactly right—but the problem is more complex than
that. This viz is just part of a larger tool in your application. Your
company’s app allows people to select a state and look at various information
about that state. The poverty rates map is just one component of many other
non-Tableau components. The first thing the user does is select a state from a
non-Tableau dropdown list. You don’t want them to have to filter the viz as
well as that would feel awkward. So, we leverage the JavaScript code and a
variable containing the selected state to automatically filter it within the
embed! This creates powerful interactivity between the app and the embedded
content, which helps to make it feel like it belongs there—it is just part of
the app itself, not a separate component.
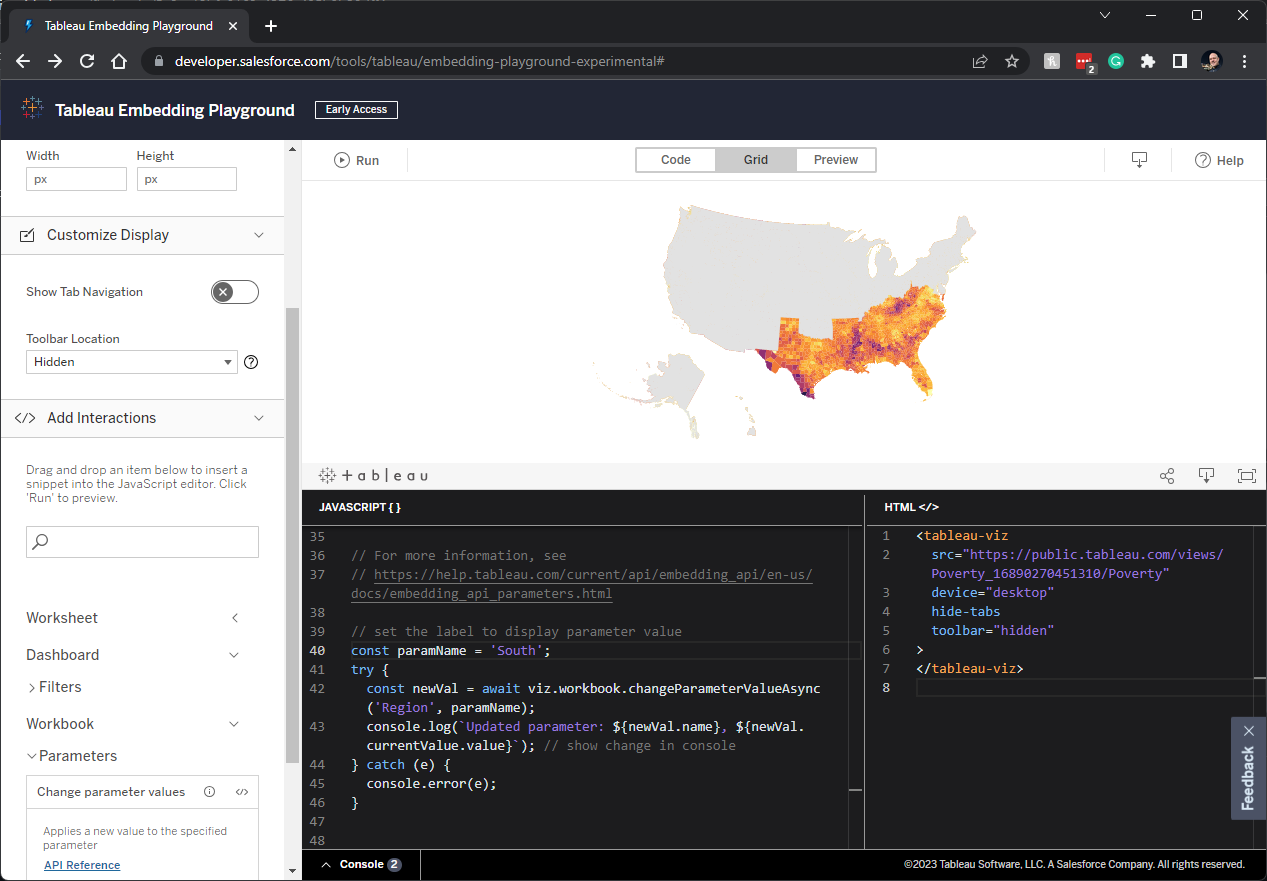
Let’s do another interaction. This poverty rates viz has a
parameter called Region. When you
select a region from the parameter, it will grey out the rest of the country
allowing us to focus on just the selected region. For example, if we select
“South” we’ll see the following:
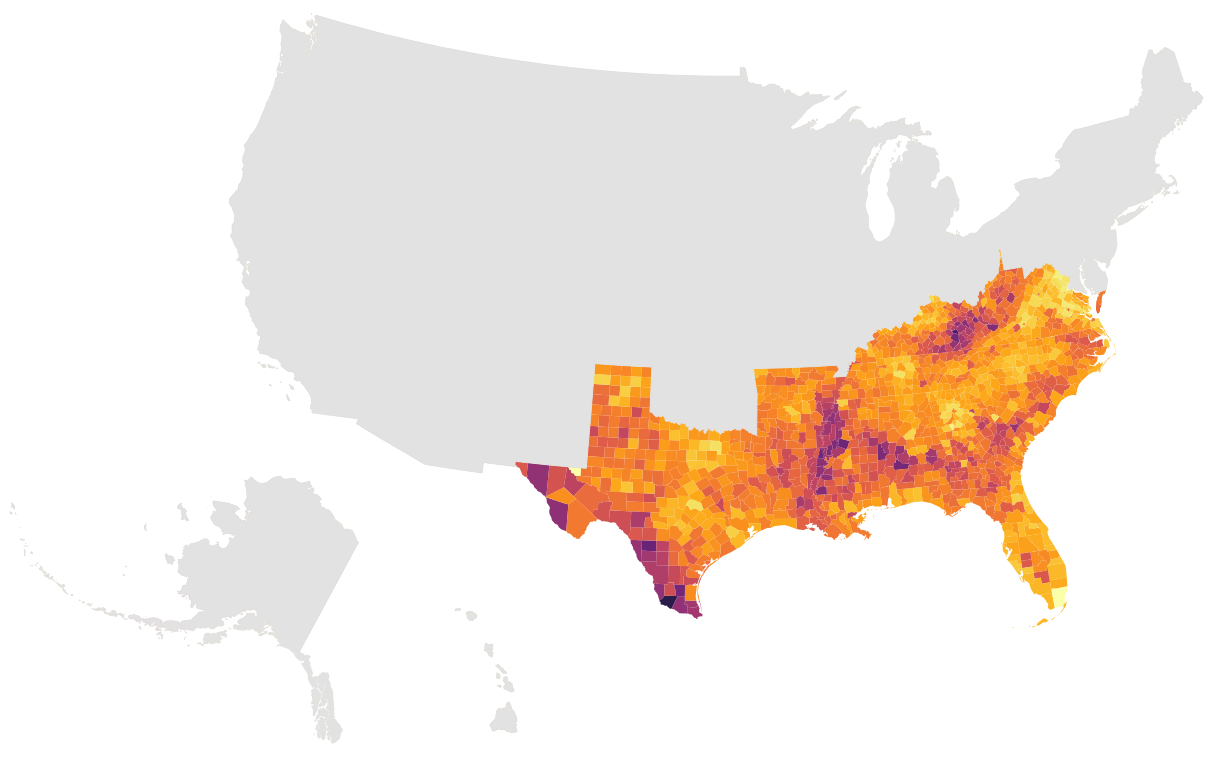
If we wish to trigger that action within the embed code, we’ll
select the Workbook interactions
then choose Change Parameter Values.
Next, we update the code. We’ll change the const
paramName = line setting this to the value we want to select in the
parameter—in our case “South”. Then, in the line reading const newVal = await viz.workbook.changeParameterValueAsync, we’ll
change the first parameter to the name of the parameter itself, “Region”.
That will create the highlight effect within the embed.
Note:
Figuring out what to change can be a bit tricky. If you get stuck, click the
“API Reference” link on the left panel to go to the online documentation and
learn more.
Let’s do one more interaction example. Under Worksheet, there is an interaction called Context Menu. If we add this to our code, it will allow us to add
an action to the tooltip.
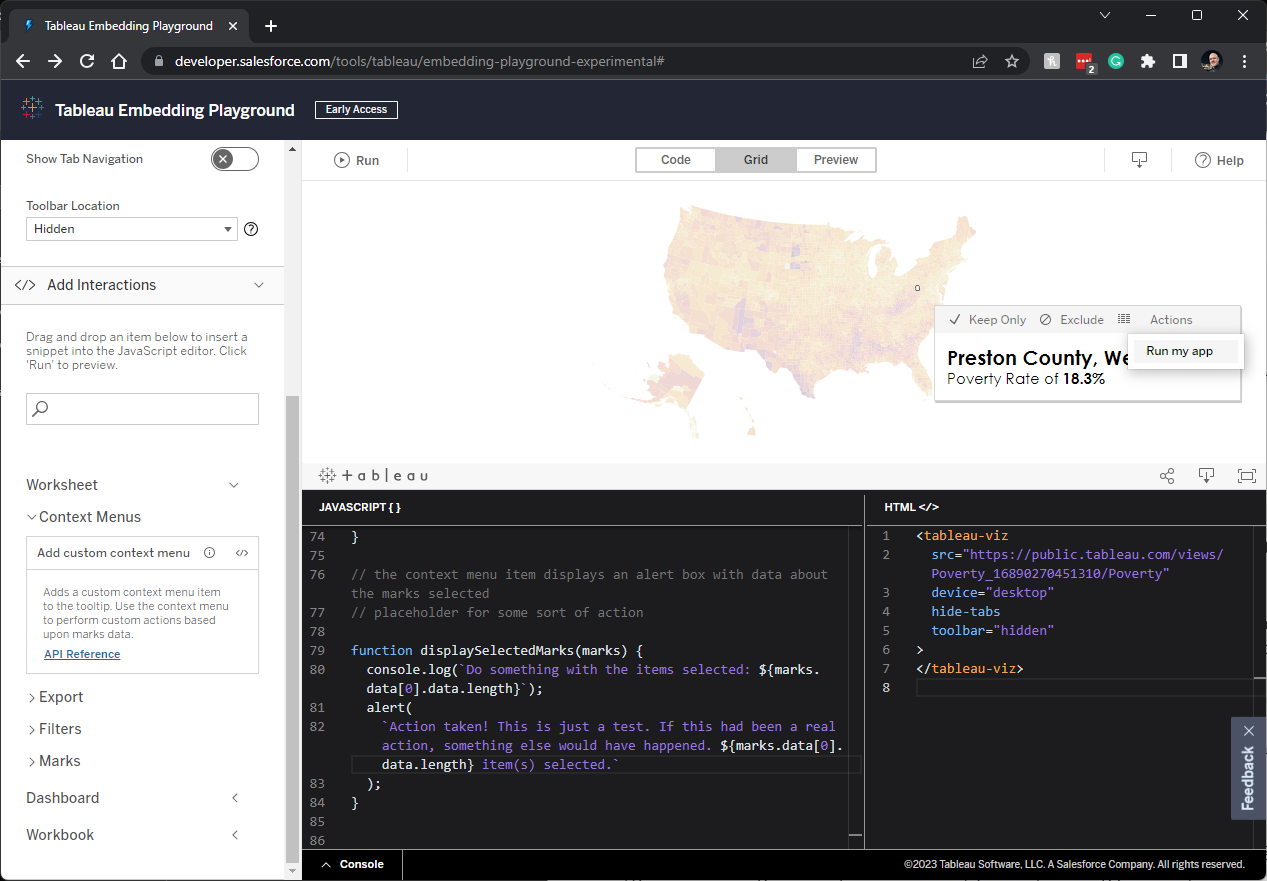
The template code creates a very simple menu titled “Run my app”
which, when clicked, triggers an on-screen alert. But just imagine what else
you could do with this!! Business processes could be triggered directly from
the embedded Tableau content; emails could be sent; pretty much anything you
could imagine. And it’s all done from within the context of the embedded
content. It’s just one more thing that makes the embed feel like a fully
integrated part of your app.
Note:
The interactions available via the Embedding Playground do not cover all the
capabilities of the Embedding API. There’s much more that you can do with the
API that isn’t yet available in the tool. For now, you’ll need to write that
code yourself. 😉
One
last component to be aware of is the Console window. Below the JavaScript,
you’ll see a “Console” button. Clicking that button will expand the console
window, which displays any messages written by console.log() calls in the JavaScript. The default code makes use
of console logging to provide useful information as the code runs and you can
add your own additional console logging to help you debug along the way.
Closing
When I wrote the code for the previous blog of examples, it took
me forever—both because I had to write the code largely from scratch and
because I’m not an expert JavaScript programmer. But, with the Embedding
Playground, this is all so much easier. It’s largely plug-and-play, allowing
you to generate powerful embed code—including several different types of
interactions—that you can then modify to your exact specifications. The result
is embedded content that looks, acts, and feels like a fully integrated part of
your application. Users neither know nor care that it’s a separate
component—and that’s what embedded analytics is all about!
I hope that this blog has provided you with a good primer on the
new Embedding Playground. Moving forward, this will be my primary starting
point any time I embed any Tableau content. And that’s my advice for you as
well. Use the playground to create your base code, add any necessary
interactions, create seamless authentication through a Connected App, then
download the code. The code will likely require a few tweaks, but the tool will
get you most of the way there, saving you a ton of time along the way!
Thanks for reading!
Ken
Flerlage, August 7, 2023
Hire
Us! | Twitter | LinkedIn | GitHub | Tableau
Public


This comment has been removed by a blog administrator.
ReplyDeleteThanks so much for this very helpful primer. In the past, I've had luck by just copying the embed code from the share button and then pasting it into a "code block" on Squarespace. I assume that this is an okay approach as long as you get the result you want. But I'm curious as to why you didn't mention the embed code at all in your blog posts. Is there anything I should know about using it?
ReplyDeleteHmmm. I'm surprised I didn't mention that either--I should have. That being said, the embed code you get from using that "Share" opiton is just some pre-configured JavaScript, similar to the examples I shared. At the time I wrote this blog, that option was giving version 2 code (I haven't checked back to see if it's now using version 3). The Javascript isn't really formatted or easy to read and, therefore, not particularly easy to edit. As you said, yes you can use this if it works for you, but I wanted this blog series to address specific scenarios--many of which aren't handled in the JavaScript you get from the Share option. I also wanted people to have a better understanding of what's happening when the code is used.
DeleteThanks for this very helpful reply, Ken.
ReplyDelete