
3 Creative Uses for Relationships/Joins in Tableau

Whether you’re specifying physical joins or leveraging relationships and letting Tableau’s new data model determine which joins to create, joins are a powerful and vital tool in Tableau. They allow you to bring together data from multiple tables and analyze them as one singular result set. In fact, it’s pretty rare that I ever create a Tableau data model that doesn’t bring together multiple tables using joins/relationships.
While typical joins are quite common, I’ve found that we can
use joins in some very creative ways in order to better prepare our data for
analysis and visualization. In this blog, I’m going to share three creative
uses of joins which can be incredibly valuable and prevent the need for complex
calculations.
Get Data from a Prior Row/Partition
One common Tableau problem I see is when you need to perform
some sort of calculation across multiple rows or partitions of data. For
example, the following table shows sales, by month, for three customers.
|
Period |
Customer |
Sales |
|
01/01/2020 |
Søren Kierkegaard |
83,689 |
|
02/01/2020 |
Søren
Kierkegaard |
67,590 |
|
03/01/2020 |
Søren Kierkegaard |
60,582 |
|
04/01/2020 |
Søren
Kierkegaard |
75,482 |
|
05/01/2020 |
Søren Kierkegaard |
72,009 |
|
06/01/2020 |
Søren
Kierkegaard |
64,886 |
|
01/01/2020 |
Albert Camus |
76,481 |
|
02/01/2020 |
Albert
Camus |
75,519 |
|
03/01/2020 |
Albert Camus |
49,479 |
|
04/01/2020 |
Albert
Camus |
15,754 |
|
05/01/2020 |
Albert Camus |
50,847 |
|
06/01/2020 |
Albert
Camus |
26,576 |
|
01/01/2020 |
Jean Paul Sartre |
47,474 |
|
02/01/2020 |
Jean
Paul Sartre |
89,102 |
|
03/01/2020 |
Jean Paul Sartre |
62,544 |
|
04/01/2020 |
Jean
Paul Sartre |
47,535 |
|
05/01/2020 |
Jean Paul Sartre |
83,919 |
|
06/01/2020 |
Jean
Paul Sartre |
49,783 |
Let’s say that I want to show the increase in sales from
month to month for each customer. The typical approach to this is using LOOKUP
to get the previous row’s value.
Difference
// Difference between this month and previous month.
SUM([Sales]) - LOOKUP(SUM([Sales]), -1)
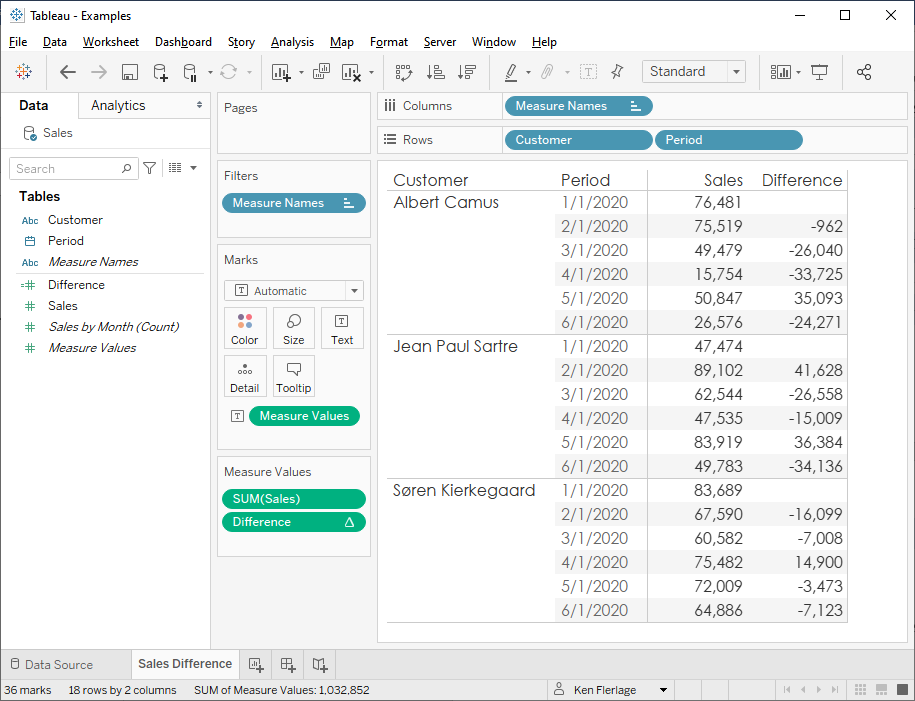
This works pretty well in when the data is in a table, but this
solution can start to break down pretty quicky. LOOKUP is a table calculation
so it’s extremely sensitive to the dimensions on the view. Additionally, since
this field is a table calculation, any subsequent calculations that use this
field must also be table calcs and will have the same dependency upon the
dimensions on the view. Anyone who’s found themselves in this situation knows
that it can get pretty complex.
Ultimately, this would be much easier if we could make these row-level calculations, as we could then completely eliminate table calculations, providing us with much greater flexibility. To do that, we’d need a data structure like this:
|
Period |
Customer |
Sales |
Previous |
|
01/01/2020 |
Søren Kierkegaard |
83,689 |
|
|
02/01/2020 |
Søren
Kierkegaard |
67,590 |
83,689 |
|
03/01/2020 |
Søren Kierkegaard |
60,582 |
67,590 |
|
04/01/2020 |
Søren
Kierkegaard |
75,482 |
60,582 |
|
05/01/2020 |
Søren Kierkegaard |
72,009 |
75,482 |
|
06/01/2020 |
Søren
Kierkegaard |
64,886 |
72,009 |
|
01/01/2020 |
Albert Camus |
76,481 |
|
|
02/01/2020 |
Albert
Camus |
75,519 |
76,481 |
|
03/01/2020 |
Albert Camus |
49,479 |
75,519 |
|
04/01/2020 |
Albert
Camus |
15,754 |
49,479 |
|
05/01/2020 |
Albert Camus |
50,847 |
15,754 |
|
06/01/2020 |
Albert
Camus |
26,576 |
50,847 |
|
01/01/2020 |
Jean Paul Sartre |
47,474 |
|
|
02/01/2020 |
Jean
Paul Sartre |
89,102 |
47,474 |
|
03/01/2020 |
Jean Paul Sartre |
62,544 |
89,102 |
|
04/01/2020 |
Jean
Paul Sartre |
47,535 |
62,544 |
|
05/01/2020 |
Jean Paul Sartre |
83,919 |
47,535 |
|
06/01/2020 |
Jean
Paul Sartre |
49,783 |
83,919 |
Here’s
where we can get a bit creative with our joins. We’ll
drag our table into the data pane again.
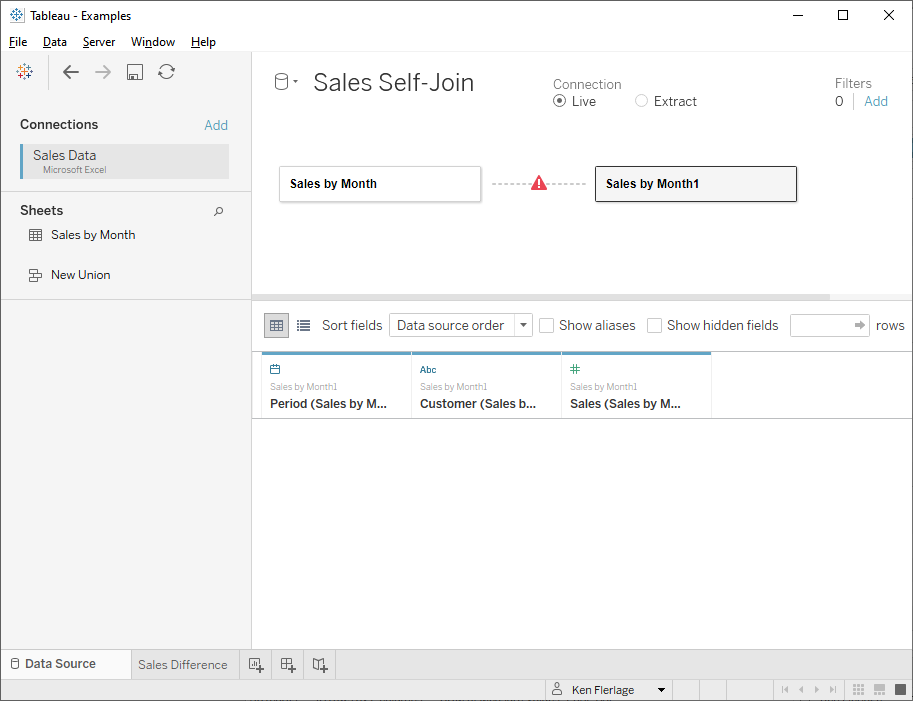
To help distinguish the purpose of the two logical tables,
I’m going to rename the first “Current” and the second “Previous”. Now I’ll
create a relationship between the tables using Customer Name and Period.
For Period, we’ll create a relationship calculation on the left side:
DATE(DATEADD('month', -1, [Period]))
And we’ll relate this to the normal Period field on
the right side.
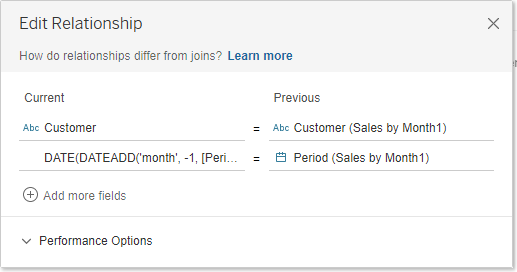
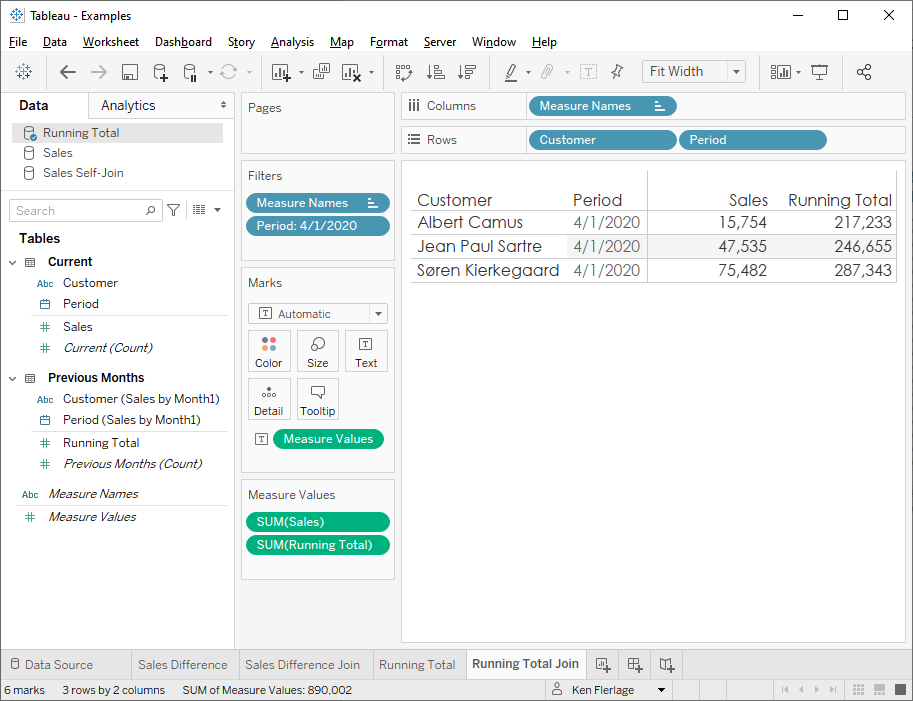
This basically instructs Tableau to pull the previous month’s
data, for each customer, in the second table. Now we’ll see the following
fields:

I’ll rename Sales (Sales by Month1) to Sales – Previous
so that it’s clearer what this represents.
We now have both the current and previous sales amounts on a
single row, so we can perform simple row-level calculations to get the
difference.
Difference
// Difference between this month and previous month.
[Sales] - [Sales - Previous]
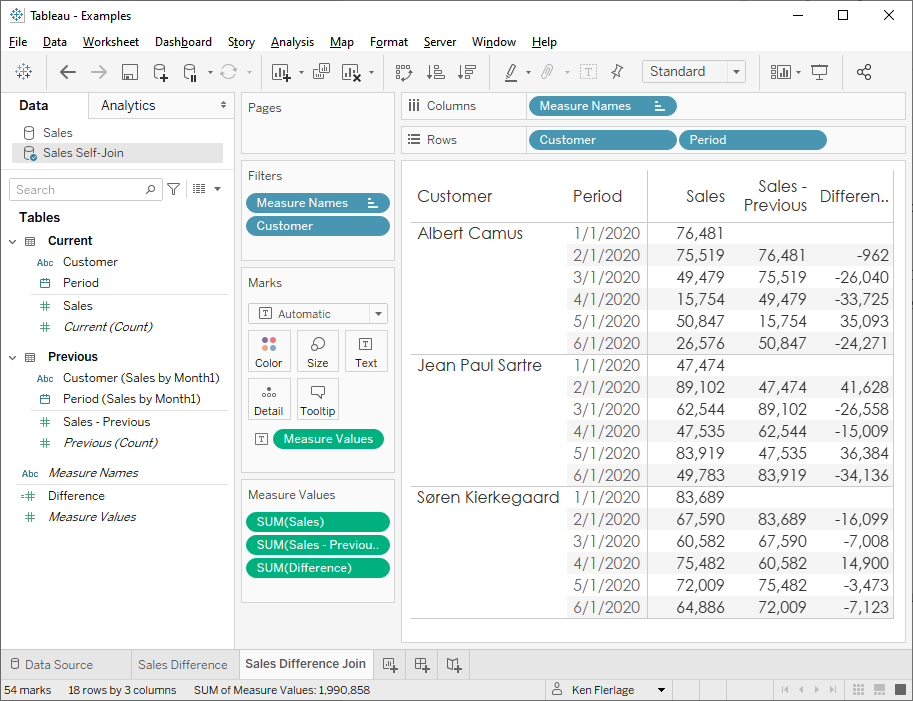
Because this is not a table calculation, it is not dependent
upon the view. We can remove dimensions, perform other types of aggregations,
add totals, etc. without the complexity of table calculations. In the end, this
is a much more flexible solution than using LOOKUP.
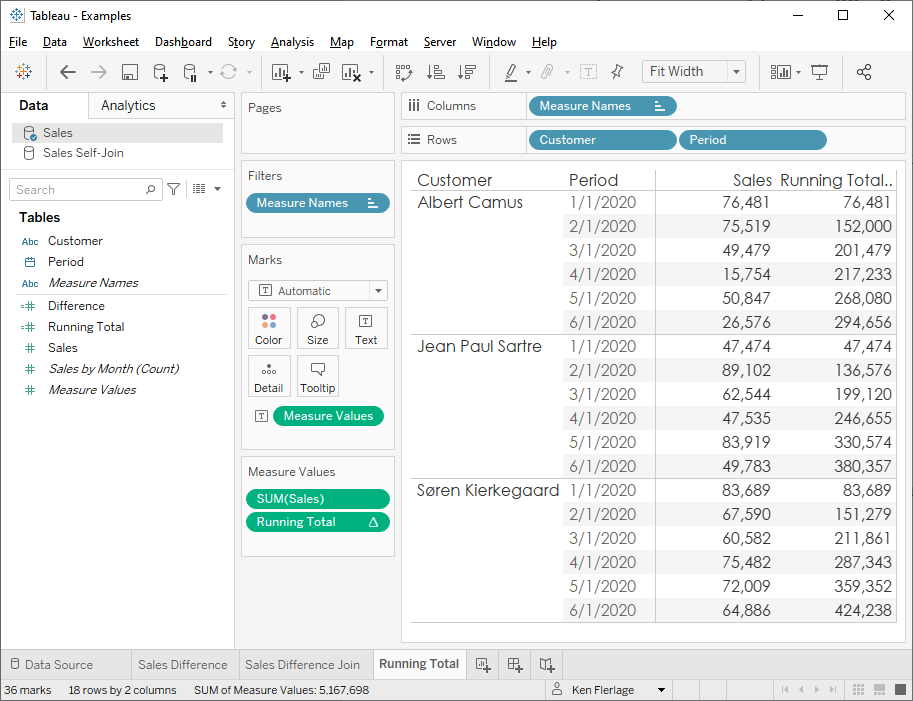
Running Totals
Another common issue I see is the need to show a running
total of some measure. The typical solution to this is the use of a running sum
table calculation.
Running
Total
// Running total of sales.
RUNNING_SUM(SUM([Sales]))
This has a similar problem to the first use case—RUNNING_SUM
is a table calculation, which will cause additional complexity if you need to
filter data, remove dimensions from the view, or perform additional
calculations. For a example, let’s say you want your users to be able to see
the running total for April only. You add a filter on Period and filter down to
April.
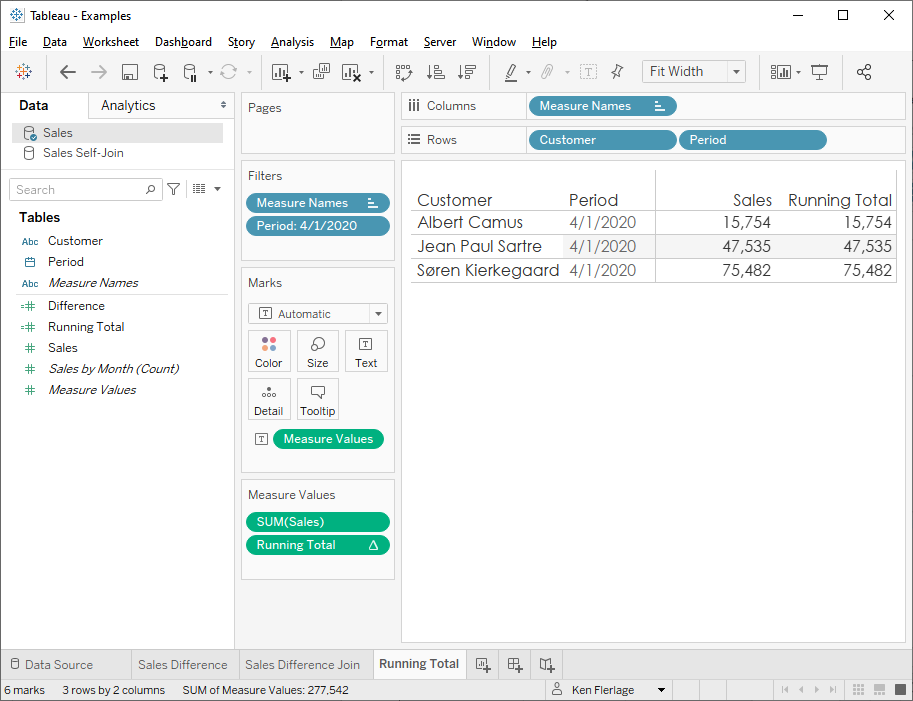
The running sum requires the previous rows to be visible on
the view in order to accurately compute the result. Because we’ve filtered out
those previous rows, the table calculation only sums April. At this point, to
solve this problem, we have to trick the Order of
Operations by creating a LAST() = 0 calculation and using it as a filter. Yuck!!
Once again, it would be nice if we could eliminate the use of
table calculations and convert these into row-level calculations. As you may
have already guess, we can do this using a join. Like the first use case, we
will drag the table into the data pane a second time. We’ll relate on Customer
Name and Period, but we’ll set up the Period relationship
with a >= comparison.
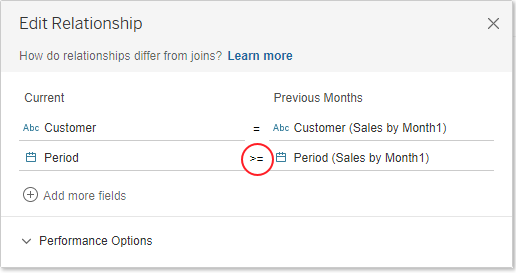
This will join all previous rows to the current row meaning
that Sales from the second table will effectively be our running total—we
don’t even need a calculation. I’ll rename this field Running Total and
add it to my view.
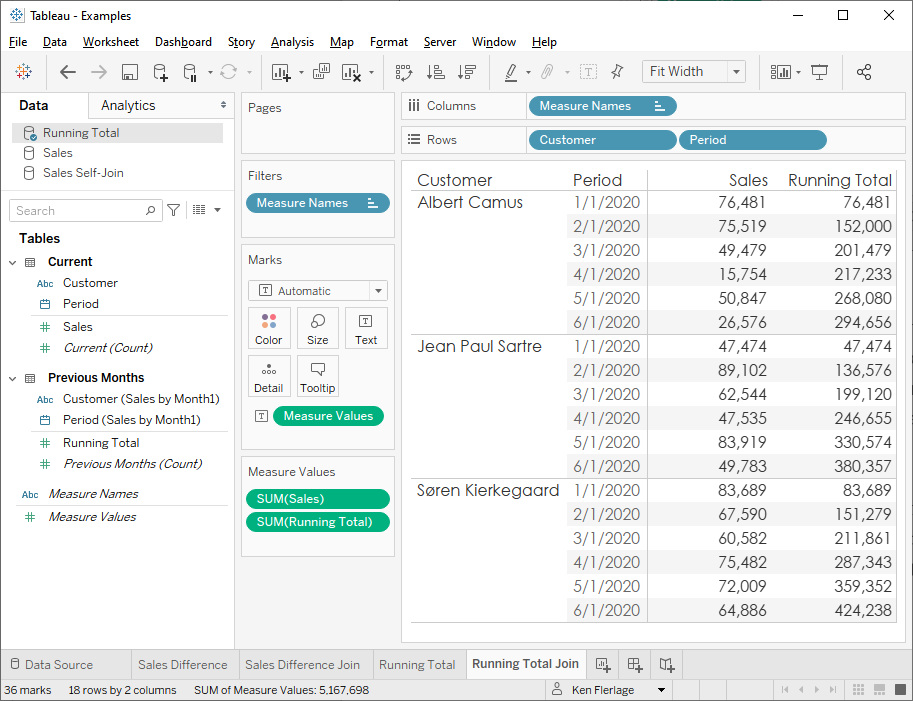
And, since this is now just another field on each row, we
can filter to April without having any impact on the running sum.
There are a few of things I should note about this solution.
First of all, if your starting point for a running sum needs to be flexible,
then this solution may not work well. For example, if you wanted your user to
be able to choose the start and end data of the running total, then the running
sum table calculation might be a better approach.
Second, if you perform this technique using a physical join,
instead of relationships, then you will be duplicating your records quite a
bit. For example, this 18 row data set would become 63 rows. So, if you’re
dealing with millions of rows, you’ll need to be careful. Another issue with physical
joins will be that your current Sales measure will be duplicated
multiple times, so when you sum the measure, the values will also be
duplicated. To address this, an LOD could be used.
However, if this is done via relationships, Tableau will generate SQL in such
as way that you will not get duplicate records, making relationships the better
approach.
The final thing I want to note is that this solution can be
very useful if you intend to animate a chart using Pages. I’m not sure of a way
to show running sums using pages, but since the join produces a row-level
measure, we can easily show the running sum over time using Pages.
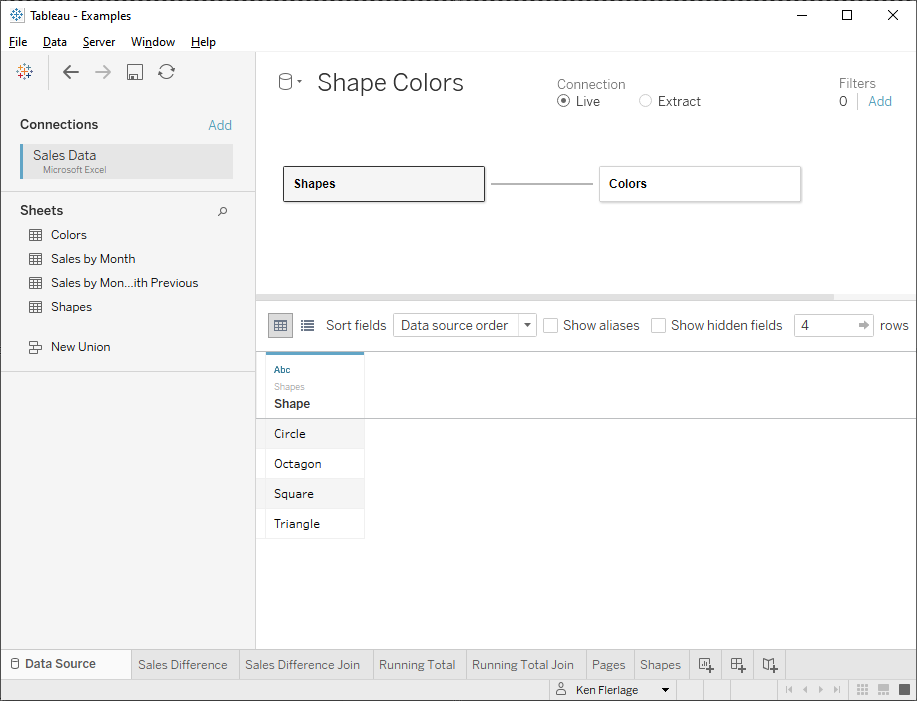
Cross-Joins
My final creative use for joins is one I’ve talked about previously,
cross-joins. As I discussed in SQL for Tableau Users
Part 2: Combining Data, a cross-join will join each record from one table
to each record from another. For example, let’s say we have two tables, Shapes
and Colors and we wish to get all possible combinations of shapes and
colors.
|
Shape |
|
Circle |
|
Octagon |
|
Square |
|
Triangle |
|
Color |
|
Blue |
|
Red |
|
Yellow |
To perform a cross join in Tableau, we’ll drag both tables
to the data pane.
Then we’ll create relationship calculations on both sides with
just the value 1 (or any value, for that matter, as long as both sides are the
same). This will essentially join each record from the first table to each in
the second.
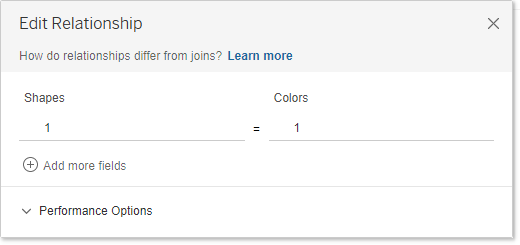
Now we can list each combination of shapes and colors.
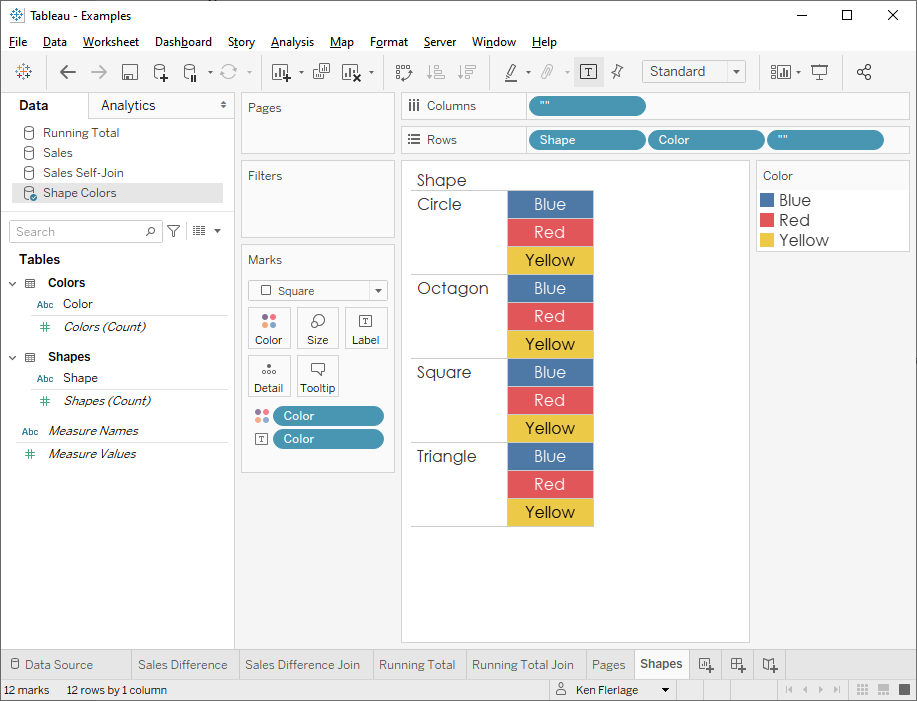
This has a ton of use cases. It’s used frequently when you
need to densify your data, in order to do things such as draw curves. It’s also
used in cases where you wish to create a data scaffold. I’ve written about both
of these topics in the past, so I won’t go into any further detail here. If you’re
interested, please see An
Introduction to Data Densification and Creating a Date
Scaffold in Tableau.
Wrap-Up
I personally love these three creative uses for joins and I leverage
them all the time. They can address many common problems and can often eliminate
a lot of complexity in your Tableau workbooks. I hope you find them useful as
well.
I wish to note one last thing before I wrap up this blog. In
all the examples I’ve shared above, I used Tableau Desktop to perform the joins
via relationships. You can, of course, perform all of these using physical
joins or within Tableau Prep (which uses physical joins). Just keep in mind
that these approaches will produce duplicate records, which could lead to other
complexities. Whenever possible, I think it’s best to leverage relationships,
but there are times when you might prefer to perform your data prep up front
via Tableau Prep or you may find that you want to force the use of physical
joins. In those cases, these same techniques can be applied—just be aware of
some of the drawbacks that I noted previously.
Thanks for reading! If you have any comments, please feel
free to leave them in the comments section below.
Header image created by
rawpixel.com
Ken Flerlage, August 2, 2021


Hi Ken,
ReplyDeleteDo you have suggestion on this?
https://community.tableau.com/s/question/0D54T00000j6eGoSAI/how-to-achieve-this-output-using-relationship-join
Nice article - but it would be helpful to mention that there is another alternative with most (modern) databases, to use windowing queries aka analytic queries. These are very useful capabilities available to SELECT statements and (roughly) standardized in SQL for about 20 years now. Windowing queries are ideal for running calculations among many other more complex calculations that would otherwise require a (client-side) table calc.
ReplyDelete